

USD/JPY ANALYSIS
USD/JPY FUNDAMENTAL BACKDROP
The Japanese Yen has sustained its depreciation against the U.S. Dollar after yesterday’s U.S. treasury yield rally – as higher bond yields generally lend itself to a stronger greenback. Today shows a marginal slowing in yields which could see a slight pullback amongst USD crosses.
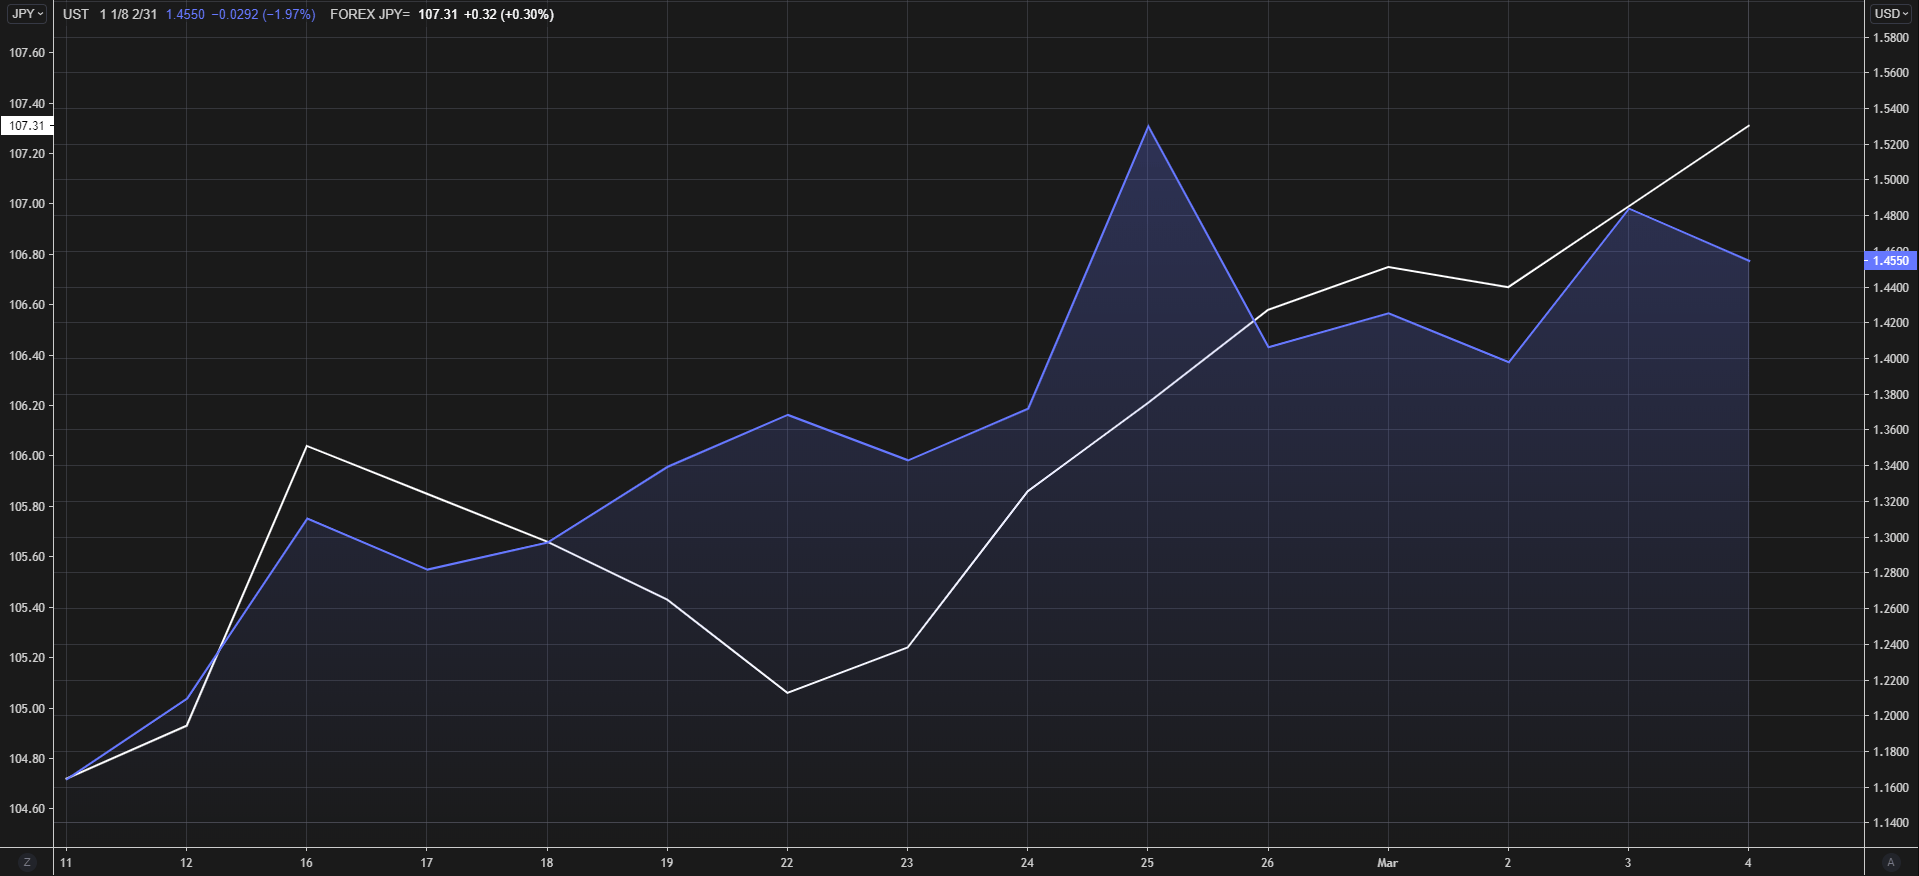
Later today, Fed Chair Powell will make an address outlining the risks associated with the recent spike in long-term borrowing costs. Higher U.S. borrowing costs are greatly amplified (negatively) by safe-haven assets such as the Yen (see chart below). Powell’s response to rising treasury yields will be interesting to see as markets await further transparency.
U.S. BENCHMARK 10Y TREASURY YIELDS VS USD/JPY
Chart prepared by Warren Venketas, Refinitiv
USD/JPY ECONOMIC CALENDAR
After Fed Chair Powell’s speech tonight (1705GMT) at the Wall Street Journal conference, the focus will shift to tomorrows NFP data (see calendar below) which is likely to provide some volatility pre and post announcement, particularly if actual figures markedly deviate from estimates.
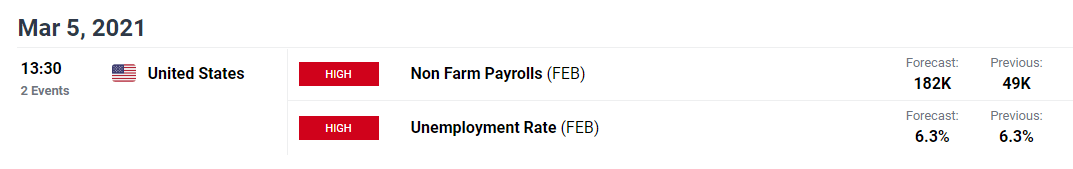
Source: DailyFX Economic Calendar

Recommended by Warren Venketas
Trading Forex News: The Strategy
USD/JPY OPTIONS
Notable options expiries (see below) on USD/JPY today at 1500GMT are also expected which could see a battle between stakeholders of the respective strikes. Generally, large options expiries are preceded by price moves toward the particular strike as it approaches expiration as investors push for their options contracts to expire in the money.
March 4, 2021:
- 106.30 – 106.50 (1BLN)
- 106.90 – 107.00 (535M)
Source: Refinitiv
USD/JPY TECHNICAL ANALYSIS

Recommended by Warren Venketas
Get Your Free JPY Forecast
USD/JPY Daily Chart:
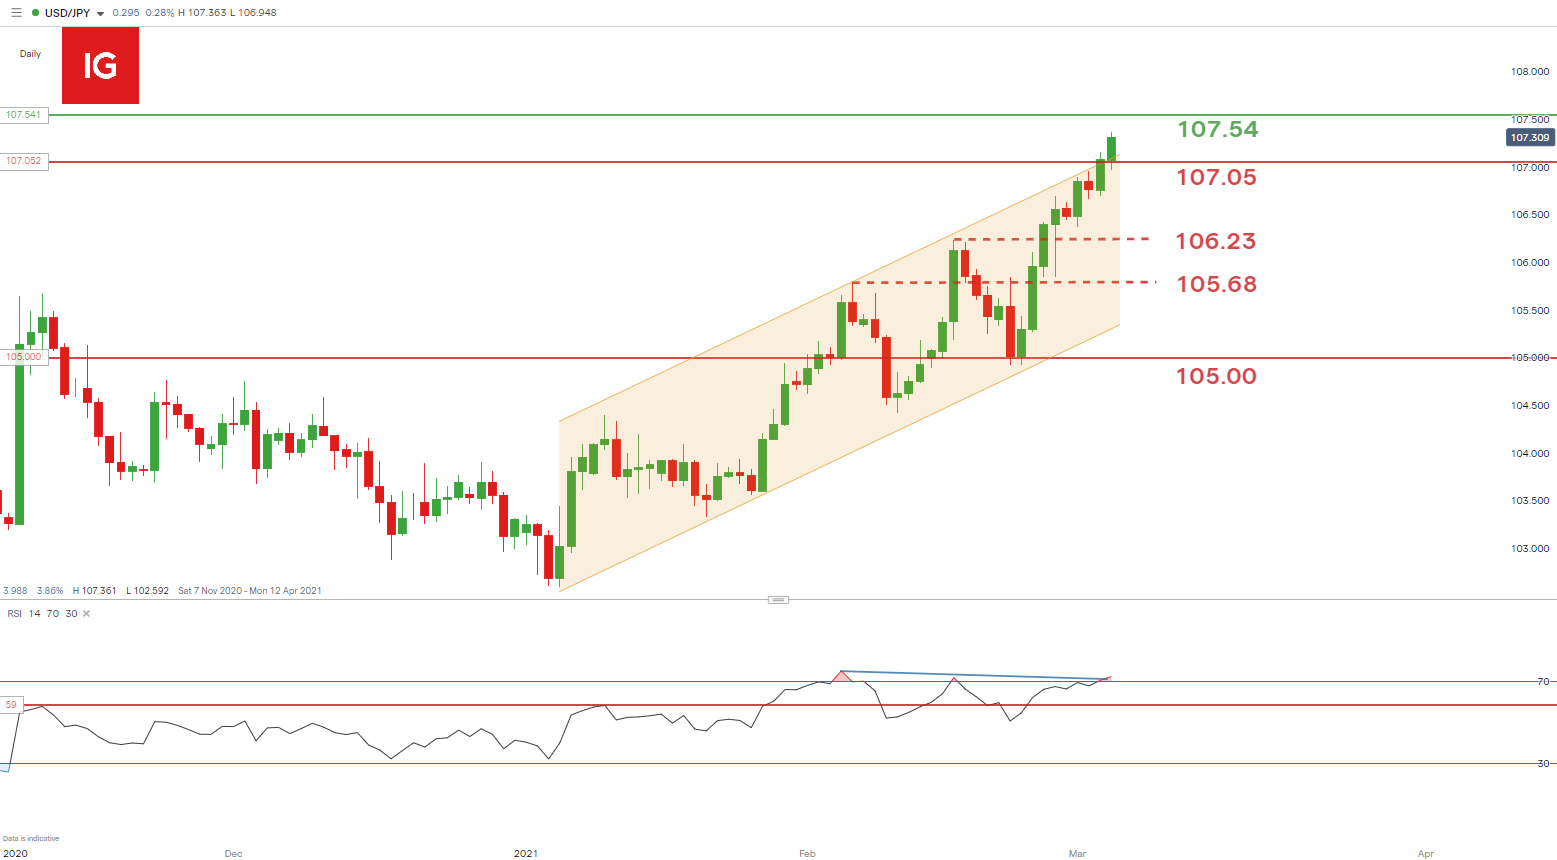
Chart prepared by Warren Venketas, IG
A strong week for USD/JPY bulls as price action presented a push above the key 107.00 psychological resistance level and the August 2020 swing high (107.05) – now support.
The bullish channel (yellow) has been breached at topside resistance which could be short-lived as bond yields rescind. The Relative Strength Index (RSI) shows a reduction in upside momentum while the USD/JPY spot price continues to push higher. This phenomenon is known as divergence and more specifically ‘bearish divergence’. Bearish divergence suggests that a possible price reversal may ensue however, the time horizon when judging divergence can lack clarity.
Further upside may be capped at resistance provided by the July 2020 swing high at 107.54or an resultant long upper wick candle (daily) formation at market close today. Should price rejection occur the 107.05 support level will reclaim short-term resistance.
From the bearish perspective, support targets will come from 107.05 followed by the 106.23 swing high.
Key technical points to consider:
Starts in:
Live now:
Mar 16
( 17:03 GMT )

Keep up to date with price action setups!
Trading Price Action
IG CLIENT SENTIMENT FAVORS BULLS
| Change in | Longs | Shorts | OI |
| Daily | -10% | -12% | -11% |
| Weekly | -22% | 33% | 1% |
IGCS shows retail traders are currently net long on USD/JPY, with 45% of traders currently holding long positions (as of this writing). Traders are further net-short than yesterday and last week, and the combination of current sentiment and recent changes gives us a stronger USD/JPY-bullish contrarian trading bias.
— Written by Warren Venketas for DailyFX.com
Contact and follow Warren on Twitter: @WVenketas
Be the first to comment