

USD/JPY and GBP/JPY Price, News and Analysis:

Recommended by Nick Cawley
Download our Fresh Q1 Japanese Yen Forecast
The US dollar has been the beneficiary of risk-off buying this week as equity markets turn lower, while heightened volatility in a few speculative stocks has also sent investors into the relative security of the greenback. While the Japanese Yen is also seen as a haven in times of turbulence, the US dollar remains the go-to currency when markets turn volatile.
For all market-moving economic data and events, see the DailyFX Calendar.
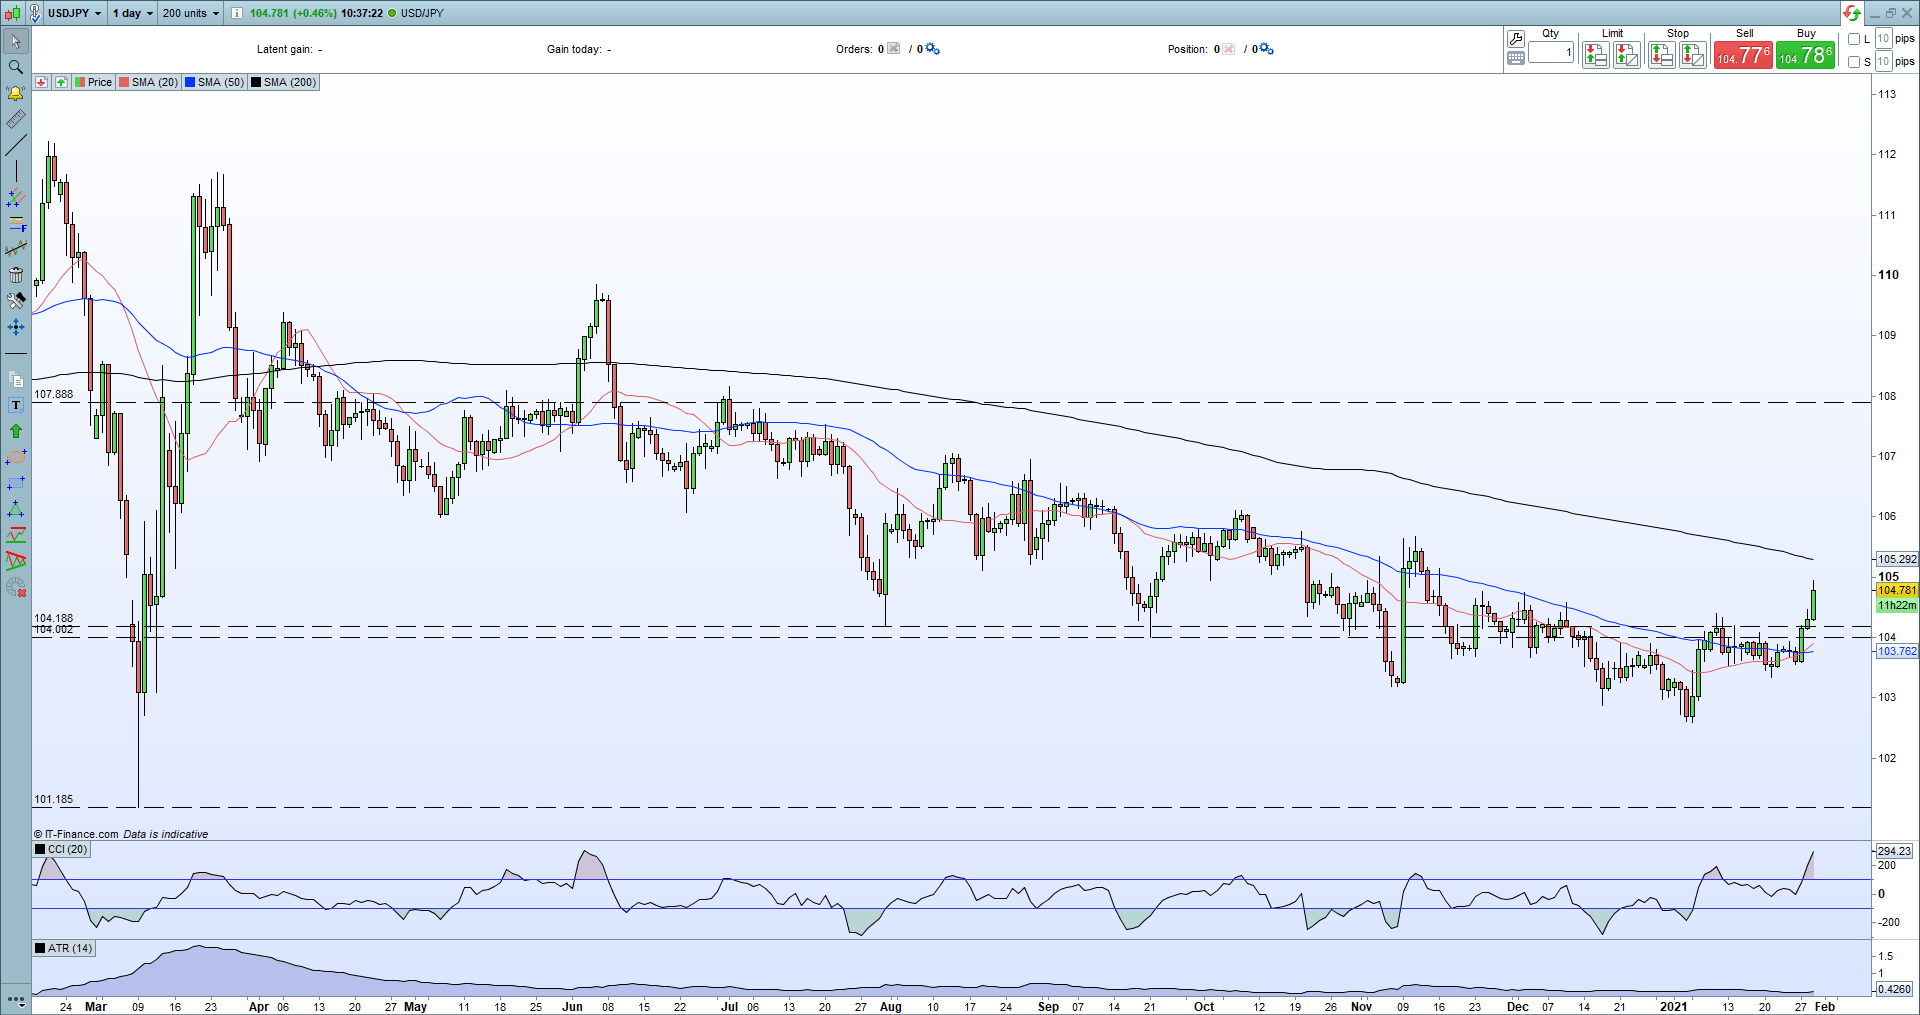
The recent pick-up in USD/JPY has turned the daily chart bullish with the pair making a confirmed break above both the 20- and 50-day simple moving averages. The series of lower from mid-last year also looks to have been broken, while a trade above 105.70 will see the series of lower highs also broken, confirming a positive turn around in the pair. The recent rally has placed the pair into heavily overbought territory and this indicator may need to turn lower before the recent rally can continue.
USD/JPY Daily Price Chart (February 2020 – January 29, 2021)
| Change in | Longs | Shorts | OI |
| Daily | -5% | -14% | -10% |
| Weekly | -22% | 5% | -11% |
IG Retail trader data show 52.53% of traders are net-long with the ratio of traders long to short at 1.11 to 1. We typically take a contrarian view to crowd sentiment, and the fact traders are net-long suggests USD/JPY prices may continue to fall.Positioning is more net-long than yesterday but less net-long from last week. The combination of current sentiment and recent changes gives us a further mixed USD/JPY trading bias.
GBP/JPYcontinues its slow grind higher and hit a near one-year high this week when it took out the old September 1 high. The technical set-up remains positive and Sterling as a currency is getting a small boost from the UK government’s vaccination program which has seen around 7.5 million first jabs already administered.
The daily chart shows the strength of the moving averages over the past few months with the 20-day simple moving average (red line) providing strong support. The September 1 high was also taken out this week, leaving the late-February swing high just under 145.00 the first target ahead of the December 2019 high print of 147.96. As with USD/JPY, the pair look overbought using the CCI indicator.
Moving Averages (MA) Explained for Traders
GBP/JPY Daily Price Chart (December 2019 – January 29, 2021)

What is your view on the Japanese Yen – bullish or bearish?? You can let us know via the form at the end of this piece or you can contact the author via Twitter @nickcawley1.
Be the first to comment