

Canadian Dollar Talking Points
USD/CAD snaps the opening range for February to trade to a fresh monthly low (1.2713), and the Relative Strength Index (RSI) may offer a bearish signal if the indicator fails to retain the upward trend from earlier this year.
USD/CAD Snaps February Opening Range to Put Upward RSI Trend at Risk
USD/CAD carves a series of lower highs and lows after staging a failed attempt to test the January high (1.2881), with the exchange rate slipping back below the 50-Day SMA (1.2771) to largely mimic the price action seen in November.
As a result, the rebound from the January low (1.2589) may end up being a correction in the broader trend rather than a change in USD/CAD behavior as key market themes remain in place, and swings in risk appetite may sway the exchange rate ahead of the next Bank of Canada (BoC) meeting on March 10 as the US Dollar still reflects an inverse relationship with investor confidence.
Souce: BoC
Looking ahead, it remains to be seen if the update to Canada’s Employment report will influence the monetary policy outlook as the economy lost 212.8K jobs in January, and signs of a slowing recovery may put pressure on the BoC to provide additional support as “growth in the first quarter of 2021 is now expected to be negative.”
As a result, the BoC may further utilize its non-standard tools as “the Bank will continue its QE (quantitative easing) program until the recovery is well underway,” but it seems as though Governor Tiff Macklem and Co. are in no rush to deploy more non-standard measures as “the Bank expects a strong second-quarter rebound.”
In turn, the BoC may largely endorse a wait-and-see approach over the coming months as the central bank insists that “the pace of net purchases of Government of Canada bonds will be adjusted as required,” and the Canadian Dollar may continue to appreciate against its US counterpart like the behavior seen throughout the second half of 2020 as the Federal Reserve stays on track to “increase our holdings of Treasury securities by at least $80 billion per month and of agency mortgage-backed securities by at least $40 billion per month.”
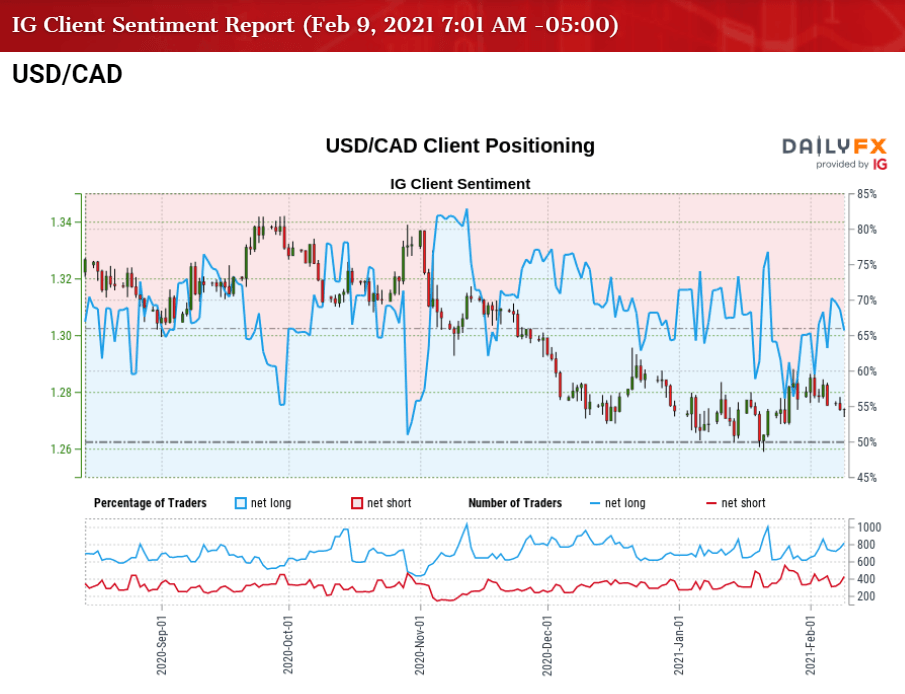
At the same time, the tilt int retail sentiment looks poised to persist as traders have been net-long the pair since May 2020, with the IG Client Sentiment report showing 62.30% of traders still net-long the pair as the ratio of traders long to short stands at 1.65 to 1.
The number of traders net-long is 12.67% lower than yesterday and 6.27% higher from last week, while the number of traders net-short is 43.44% higher than yesterday and 12.84% higher from last week. The decline in net-long position comes as USD/CAD snaps the opening range for February while the rise in net-short interest has helped to alleviate the crowding behavior as 70.86% of traders were net-long the pair during the previous week.
With that said, the rebound from the January low (1.2589) may end up being a correction in the broader trend rather than a change in USD/CAD behavior like the advance from the September low (1.2994), and the Relative Strength Index (RSI) may offer a bearish signal if the indicator breaks the upward trend from earlier this year.

Recommended by David Song
Learn More About the IG Client Sentiment Report
USD/CAD Rate Daily Chart
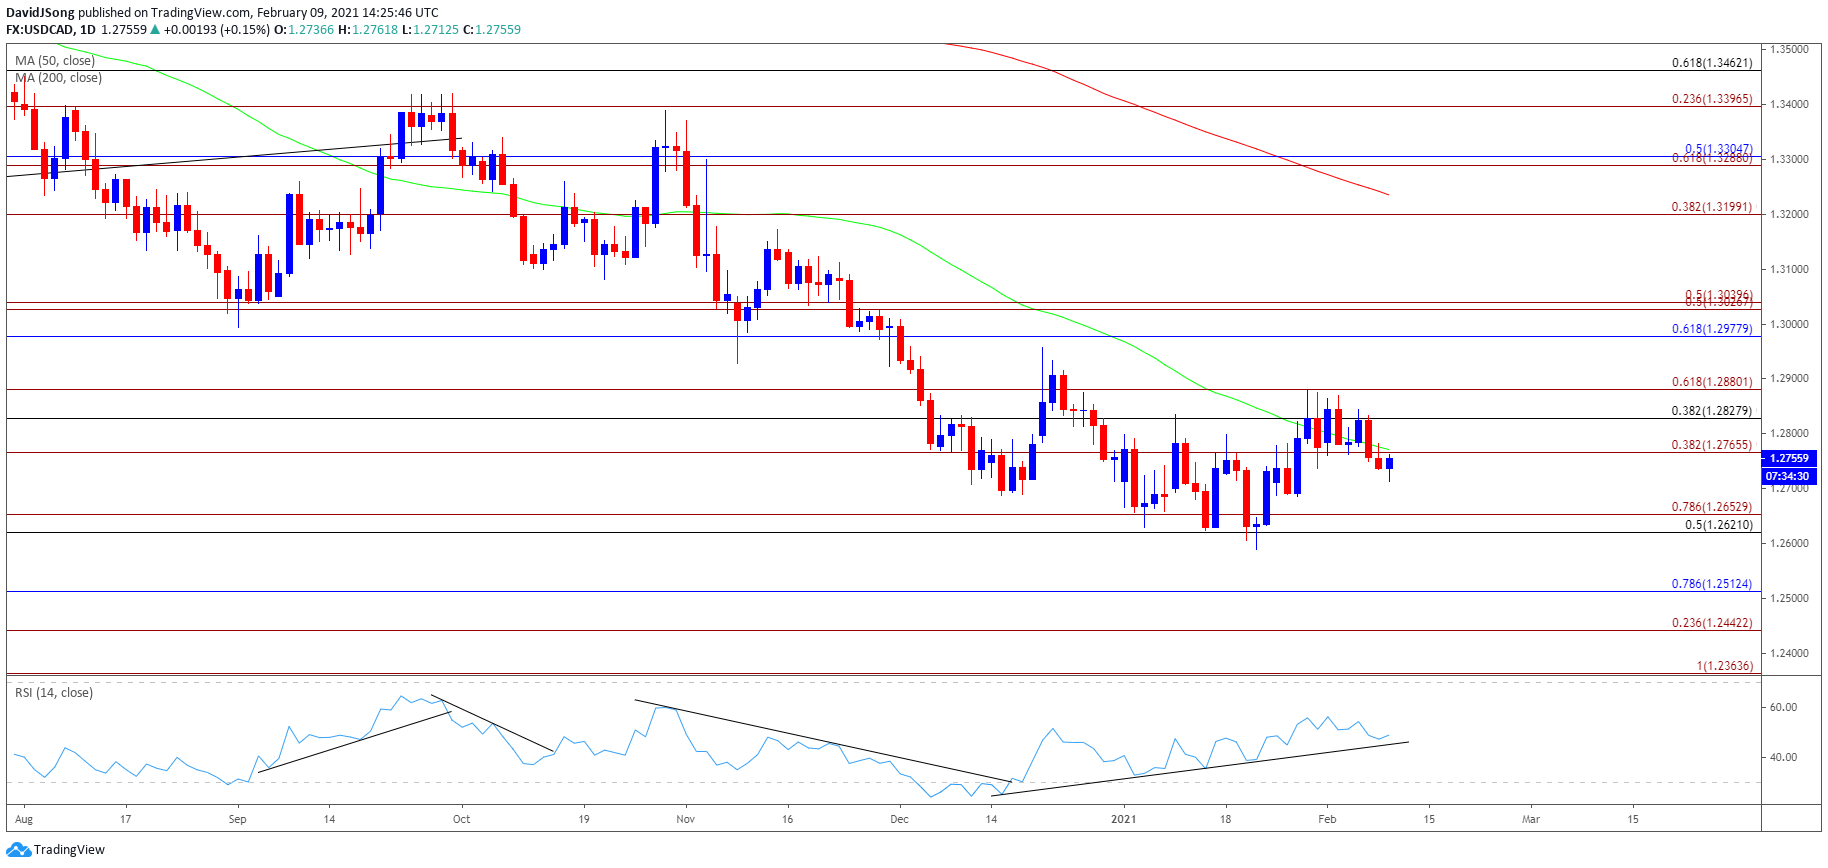
Source: Trading View
- Keep in mind, USD/CAD cleared the January 2020 low (1.2957) following the US election, with the exchange rate trading to fresh yearly lows in November and December as the Relative Strength Index (RSI) established a downward trend during the same period.
- USD/CAD started off 2021 by taking out last year’s low (1.2688) even though the RSI broke out of the bearish formation, with lack of momentum to hold above the 1.2770 (38.2% expansion) region pushing the exchange rate briefly below the Fibonacci overlap around 1.2620 (50% retracement) to 1.2650 (78.6% expansion).
- However, USD/CAD broke out of the opening range for January following the string of failed attempt to close below the 1.2620 (50% retracement) to 1.2650 (78.6% expansion) region, with the RSI diverging with price as it established an upward trend.
- Nevertheless, the rebound from the January low (1.2589) may end up being a correction in the broader trend rather than a change in market behavior as USD/CAD trades back below the 50-Day SMA (1.2771) after failing to test the January high (1.2881), and the RSI may offer a bearish signal if the indicator fails to retain the upward trend from earlier this year.
- The break/close below the 1.2770 (38.2% expansion) region brings the Fibonacci overlap around 1.2620 (50% retracement) to 1.2650 (78.6% expansion) back on the radar, with a break of the January low (1.2589) opening up the 1.2510 (78.6% retracement) area.

Recommended by David Song
Traits of Successful Traders
— Written by David Song, Currency Strategist
Follow me on Twitter at @DavidJSong
Be the first to comment