

Canadian Dollar, USD/CAD Price Analysis:
- The big story for today is in oil as crude oil prices continued their descent.
- Canada is heavily exposed to fluctuations in oil prices; but the move in USD/CAD appears more mild than the brutal move that showed in crude.
- USD/CAD gained as much as 13.2% in the first two-and-a-half months of the year; and since then the bullish trend has remained on pause.
USD/CAD Holds Above 1.4000 as Crude Oil Carnage Continues
It’s been a big start to the week as oil prices put in a historic move, with WTI for May delivery falling below the zero level. This continues the 2020 theme of pain in oil as both supply and demand have been very unfriendly for oil bulls. For the first two-and-a-half months of the year, that theme synced well with weakness in the Canadian Dollar, particularly in the USD/CAD pair that gained as much as 13.2% from the January low up to the March high.
That bullish theme became supercharged in mid-March as USD-strength entered the equation in a very big way, helping USD/CAD make a fast approach towards the 1.4690 level that currently constitutes the 17-year-high in the pair. Buyers shied away from a re-test at that level, and by the end of March price action had already moved back for a 1.4000 re-test. So far in April, buyers and sellers have both held the line, allowing for the build of a non-completed spinning top formation, indicated some element of indecision after an outsized move in Q1 of this year.
USD/CAD Monthly Price Chart
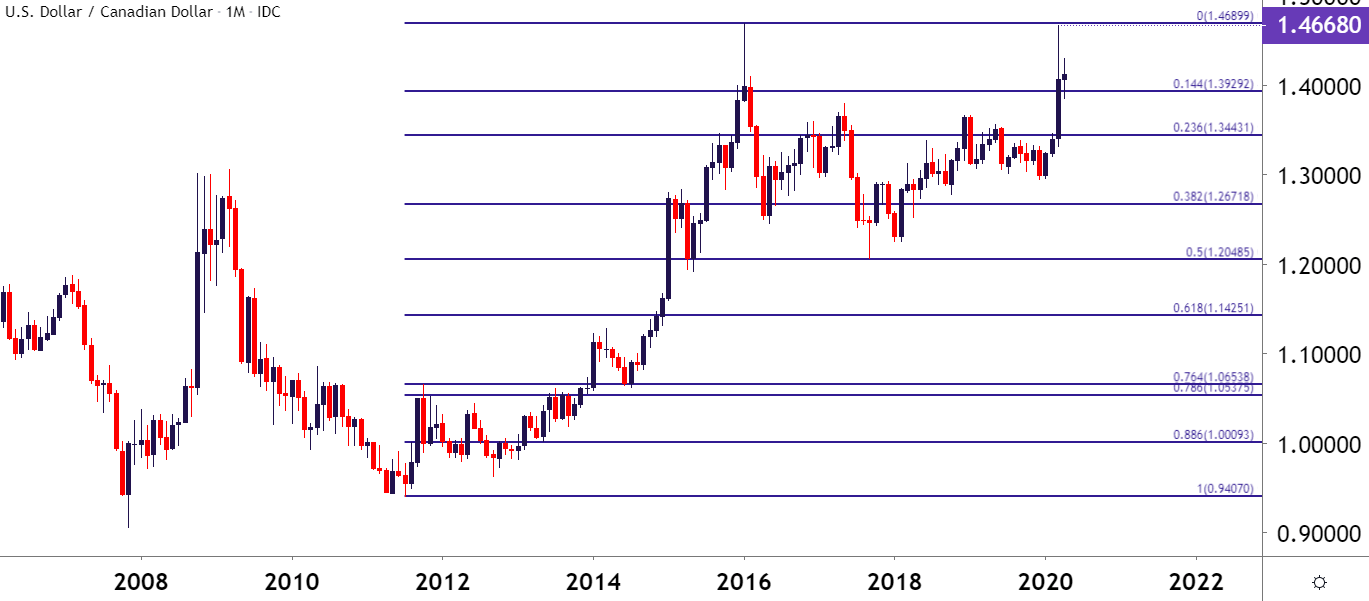
Chart prepared by James Stanley; USDCAD on Tradingview
Last week saw USD/CAD build a base of support just above the 1.3850 area on the chart, catching a bounce on Wednesday as price action in the pair pushed back-above the 1.4000 psychological level. That price has since held two separate support inflections; although buyers haven’t exactly been able to take-over in the matter, even with this extreme weakness in oil prices.

Recommended by James Stanley
Building Confidence in Trading
USD/CAD Four-Hour Price Chart
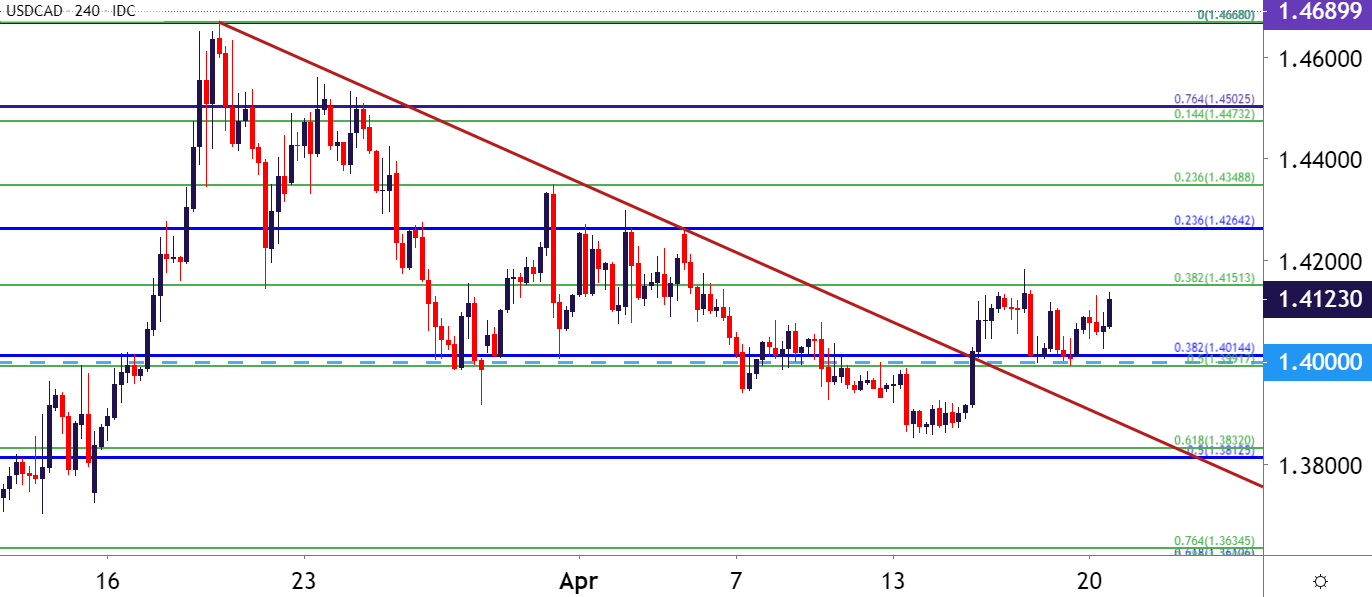
Chart prepared by James Stanley; USDCAD on Tradingview
USD/CAD Near-Term: Mean Reversion Clouds Directional Approaches
On a shorter-term basis, there’s little by way of short-term trends to work with, particularly given the mean reversion that’s held over the past few trading days. That 1.4000 level could be looked to for a longer-term support variable, and as noted earlier it’s already been tested twice, including around last week’s close. This week’s open, however, gapped-up a bit higher than the Friday close and, to date, that gap hasn’t yet been filled.
| Change in | Longs | Shorts | OI |
| Daily | 6% | 6% | 6% |
| Weekly | 41% | -25% | -1% |
This could place some emphasis on another potential support test around the 1.4000 big figure, and this is something that may potentially be workable for longer-term strategies in the pair.
USD/CAD Hourly Price Chart

Chart prepared by James Stanley; USDCAD on Tradingview
— Written by James Stanley, Strategist for DailyFX.com
Contact and follow James on Twitter: @JStanleyFX
Be the first to comment