

Editor’s note: Seeking Alpha is proud to welcome Robert Claassen as a new contributor. It’s easy to become a Seeking Alpha contributor and earn money for your best investment ideas. Active contributors also get free access to SA Premium. Click here to find out more »
bpperry/iStock via Getty Images
On Friday, June 10, 2022, the US Federal Treasury released new monthly budget data through May 31, 2022, and it is painting the rosiest budget outlook we have seen in decades. To date, one could argue that the financial press has not fully appreciated the magnitude of the positive data, and this will probably be the first time many readers will be made aware of the data and its implications. Here is what we now know:
- The federal budget is in balance and probably heading toward a sustained period of surplus;
- Federal revenues are growing at a 29% annual rate;
- Federal spending is declining at a 19% annual rate;
- The recent negative Q1 2022 GDP report is likely under-stating economic growth; and
- The true US debt load is much lower than the $30 trillion normally cited and is manageable.
You may be skeptical of these points given that they run 180 degrees counter to the current narrative. Let’s walk through the data and analysis, and I think you may come around to this new perspective.
The U.S. Federal Budget Is In Balance So Far In 2022
The US Department of Treasury reports federal receipts and outlays monthly. The latest numbers released in its report on Friday show that for the first five months of calendar year 2022, through May 31, 2022, Treasury collected $2.32 trillion in receipts and paid $2.37 trillion in outlays. For all intents and purposes, the budget is balanced for all of calendar year 2022 to date. The Treasury monthly report is here, and is very readable.
You may be thinking that since we only have 5 months of calendar year 2022 data through May 31, 2022, perhaps 5 months isn’t long enough to draw conclusions. I pulled all the historical monthly receipts and outlays data from the US Treasury database, and here is a graph of rolling cumulative 5-month deficits going back all the way to 1981:
US Treasury Summary of Receipts, Outlays and the Deficit/Surplus of the US Government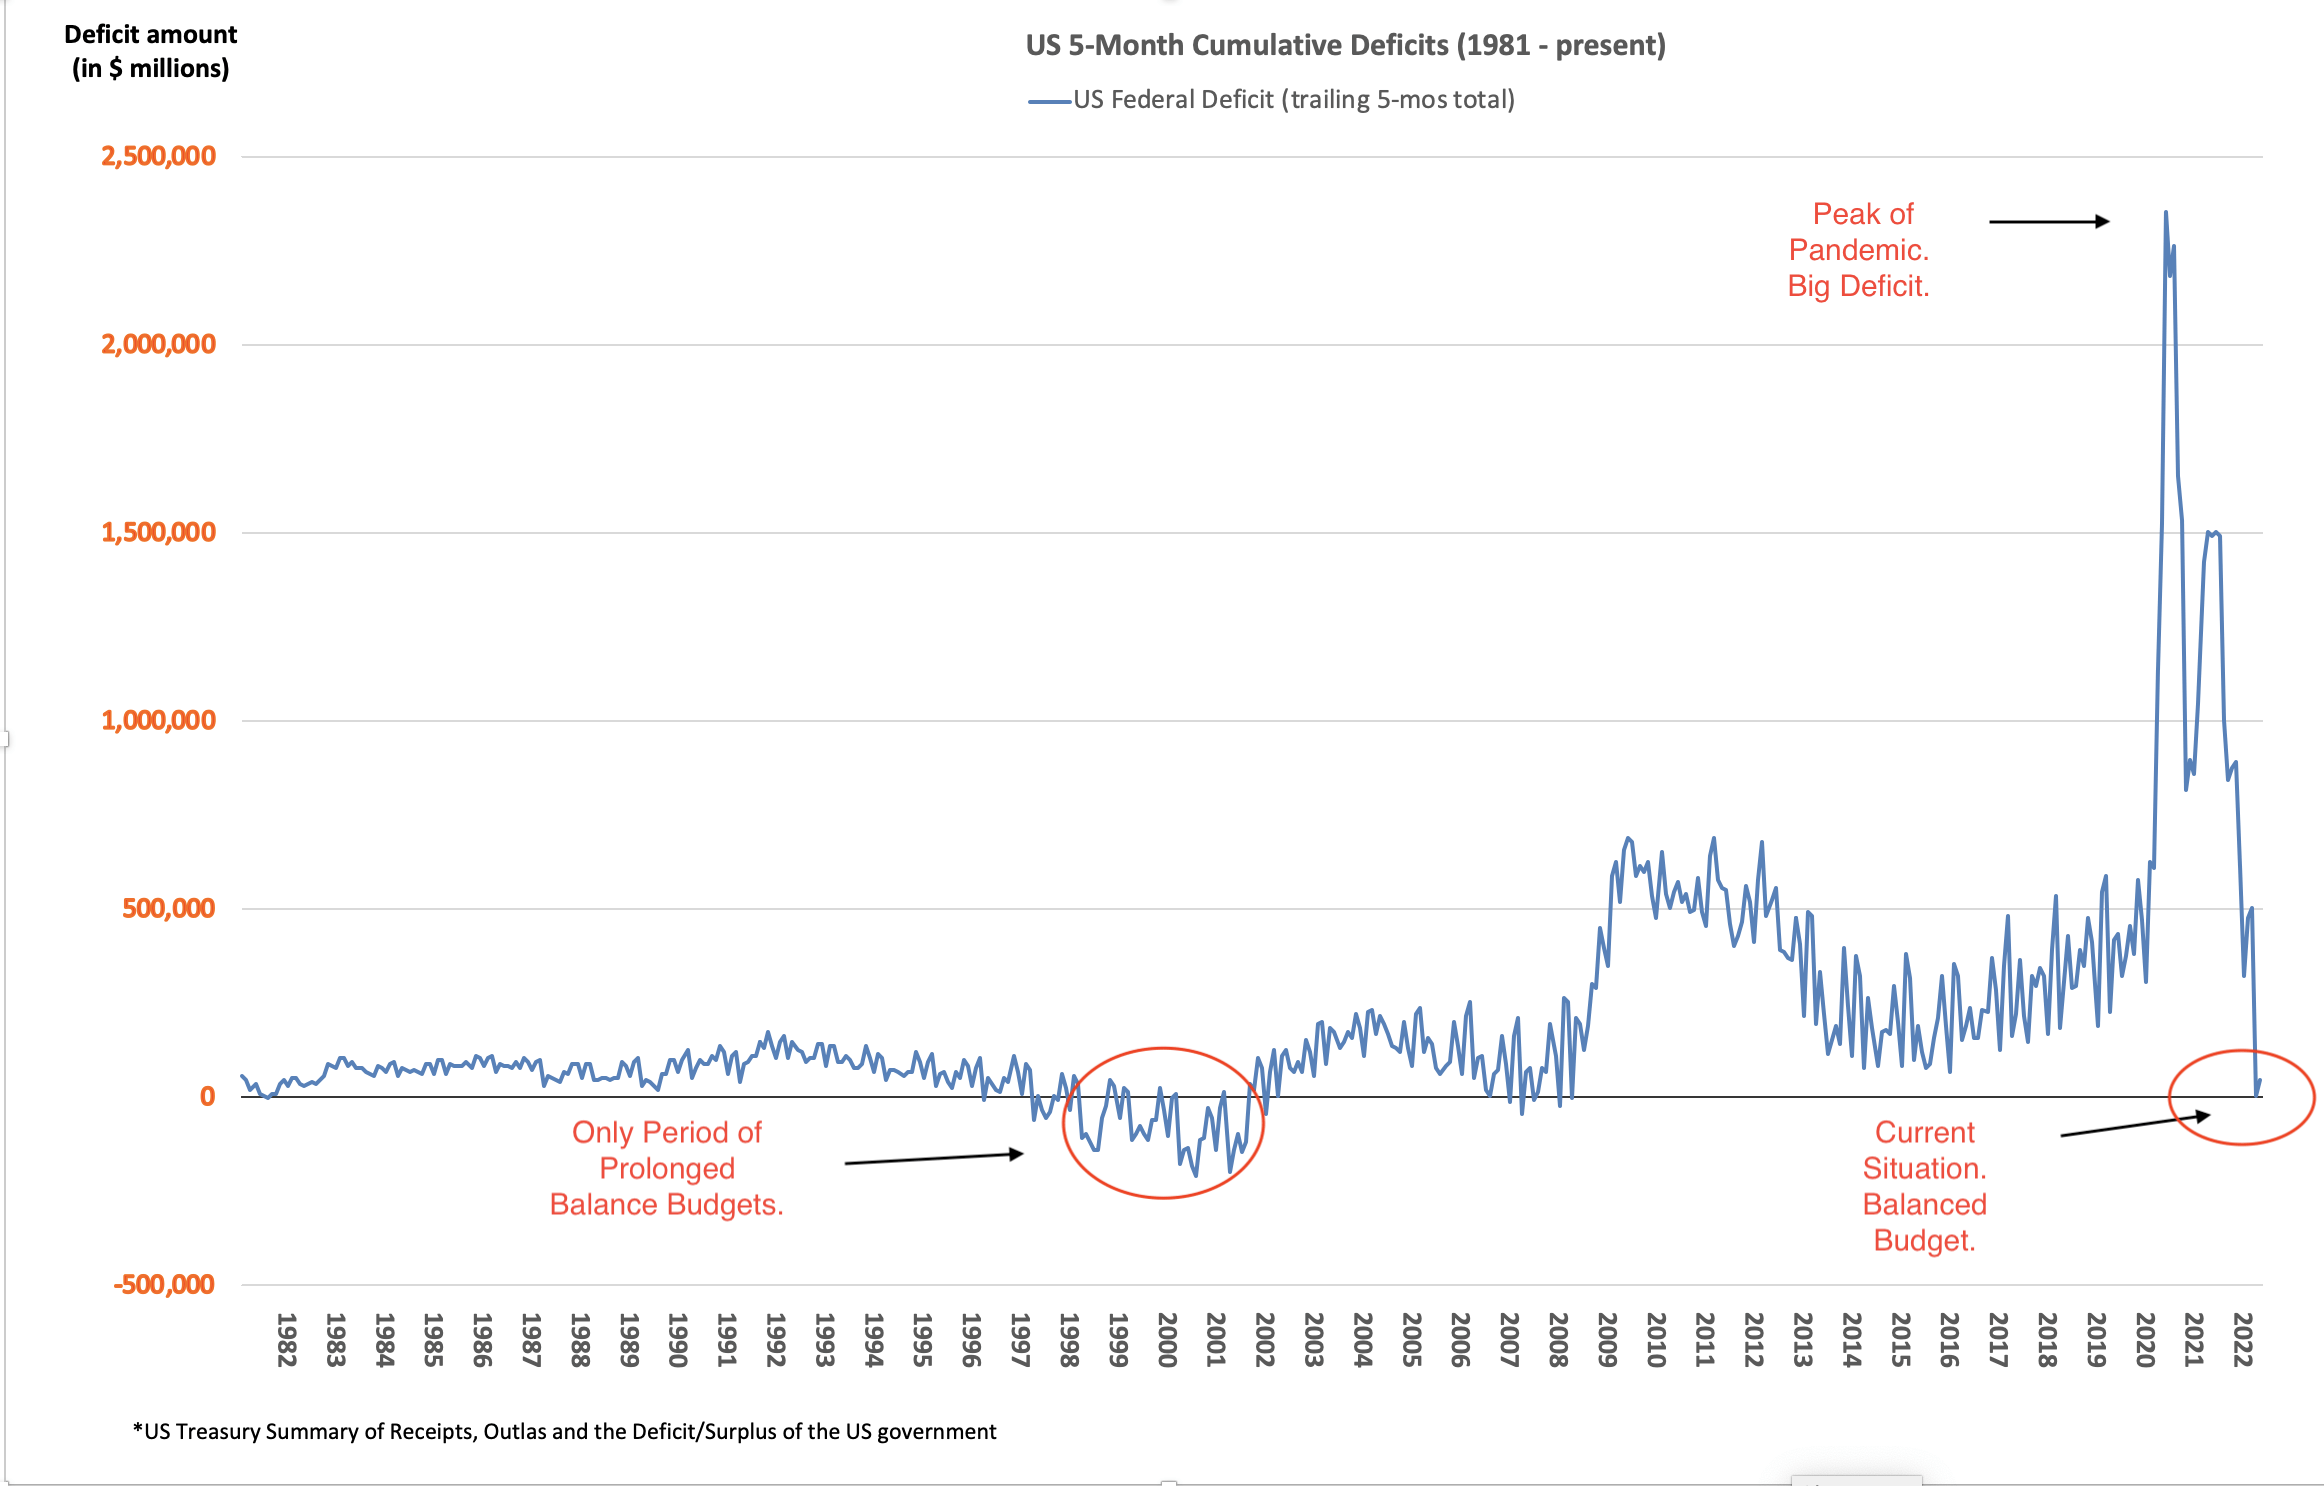
We can draw a number of conclusions from this graph and underlying data:
- Five months is long enough to show macro budget trends;
- It is very rare for the federal budget to be in balance for any 5-month period during the last 40 years,
- The federal budget is balanced and entering a period of historical strength; and
- The current rate of budget improvement is the fastest we’ve ever seen.
The only period of prolonged balance was 1998 through 2002, before the Afghanistan and Iraq wars. With the US military commitments winding down in the Middle East and changing US politics internally, it looks like we could be entering a similar period of sustained balance and surplus.
How is it possible that the budget has sprung back into balance so quickly after hitting record deficit levels in 2020? It’s pretty simple. Government receipts are way up and government spending is way down.
U.S. Federal Government Receipts Are Growing At A 29% Rate
During the current government FY 2022 (which started October 1, 2021), the US Federal Government collected $3.37 trillion of revenue. At this point in fiscal year 2021, collections were only $2.61 trillion. This represents a 29.45% increase year over year, following similar growth in 2021. That type of growth is hard to fathom. Here is a graph of year-over-year change in federal receipts for the first eight months of the fiscal year ending May 31, for every fiscal year going back to 1981.
US Treasury Summary of Receipts/Outlays and the Deficit/Surplus of the US Government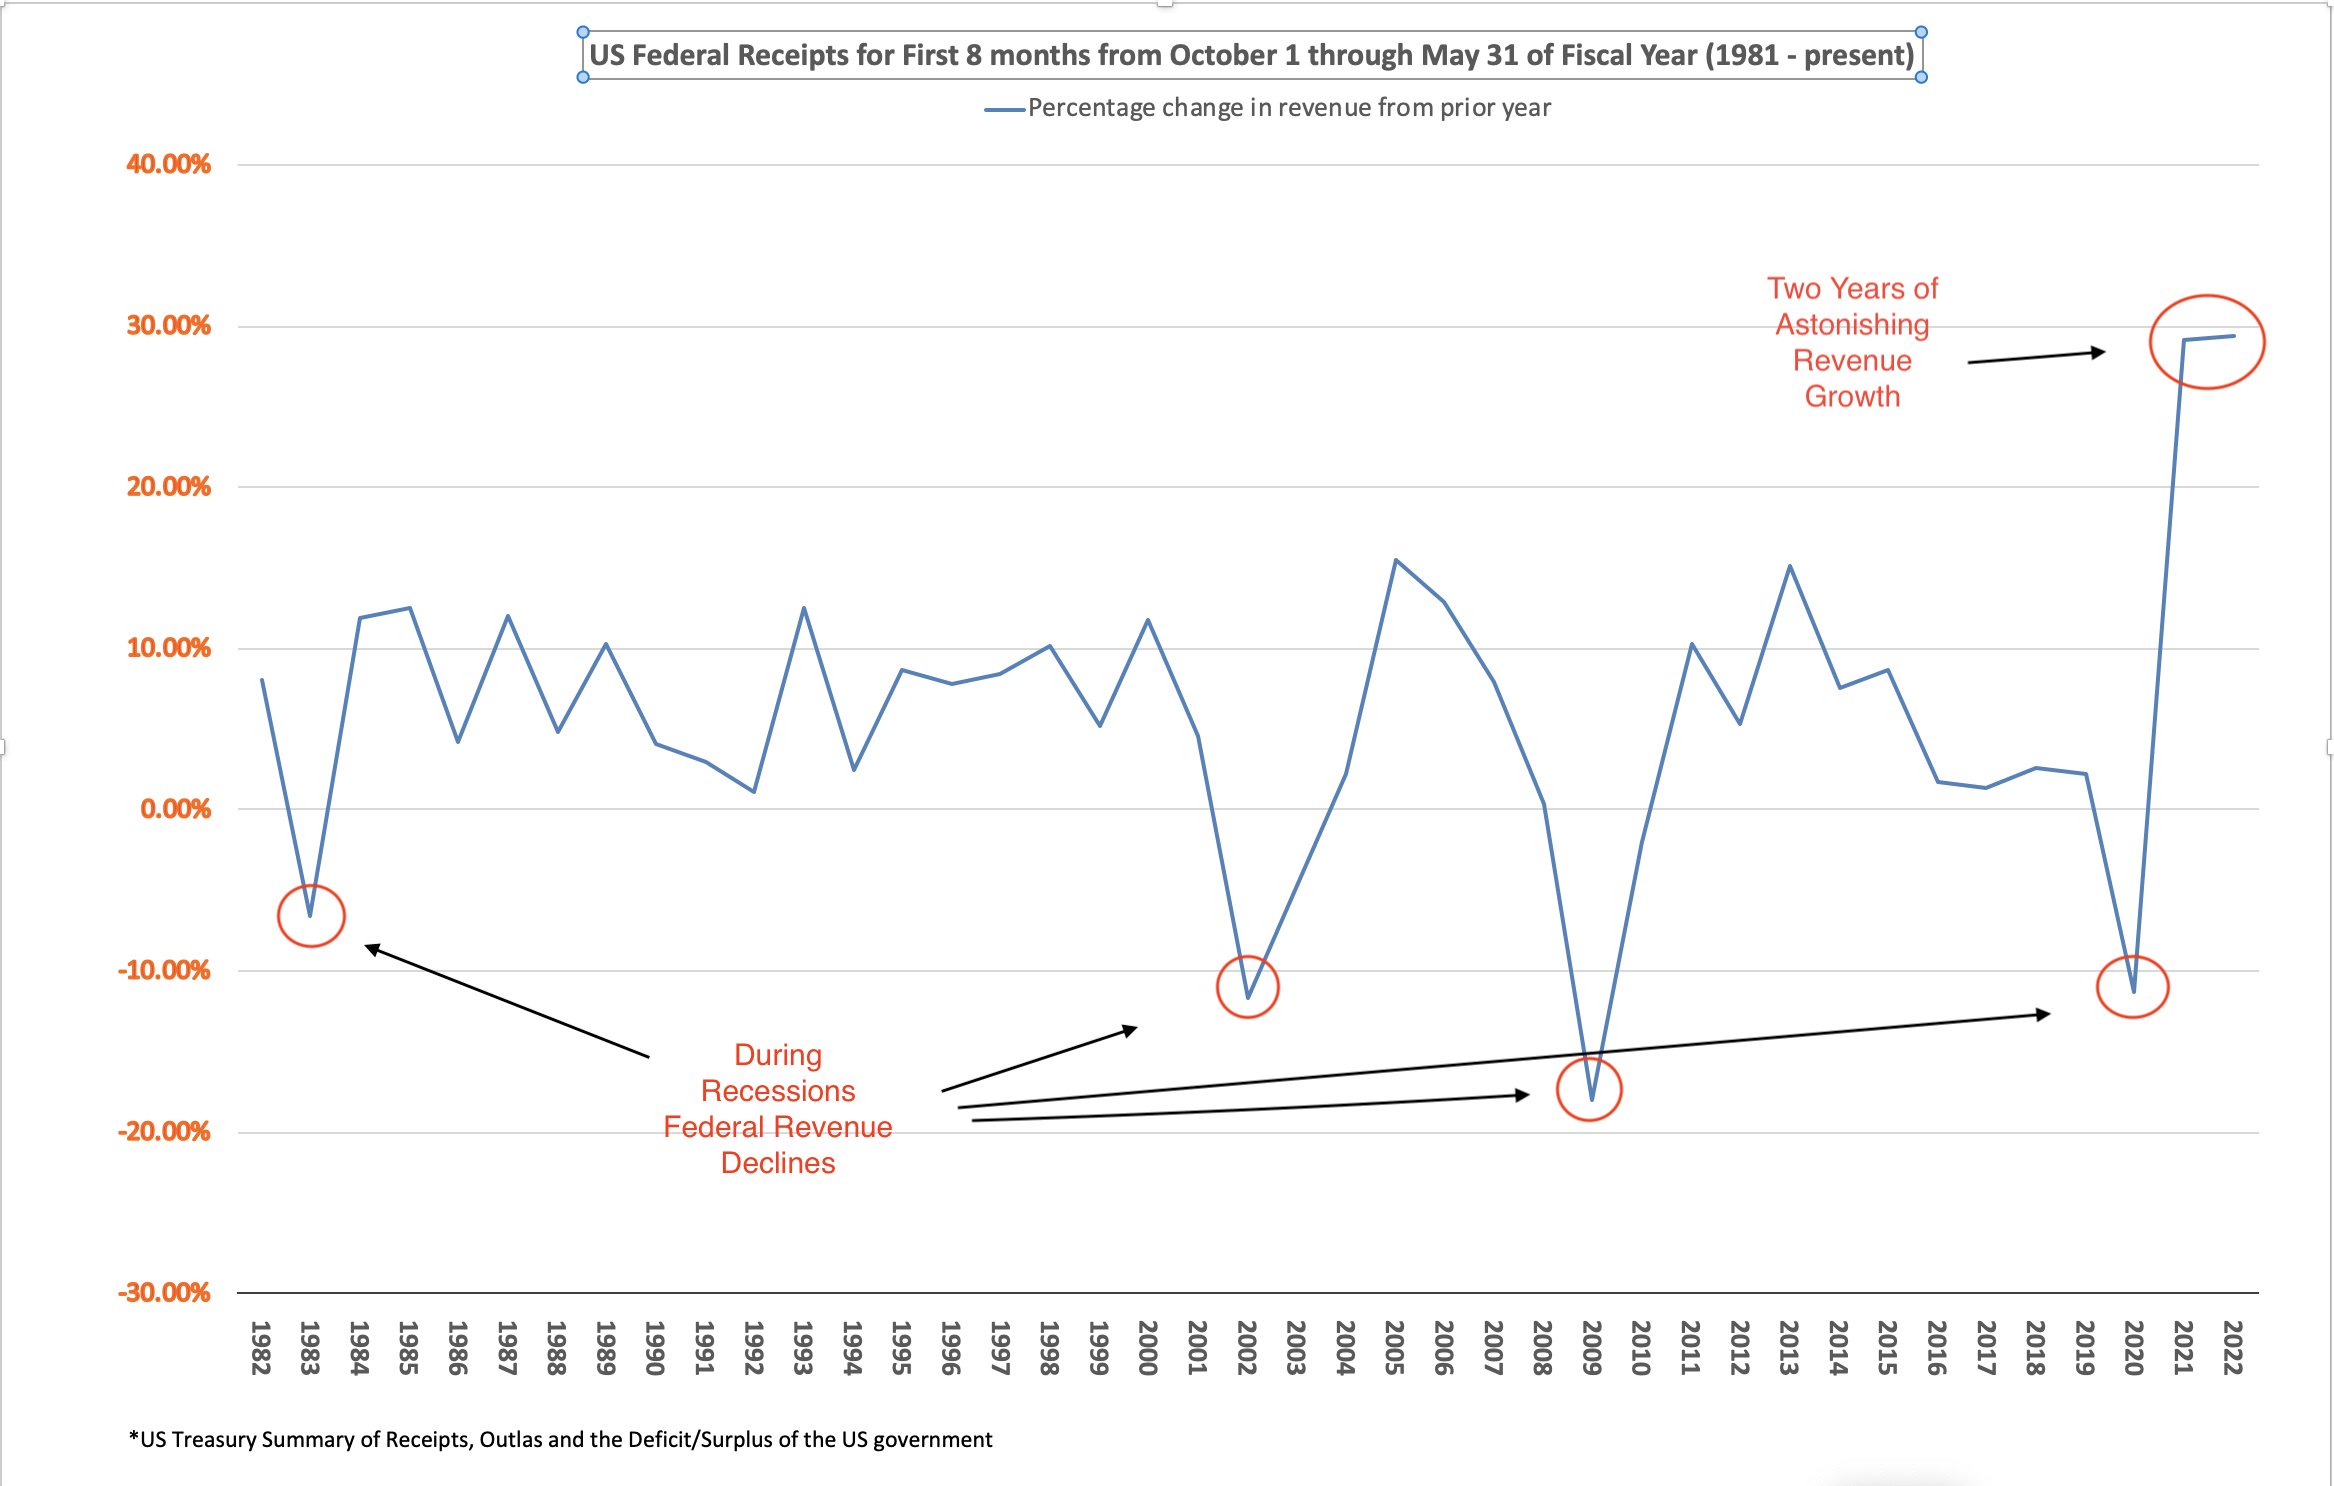
The graph shows just how extraordinary the growth in federal revenues has been so far in FY 2022. This is not consistent with prior recessions.
The make-up of federal revenue growth is even more encouraging.
|
Classification |
Oct 2021 -May 2022 |
Oct 2020 -May 2021 |
Growth Rate |
|
Individual income taxes |
$ 1,934,657 |
$ 1,325,823 |
45.9% |
|
Corporate taxes |
$ 223,498 |
$ 190,955 |
17.0% |
|
Social Security Retirement |
$ 978,948 |
$ 900,855 |
8.7% |
|
Excise Taxes |
$ 53,384 |
$ 43,285 |
23.3% |
|
Estate and Gift taxes |
$ 21,633 |
$ 19,091 |
13.3% |
|
Customs Duties |
$ 65,817 |
$ 50,199 |
31.1% |
|
Miscellaneous |
$ 96,692 |
$ 76,672 |
26.1% |
|
Total |
$ 3,374,629 |
$ 2,606,879 |
29.5% |
*Dollar amounts in millions
Individual income tax receipts are growing at a jaw-dropping 46% rate so far in FY 2022. There weren’t any significant income tax rate changes during this period that I am aware of, so how exactly is this type of growth even possible? This is the federal government, not a Silicon Valley start-up. Some of it could be from capital gains on the strength of the housing and equity markets. But one thing is certain: people generally do not pay income taxes when they are not earning income. This type of personal tax receipts growth is probably not possible without big income increases likely fueled by strong economic growth.
Federal Government Spending Is Declining At A 19% Rate
While revenue has been growing rapidly, powered by rapid income growth, the following graph shows that federal spending has fallen year over year at the fastest rate in decades.
US Treasury Summary of Receipts/Outlays and the Deficit/Surplus of the US Government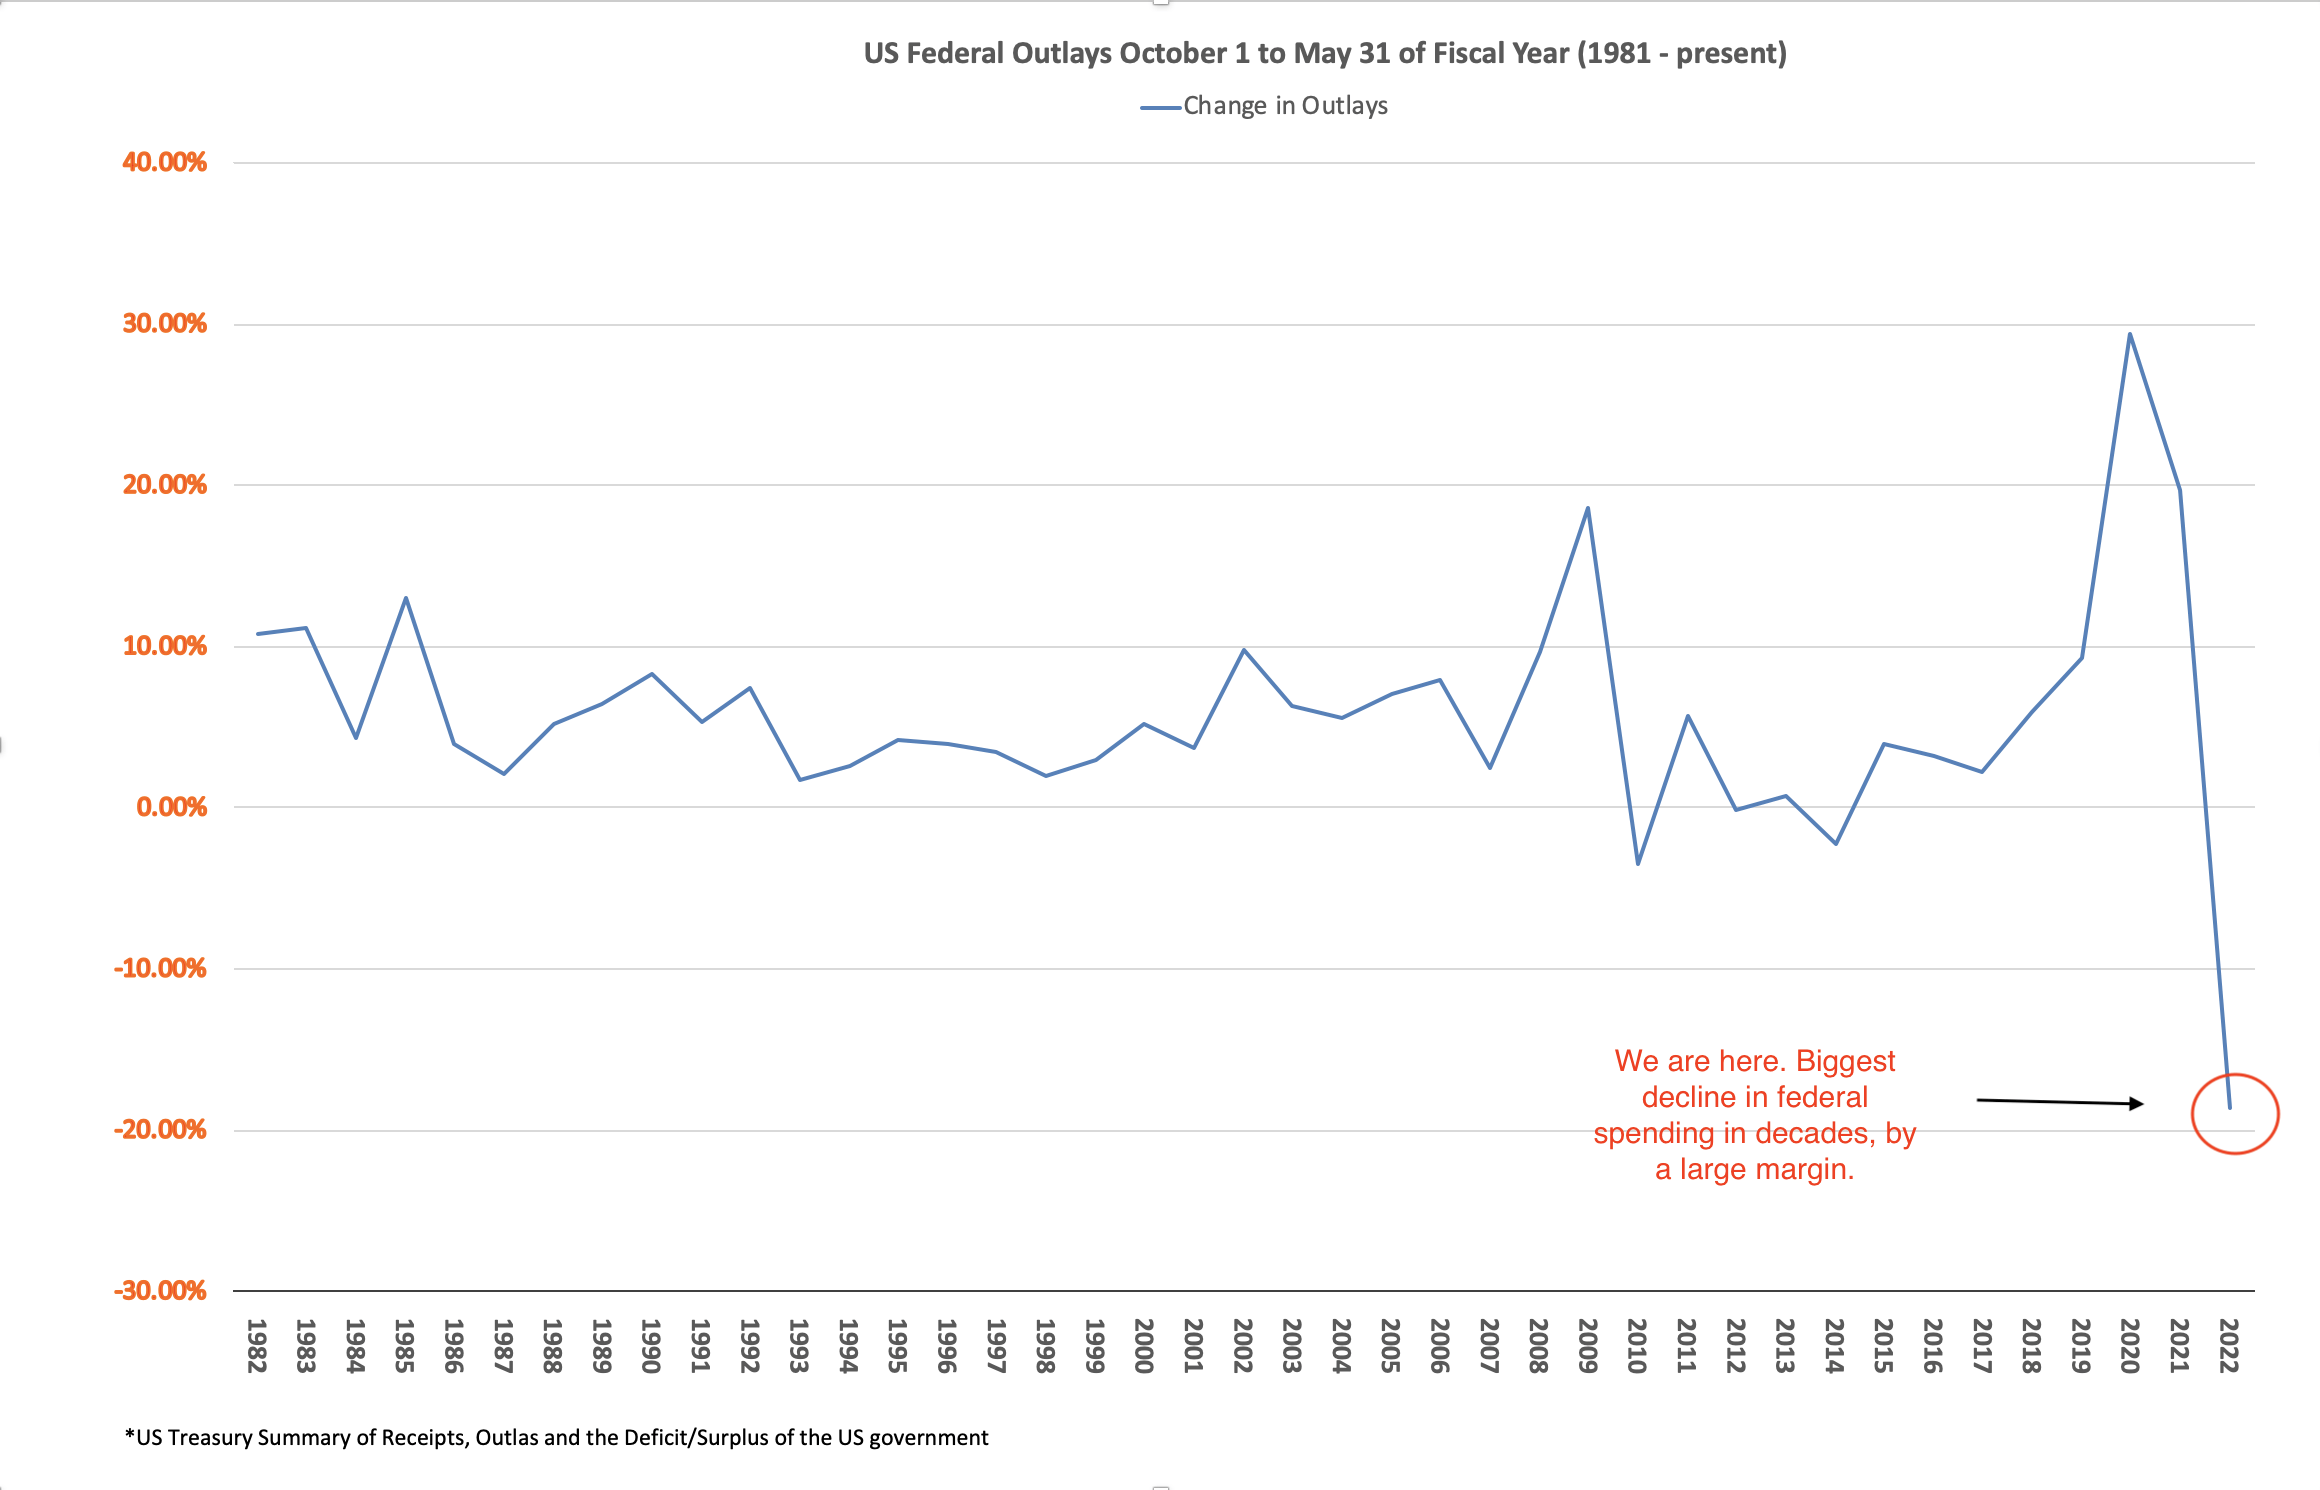
For the first 8 months of government fiscal year 2022, federal government outlays were $3.80 trillion against $4.67 trillion spent during the same period in 2021. That’s a 19% decline, which is the largest decline year over year in the last 40 years, by a large margin. Any decline has been rare during this period.
To summarize, for the first eight months of government fiscal year 2022, government receipts are up 29% and spending is down 19%.
|
Oct 2021 -May 2022* |
Oct 2020 -May 2021 |
Growth Rate |
|
|
Receipts |
$3,374,629 |
$2,606,879 |
29.5% |
|
Outlays |
$3,800,854 |
$4,670,668 |
-18.6% |
*Dollar amounts in millions
Here is the breakdown of federal spending by category:
|
Oct 2021 -May 2022* |
Oct 2020 -May 2021 |
Growth Rate |
|
|
Social Security |
$800 |
$750 |
6.7% |
|
Income Security |
$649 |
$1,273 |
-49.0% |
|
Health |
$611 |
$517 |
18.2% |
|
Medicare |
$459 |
$455 |
0.9% |
|
National Defense |
$495 |
$504 |
-1.7% |
|
Net Interest |
$311 |
$240 |
29.6% |
|
Other |
$476 |
$932 |
-48.9% |
|
Total |
$3,801 |
$4,671 |
-18.6% |
*Dollar amounts in billions
The decline in spending is due to the reduction in pandemic relief mostly in the “income security” and “other” categories. National defense has also been declining presumably with the reduction of military commitments in the Middle East.
The biggest driver of the decline was the short-term nature of the large federal pandemic relief bills. The list of pandemic relief bills passed in 2020 and 2021 is truly remarkable. First, there was the Coronavirus Preparedness and Response Supplemental Appropriations Act of March 8, 2020. That was quickly followed by the Families First Coronavirus Response Act on March 18, 2020. Then on March 27, 2020 the Cares Act passed, followed by the Paycheck Protection Program and Health Care Enhancement Act a month later. All told, these first relief and spending bills approved over $2.9 trillion of appropriations.
At the end of 2020, Congress approved another $920 billion of relief as part of its annual appropriates bill, which was followed by a $1.9 trillion relief bill in early 2021 right after the Biden administration took over. In total, the pandemic relief spent was many trillions of dollars, and of course, that caused the US to run record-breaking deficits in Fiscal Years 2020 and 2021.
From the depths of the pandemic, the financial picture looked bleak. Federal spending and debt were way up, coronavirus was raging, businesses were closing and unemployment was high. Maybe it was justified for people to have a negative view of the federal budget and economy in 2020 and 2021. But these negative views are no longer warranted. The federal stimulus spending is winding down and new spending has not been passed to replace it.
The Biden administration attempted to pass new spending as part of its Build Back Better plan, but the spending mostly stalled in the Senate, due to concern from moderate Democrats and a lack of bipartisan support. Other spending bills were approved, but they weren’t big enough to blow up the budget. In late 2021, Congress passed a $1.2 trillion infrastructure package, after a lengthy fight. Congress also recently approved military aid for Ukraine. Congress will be Congress, and Congress spends money.
But when you look under the hood at the new spending, it’s not that large when measured against the federal budget. The Ukraine aid package appears to be only about $40 billion, which will be less than 1% of expected federal receipts in 2022. The infrastructure bill had a large $1.2 trillion price tag, but the outlays are to be spent over a number of years, reducing the impact on fiscal year 2022.
To summarize, notwithstanding the constant bickering one hears from Washington, Congress has quietly managed to get control of federal spending. The pandemic relief is winding down, military spending is declining, and new spending has been reigned in.
The Q1 GDP Report Doesn’t Change The Outlook
The First Quarter 2022 GDP report, or “Advanced Estimate” as the Bureau of Economic Analysis (BEA) calls it, reported a 1.4% decline in GDP for the first quarter of 2022. Some analysts are predicting a near-term recession on the heels of this report. It is true that recessions typically cause tax revenue to fall and spending to rise, leading to government deficits. We saw this in the two most recent recessions, 2009 and 2020. That being said, the negative Q1 report published by the BEA doesn’t foretell a recession. It appears to suggest the opposite. The report is here.
The way BEA does its calculations, declining “government consumption and investment expenditures” will reduce GDP dollar-for-dollar. And the decline in the Q1 GDP estimates was caused by a decline in federal spending, the very decline that is putting the budget in balance, that is discussed above.
If one dives a little deeper into the Q1 GDP report, it actually shows that the private economy grew rapidly. Real disposable personal income of Americans grew at a 4.8% year over year, a reflection of strong private sector growth. Of course, if personal tax revenue is growing at a rate of 46% year over year through May 31, the private economy is likely growing significantly faster than the 4.8% rate BEA reported. Again, people don’t pay taxes out of the goodness of their heart. They pay taxes when they have income.
There is a big discrepancy between BEA and Treasury, given that 46% is an order of magnitude larger than 4.8%. A lot of that is due to the fact that the 4.8% is real (i.e., is adjusted for changes in prices), while the 46% is nominal. The important point though is that treasury data is based on actual cash receipts and tends to track nominal economic growth fairly closely. In this case, it is impossible to believe that the private sector economy could be growing at a nominal 46% rate. The Congressional Budget Office, or CBO, has indicated here that as fiscal year 2022 winds down, over the next 4 months, the 46% rate is likely to decline. CBO is historically very conservative in their predictions, but they are likely correct, at least directionally. If I were to venture a guess, and this is only a guess, it would be that private sector economic nominal growth could be in the 15% to 20% range, with maybe half of that being due to inflationary pressures, and the rest being real growth. Even that type of growth rate is very high by historical standards. But it would help explain other things we are seeing like big increases in home values, rapid increases in the amount of US imports, and the massive supply chain challenges. More analysis should be done by economists.
U.S. Government Debt Is Very Manageable
Let’s now turn to the elephant in the room, the massive amount of debt that the federal government supposedly owes. As of May 31, 2022, Treasury reported that the federal government had total treasury securities outstanding of $30.5 trillion.
Ray Dalio, the CIO and founder of Bridgewater Associates, recently remarked that the US debt is so large that the country will likely have to inflate the currency to repay the debt, which will cause the destruction of the US Dollar and maybe even civil conflict. He went on to say that “cash is trash” referring to the US Dollar. Mr. Dalio isn’t alone in these beliefs. The level of US debt is causing hand-wringing among many financial analysts, politicians, commentators, and even the public at large. He just happens to be one of the most well-known pessimists, or pessimistas, as I like to call them.
Like with the budgetary and economic concerns noted above, the debt spiral concerns are way overblown.
Here is the make-up of US federal debt:
|
Amount as of end of May 31, 2022* |
|
|
Total Debt |
$30.5 |
|
Debt held by Treasury for other agencies |
$6.6 |
|
Debt held by the Public |
$23.9 |
|
Federal Debt held by Federal Reserve Banks |
$5.8 |
|
Debt owed to 3rd parties |
$18.1 |
|
Cash held by Treasury |
$1.1 |
|
Other Marketable Securities held by the Fed** |
$3.2 |
|
Net debt owed to 3rd parties |
$13.8 |
*Dollar amounts in trillions, **Federal Reserve Board Statistical Release H.4.1 Factors Affecting Reserve Balances
As this table shows, only $18.1 trillion of the $30.5 trillion of debt is owed to third parties. The remaining $12.4 trillion in debt is not real debt.
Here is how I get there. Of the $30.5 trillion, $6.6 trillion is debt held in trust by Treasury for the benefit of other US Federal Government agencies like the Social Security Administration. When you disassemble that arrangement, it becomes apparent that this is really just an IOU from the Federal Government to itself held in trust by itself. IOUs from the federal government to itself are not actual debt or assets, they are just intra-agency accounting ledger entries. Treasury implicitly acknowledges this by removing this $6.6 trillion when they report “Debt held by the Public’.
One could argue that even though the debt is intra-agency, it still serves an important function by securing future entitlement spending. That argument is wrong. Entitlement payments like social security run through the general budget every period. There is no separate retirement account held for beneficiaries of this spending. They just receive a check from the Treasury. The treasury securities held by Treasury for the benefit of other agencies do not secure anything or change what is owed or paid. The current budget is in effective balance even with the large entitlement payment obligations included in the outlays. Yes, the US should do a better job of securing its future entitlement payments with real assets. But, if IOUs to oneself actually worked, we could all just drop personal IOUs into our 401k accounts and fund our own retirements.
Another $5.8 trillion of the $30.5 trillion is owned by Federal Reserve Banks. The Fed is supposed to be independent and separate from the federal government, but it is not independent economically. The sole beneficiary of the Fed’s assets is the US Treasury. Economically speaking, the Fed is really just another federal agency, with a slightly more complex governance. This $5.8 trillion of treasuries was purchased by the Fed over the past 13 years as part of its “quantitative easing” program. Quantitative easing was the term that the Fed gave to its purchases of outstanding treasury securities and other assets in exchange for new dollars created in the form of bank reserves. The effect of quantitative easing has been hotly debated in economic circles. But there is no debating that it had one big positive effect, namely that the Federal Reserve’s treasury bond purchases significantly reduced the outstanding federal debt. Following all the quantitative easing, the Fed now owns $5.8 trillion of US treasuries, which are now just intra-government ledger entries and not real debt.
Perhaps the Fed will sell those treasuries back into the market down the road, at which point, the bonds would once again become actual federal debt owed to the public. But as of today, the debt held by the Fed creates zero credit risk for the US federal government. The intra-agency debt held by the Fed and other agencies could be cancelled tomorrow, which would immediately reduce the national debt by nearly half without impacting any third party.
In addition, commentators also fail to mention that the federal government holds a lot of liquid assets they could apply against the debt tomorrow. Between Federal Reserve Banks and Treasury, the federal government held approximately $4.3 trillion of cash and liquid securities as of May 31. The federal government also owns trillions of dollars worth of federal land, buildings and other assets.
To be clear, I’m not suggesting the federal government should or will liquidate assets to pay off its debt, I’m just pointing out that the federal government could do it if needed.
Conclusion
Sure $18.1 trillion of debt held by third parties is a lot, but with the rapidly improving federal budget picture, the debt is very manageable. All of the above points also make me believe the economy is likely much stronger than what the Q1 GDP report suggests. Good news can be hard to hear. Please don’t shoot the messenger.
Be the first to comment