

buzbuzzer
Urstadt Biddle Properties, Inc (NYSE:UBA) owns or has equity interests in 77 properties that primarily consists of neighborhood and community shopping centers, anchored by supermarkets, pharmacy/drugstores, and wholesale clubs.
Geographically, their operations are concentrated in the tri-state area outside of New York City in areas with above average median household income. In fact, the median household income within a 3-mile radius of their properties is 63% higher than the national average. This is among the highest of all retail REITs.
The higher incomes, in turn, support the company’s tenant base, which are predominantly large national and regional companies with necessity-based business models. Some of their top tenants include large regional supermarkets, such as Stop & Shop, Acme, and ShopRite, as well as national names, such as CVS Pharmacy (CVS) and The TJX Companies (TJX).
June 2022 Investor Presentation – Summary Of Top Five Tenants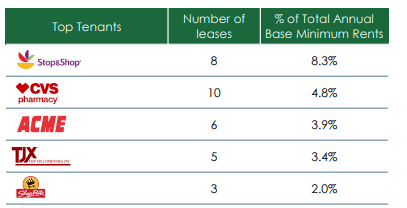
YTD, shares are down 13%, which is better than losses of over 20% experienced in the broader FTSE All Equity Real Estate Index. It also beats the 16% decline in the broader S&P 500. In addition to relatively stronger performance over the past year, the company pays a quarterly dividend that has been made every period since their founding in 1969. At current pricing, this payout yields over 5%. Investors are also likely to experience a boost in the payout in subsequent periods.
While much has been positive thus far, recent results don’t particularly standout. Occupancy levels remained flat from the prior quarter, quarterly same-store net operating income (“NOI”) was down from the prior year, and new leasing spreads were negatively impacted by two notable markdowns. Still, shares are up about 14% since their earnings release. Though shares may continue to track higher, the upside is limited.
Recent Performance
At July 31, 2022, which represents the company’s third fiscal quarter based on an October 31 year end, total consolidated leased occupancy stood at 92.1%. This is up 20 basis points (“bps”) from the end of the 2021 fiscal year (“FY”) and in-line with the prior quarter.
Though current occupancy levels are about 200bps shy of their long-term historical average, they are not far off FY19 levels, which were around 93%.
June 2022 Investor Presentation – Historical Occupancy Levels From 2003 To 2021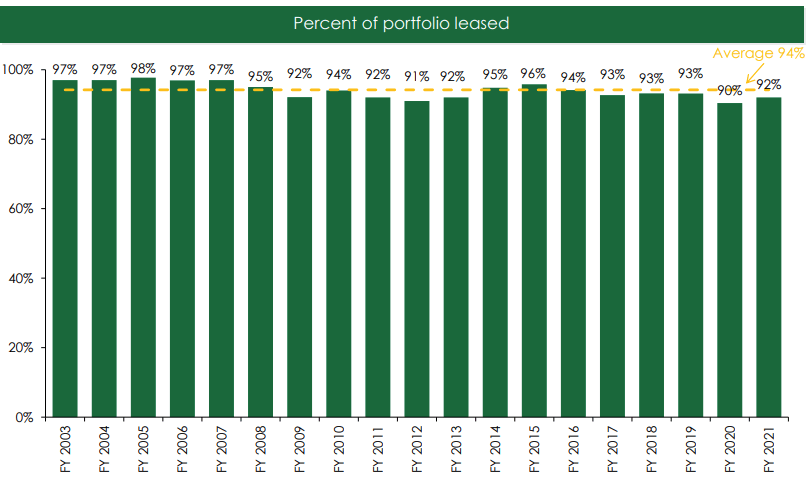
Continued demand for their properties should further improve occupancy levels in the periods ahead. During the current quarter, UBA renewed 209K square feet (“SF”) of space with existing tenants and signed 45K SF of new leases. In addition, they have a pipeline of 127K SF in negotiation and another 109K SF subject to letters of intent.
Altogether, the total activity during the quarter represented just over 9% of their total gross leasable area (“GLA”).
The strong activity was paired with healthy renewal rates of 7.1%, which is their fifth consecutive quarterly increase. Average rates did, however, decrease 17.3% on new signings, due in significant part to two specific signings.
The first was the signing of 20K SF of space to Ashley Furniture in space that had been previously occupied by Modell’s Sporting Goods, which vacated the property in 2020 following their bankruptcy proceedings. The new rent on the space to Ashley was 27% below Modell’s prior rent.
In addition, the company also signed 3K SF of restaurant space where the prior long-term tenant had been paying an above-market rate. Accordingly, the rent needed to be adjusted down to market to close the deal.
Despite the decline on new rents, overall base rents still increased 4.3% during the quarter and are up 3% on a YTD basis. Funds from operations (“FFO”) were also up 4.6% on a quarterly basis and are up 9.7% YTD.
Same-store NOI, however, decreased 2.2% during the quarter due primarily to higher net other operating expenses. But in a positive note, expenses, overall, in the same-store portfolio remain well-controlled. YTD, the operating expense ratio is down 470bps, with a 110bps contribution during the current quarter.
And in a sign of confidence in the stock, the company repurchased 310K shares of their Class A common shares during the quarter at an average price of $17.43/share, citing market dislocation. And in October, the company announced the authorization to repurchase another 2M shares.
Liquidity And Debt Profile
At the end of Q3, UBA had total cash on hand of +$12.2M, in addition to +$114M of availability on their revolving credit facility.
The company is also on pace to generate over +$75M in operating cash flows this year. Combined with their current liquidity position, UBA appears to be well capitalized to satisfy their reoccurring obligations.
With no material debt maturities until 2024, UBA faces limited near-term repayment risks. In addition, the company’s total debt load represents a lower percentage of their total capitalization than their peers, at just 25%.
June 2022 Investor Presentation – Comparison Of UBA’s Market Structure With Peer Set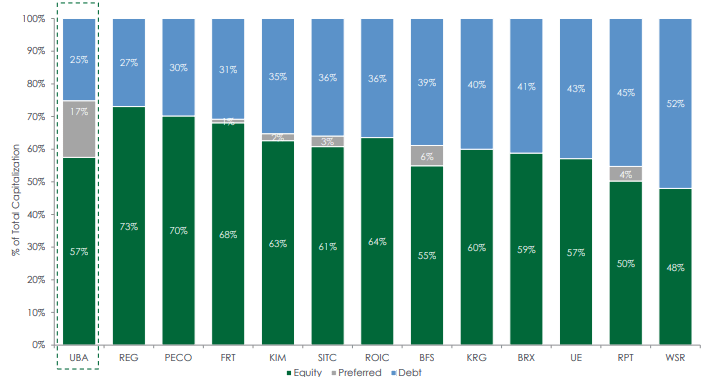
And at 3.6x of EBITDA, net debt levels are manageable and unlikely to create a strain on financial resources at any time for the foreseeable future.
Dividend Safety
UBA has provided an uninterrupted dividend since their founding in 1969. As of their most recent earnings release, that represents 210 consecutive quarters of payments.
Presently, the quarterly payout is $0.25/share, after having just been increased by about 5%. This translates to an annualized yield of about 5.4% at current pricing. This compares favorably to several of their retail peers. And following their just announced increase, the yield is now comparable with that of Saul Centers (BFS), which currently yields 5.48%.
Seeking Alpha – UBA’s Current Dividend Yield Compared To Competitors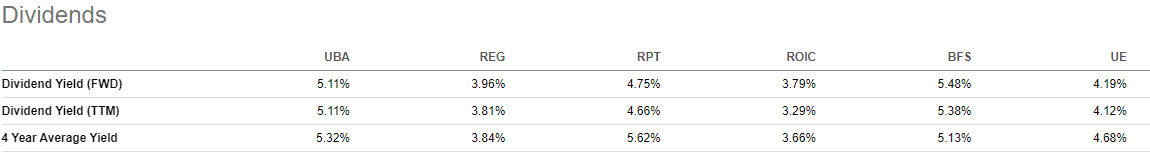
Though the company has a superior track record of providing continuous payouts, it’s worth noting that the quarterly payment was slashed in early 2020 due to the economic uncertainties of the COVID-19 pandemic.
While it has been steadily increased since then, the current payout is still 12% less than pre-pandemic levels. If the payout were to recapture those former levels, investors would receive a yield of about 6.0%.
At just 66% of Q3FY22 FFO, UBA does have the capacity for further increases. And at a quarterly rate of $0.28, which is what the company paid in Q2 of 2020, the payout ratio would equate to 73.7%. While that is higher than the sector average of 65%, it would still be adequately covered.
Further support of dividend safety is evidenced within their cash flow statement, which, YTD, reports +$57.3M in operating cash flows. This is about 1.5x their total common and preferred dividends paid out over the same period.
Takeaway
UBA has a strong operating presence in quality suburban markets outside of New York City. These markets are characterized by households with median incomes well above the national average. For UBA’s tenant base, this translates to durable consumer demand across business cycles.
UBA’s tenants are also primarily weighted to those with essential or needs-based business models. This provides an additional level of stability to the portfolio.
Though occupancy levels lag historical averages, at a current leased rate of about 92%, they are within reach. Earnings and FFO, on the other hand, have already returned to pre-pandemic levels and are likely to grow with further occupancy gains.
At 12.7x, shares aren’t overpriced. And the company has previously provided a nod of confidence in their shares through past repurchases and their recent reauthorization to purchase up to 2M more shares. A superior dividend streak paired with the likelihood of additional increases in the periods ahead also provides additional enticement.
Yet, their recent results did little to impress. Markups on renewals increased for the fifth consecutive quarter, but this was offset by a large markdown on new signings. In addition, same-store NOI came in at a YOY decline in the current period. After already gaining about 14% since their earnings release, could it rise further? Perhaps. But the catalysts appear limited, especially in the current market environment. While investors may miss out on some upside by remaining on the sidelines, one could do better elsewhere.
Be the first to comment