

Torsten Asmus/iStock via Getty Images
Dear Fellow Investor,
Upslope’s objective is to deliver attractive, equity-like returns with significantly reduced market risk and low correlation versus traditional equity strategies. Q3 was challenging. Investors faced a violent bear market rally (S&P 500 +14% from Q2-end to August 16 peak) that was entirely given back (and more) in the end (-17% from peak to Q3-end). Despite a lackluster quarter for Upslope, the environment remains favorable as macro volatility and risk continue to be elevated. Q4 has started on a positive note.
|
Upslope Exposure & Returns[1] |
Benchmark Returns |
|||
|
Average Net Long |
Net Return |
S&P Midcap 400 ETF (MDY) |
HFRX Equity Hedge Index |
|
|
Q3 2022 |
72% |
-4.7% |
-2.5% |
-0.1% |
|
YTD 2022 |
69% |
-4.2% |
-21.6% |
-4.8% |
|
Last 12 Months |
66% |
-0.9% |
-15.4% |
-2.3% |
|
Since Inception* |
49% |
+8.4% |
+7.2% |
+3.8% |
| Note: clients should always check individual statements for returns, which may vary due to timing and other factors. *Since Inception returns are annualized. |
Market Conditions – “It’s a Bear Market, You Know”[2]
Most fund managers will discuss their views on the macro environment this quarter. Most (including yours truly) have not been able to predict what’s ahead or how it impacts markets. So, I am going to cut this section short and spare your energy for a lengthier discussion on individual stocks later in the letter.
Upslope’s largest longs remain defensive, but the rest of the book has more zip (beta) than usual. I sheepishly exited Ball (BALL, beverage can company), replaced BWX Technologies (BWXT, nuclear subs) in our defense basket, and added several “starter” longs (smaller positions established earlier in the research process). The use of starter longs is a bit of a change; but, I think the current environment is an ideal one for testing. Details on all of these are provided later.
On the short side, aggregate exposure hasn’t changed much. However, shorts now skew much more towards regular way cyclicals (and housing-related) than SPACs. At quarter-end, we had the lightest exposure to “SPAC+” shorts since 2020 (< 5% of the portfolio). Index hedges have also played a bigger role than in the past, owing to bear market conditions (more on hedges later).
Portfolio Positioning
At quarter-end, gross and beta-adjusted net exposures were 136% and 0%, respectively. Excluding hedges, net was within Upslope’s typical +25-75% range. Gross remains elevated mostly due to a large position in a pre-transaction SPAC (TCVA). Positioning also reflects a heightened number of perceived opportunities on both sides of the portfolio (long and short).
Exhibit 2: Upslope Portfolio Snapshot
Upslope Portfolio Snapshot (Source: Upslope.)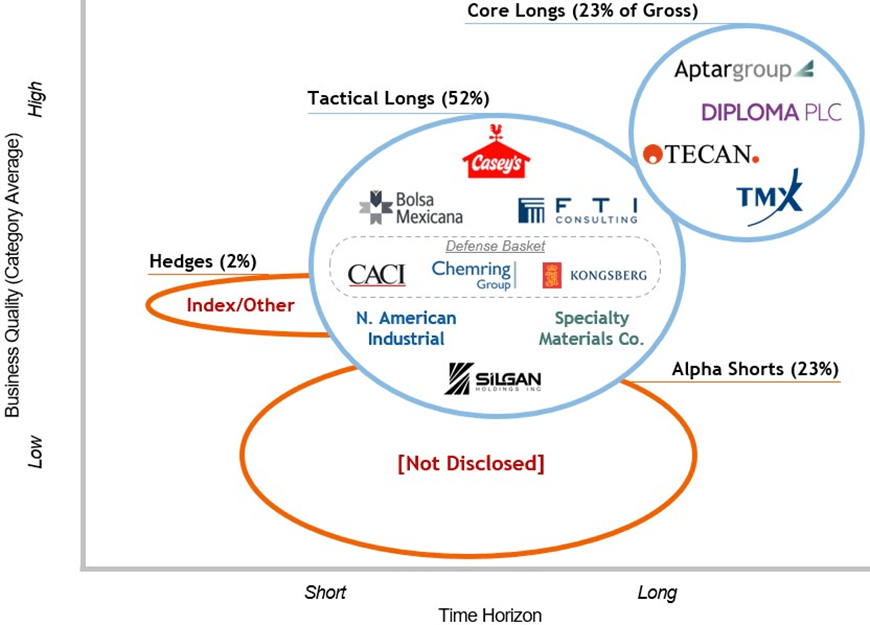
| Note: as of 9/30/22 and may change without notice. Logo positioning within categories not reflective of relative time horizon/business quality. TCVA (pre-deal SPAC) not shown above, given cash-like nature. |
Exhibit 3: Gross Exposure by Market Cap & Geography
Gross Exposure by Market Cap & Geography (Source: Upslope, Interactive Brokers, Sentieo.)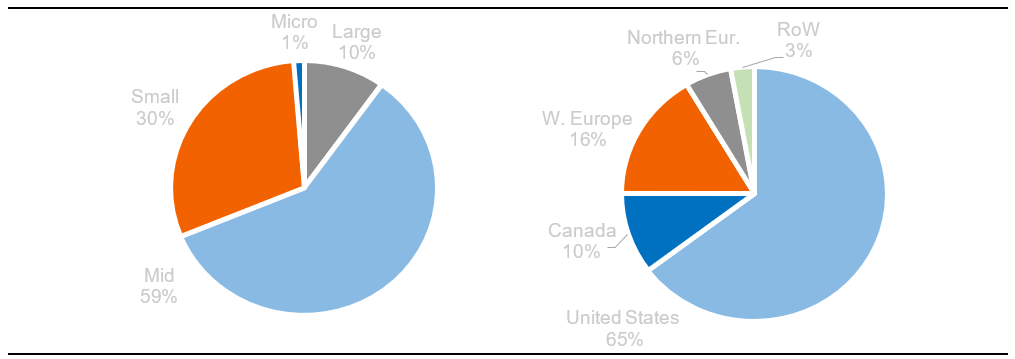
| Note: as of 9/30/22. Market cap ranges: Micro (<$400mm), Small ($400mm – $3bn), Mid ($3bn – $13.5bn), Large (>$13.5bn). |
Portfolio Updates
The largest contributors to and detractors from quarterly performance are noted below. Gross contribution to overall portfolio return is noted in parentheses.
Exhibit 4: Top Contributors to Quarterly Performance (Gross)
|
Top Contributors |
Top Detractors |
|
Long/Short: Hedges, net (+370 bps) |
Long: Ball (-145 bps) |
|
Long: Tecan (OTCPK:TCHBF, +95 bps) |
Long: Kongsberg (OTCPK:KGAUF, -110 bps) |
|
Long: Casey’s (CASY, +35 bps) |
Long: Undisclosed (-95 bps) |
|
Longs – Total Contribution -655 bps |
Shorts – Total Contribution +200 bps |
|
Source: Upslope, LICCAR, Interactive Brokers Note: Amounts may not tie with aggregate performance figures due to rounding |
Hedges – Comment
Year-to-date, I have used outright hedges (e.g. index puts andcalls) more materially than in the past. The main purpose is to adjust Upslope’s effective net exposure up or down depending on:
- underlying fundamental portfolio exposures, and,
- point-in-time market conditions.
I do not anticipate this will be a permanent feature of Upslope’s portfolio/strategy. However, I believe they can be useful when deployed in a thoughtful and level-headed manner under the textbook bear market conditions of today.
Ball Corp. (BALL) – Exited Long
Ball is the largest global producer of beverage cans. I promptly exited our position following disappointing Q2 earnings. Upon entering the position, I noted the risk that the bev-can market had potentially overexpanded in recent years. I believed the risk was manageable and unlikely to play out. Unfortunately, I was wrong: either the industry has indeed overextended itself or Ball is uniquely facing challenges. Neither is good for Ball shareholders. I would not normally let “one bad quarter” scare me out of a position. However, the messaging from Ball – CEO seemingly choking up while announcing results and layoffs, combined with a sharp cutback in capital returns (something BALL shareholders had long been accustomed to) – was crystal clear: this is not likely just a one or two quarter problem.
BWX Technologies (BWXT) – Exited Long
BWX is a leading producer of nuclear reactors, components, and fuel, primarily for the power and propulsion of U.S. Navy subs and carriers. I sold our position and replaced it with CACI (detailed below). While I remain intrigued by the BWX story – unique product set, optionality outside of defense, and prospect of accelerating free cash flows – I became concerned with elevated management turnover (Chairman, CFO, CAO, and two division heads in the last year). Given the above-normal trust required in management for the thesis (believing capex will normalize and boost free cash flow soon and murky, long-tailed investments outside of defense), I decided to move on.
CACI International (CACI) – New Long
CACI provides specialized technology and consulting services, primarily to U.S. defense and intelligence agencies. The U.S. Army is CACI’s single largest customer. This position replaces BWXT in Upslope’s “defense basket”. CACI’s business is mostly split across Expertise (providing talent to government agencies – e.g. software engineers) and Technology (design and delivery of specific technology-oriented services and products, including for example, battlefield hardware). The company offers its services and products in support of both day-to-day agency operations and specific missions.
At a high-level, CACI reminds me of another Upslope long in an unrelated sector: Silgan Holdings (packaging/dispensing and food can business). Both are truly sleepy value stocks that trade for low double-digit earnings multiples, but have a strong history of steady value creation and free cash flow per share growth. Both the stocks and underlying businesses appear very well-positioned for the uncertain macro (or geopolitical, in CACI’s case) environment we’re likely to face in the years ahead. Other notable thesis points for CACI specifically:
- Long-term Geopolitical & Other Tailwinds –like other components of Upslope’s defense basket, CACI should benefit from an attractive defense spending environment for years to come. CACI should also benefit from IT modernization efforts in U.S. government agencies, as well as its strength in cyber/electronic warfare offerings.
- Strong Management – CACI’sCEO has been in-role since 2019 and previously served in various COO capacities for the company since 2012. His communication is unusually straightforward and clear, and his focus on “free cash flow per share” (despite underwhelming comp incentives) is notable. He is also a significant shareholder, owning $20mm+ of stock (and only one modest sale – in 2020 – during his history at the company).
- Attractive Financial Profile – CACI has a track record of solid organic growth (typically around mid-single-digit %) with limited cyclicality, supplemented with tuck-in acquisitions (for which there continues to be a long runway). ROIC is modest (HSD%) but stable. The balance sheet is nearly under-levered at ~2.5x net – providing flexibility for additional acquisitions or share buybacks.
- Healthy Earnings Backdrop – given strong geopolitical tailwinds, bipartisan support for defense, and a sizable gap between rising defense budgets and recent outlays (which typically come through on a lag and correlate with revenues for CACI/peers), the earnings outlook for CACI should be solid in the periods ahead. Such a healthy outlook is unusual in the current market/economy.
- Attractive Valuation – even if estimates do not come up, valuation on consensus figures today is modest, suggesting limited downside: 7%+ FCF yield, 11x EBITDA, 14x EPS. Notably, CACI peer ManTech was recently taken private by Carlyle Group (CG) at a premium valuation (5% FCF yield, 16x EBITDA, 26x EPS). The deal was announced in May 2022 and closed in September.
Key risks for CACI shareholders include: high portion (~30%) of fixed price contracts (mitigant: solid track record of managing costs and, more importantly, significant diversification by project), lumpy organic growth, labor availability/challenges, M&A execution risk (very acquisitive and larger deals could present heightened risk), and potential government budget headwinds (depending on November elections and potentially driven by elevated inflation/rates longer-term).
Starter Positions – New Longs
As noted, I have begun to more actively test the concept of “starter” positions and am highlighting some of these below. Should any graduate to full-sized positions, I plan to provide additional details.
Bolsa Mexicana de Valores (OTCPK:BOMXF)
Bolsa Mexicana de Valores (“BMV”) is a leading financial exchange (equity, fixed income, and derivatives) operator, primarily in Mexico. This position has been fully established, but is likely to remain modest, given higher investment risks and diligence limitations.
Overall, there is a lot to like about BMV. While the company’s equity business is clearly challenged at the moment due to a dearth of new listings and a spike in de-listings, equities represent only ~25% of the overall business. Outside of equities, growth continues to be solid, with double-digit gains in most segments. The company is extremely profitable (60%+ EBITDA margins), has an overly conservative balance sheet (1x net cash), strong cash flows supporting a large dividend (6% yield), and is very cheap (12x earnings vs. most developed market peers trading closer to 20x – and virtually all these peers carry 1-3x of net debt). While I do not see any specific near-term catalysts, I view BMV as a cheap call option on either a broader Mexico resurgence (logical “reshoring” beneficiary – more on this below) or a one-sided bet on a broad (global) market rebound. Either outcome should bolster BMV’s recently tepid growth. Major risks for investors include FX, political/regulatory uncertainty, and a newer competitor in equities (BIVA).
North American Industrial (Undisclosed)
This is the largest position among “starters,” but I may continue to add more. The company has direct exposure to supply chain design and equipment – and thus potential “reshoring” – with a primary focus on defensive sectors/end markets, primarily in North America and Europe.
Some comments on “reshoring” – the theory that global supply chains will continue their fits of unreliability and that we’ll see a bulking up of supply chains closer to home. I believe this theory (which is mostly all it is so far) has merit, and that lasting scars from the global pandemic and Ukraine will ultimately push it forward. What I like about the idea from an investment perspective is that reshoring-related stocks seemingly have a few ways to win. Most are higher beta and/or cyclicals that have performed at least as poorly as the broader market year-to-date. So, they can win with a broader macro/market snapback. On a relative basis, they can also win with a continued worsening in geopolitical and supply chain issues – even if that occurs during a recession. Investors need to be selective. Plenty of so-called reshoring stocks look to me like generic cyclical macro bets. Others, to my surprise, have very material exposure to sales in China, which in my view is inconsistent with a bullish reshoring thesis. Needless to say, I think there should be opportunities for selective investors in the years ahead. For some thought-provoking related reading on the topic, I highly recommend this interviewwith Russell Napier.
Specialty Materials Co. (Undisclosed)
Small-cap specialty materials company that is commodity-oriented and was “blown up” (read: lots of debt) by a series of unfortunate events tied to Europe/Ukraine. It looks like a depressed cyclical at first blush, but the profile has changed. My thesis is the company should benefit from a recession due to input cost relief and mostly stable end market demand.
Global Asset Manager (Undisclosed)
Added post-quarter end, this alternative asset manager has had strong flows and solid performance in recent years. Shares appear quite cheap (comparable to traditional mutual fund managers, despite far healthier fundamentals and outlook), provide some (much-needed for Upslope) market beta, and have outsized exposure to beaten-down European markets and investors.
Fine-Tuning the Strategy
When I began managing Upslope’s strategy, I started with extremely conservative gross exposure[3] – running around 100% and self-imposing a 125% limit. Over the last four years, however, I have consistently run the strategy right at the 125% limit.[4] Given (A) my experience and comfort at 125%, and (B) Upslope’s historic downside volatility of just ~1/3 that of long-only indexes, I believe a modest increase in the gross limit to 150% is reasonable. While this could slightly increase downside volatility, it should also, in my view, improve overall returns – a seemingly reasonable tradeoff given the track record. Another benefit is that it will provide me with more flexibility to avoid being forced to tinker with positions, even when we’re at a reasonable exposure level (e.g. right at 125%).
This change does not mean I expect to run at 150% all or most of the time. My philosophy is that maximum gross should be reserved for select times when there are unusually actionable opportunities on both sides of the portfolio. Alternatively, during material drawdowns (absolute and/or relative), lower gross exposure is prudent. Overall, this is not a topic I take lightly. I’ve been pondering a change for years and my own money is invested alongside yours. If you have any concerns or questions at all, please contact me.
Closing Thoughts
These are not easy times for investors, but I am as excited as ever about the path ahead for Upslope and its differentiated portfolio. Valuation discipline, pragmatic risk management, and an ability to be nimble continue to be the key success factors in 2022 and for the foreseeable future.
Thank you, as always, for the trust you’ve placed in me to manage a portion of your hard-earned money. If you have any questions at all, would like to add to your account, or know someone who may be a good fit for Upslope’s atypical approach, please call or email anytime.
Sincerely,
George K. Livadas
|
Jan |
Feb |
Mar |
Apr |
May |
Jun |
Jul |
Aug |
Sep |
Oct |
Nov |
Dec |
YTD |
||
|
2022 |
Upslope |
(2.3%) |
0.8% |
1.3% |
3.1% |
(1.5%) |
(0.8%) |
1.5% |
(4.0%) |
(2.3%) |
(4.2%) |
|||
|
S&P Midcap 400 |
(7.3%) |
1.1% |
1.3% |
(7.1%) |
0.8% |
(9.6%) |
10.9% |
(3.2%) |
(9.2%) |
(21.6%) |
||||
|
2021 |
Upslope |
(5.1%) |
0.3% |
3.2% |
2.4% |
0.4% |
(0.0%) |
2.4% |
1.6% |
(4.0%) |
3.9% |
(3.2%) |
2.9% |
4.2% |
|
S&P Midcap 400 |
1.4% |
6.8% |
4.9% |
4.3% |
0.2% |
(1.1%) |
0.3% |
2.0% |
(4.0%) |
5.9% |
(3.0%) |
5.2% |
24.6% |
|
|
2020 |
Upslope |
0.0% |
(2.3%) |
0.4% |
4.9% |
(0.7%) |
(2.9%) |
1.9% |
4.6% |
0.8% |
3.2% |
3.6% |
0.9% |
15.1% |
|
S&P Midcap 400 |
(2.6%) |
(9.4%) |
(20.2%) |
14.1% |
7.2% |
1.3% |
4.7% |
3.5% |
(3.3%) |
2.2% |
14.3% |
6.5% |
13.5% |
|
|
2019 |
Upslope |
3.8% |
1.0% |
2.4% |
2.6% |
3.0% |
2.1% |
0.7% |
7.2% |
(2.1%) |
0.7% |
(0.2%) |
(3.4%) |
18.9% |
|
S&P Midcap 400 |
10.3% |
4.3% |
(0.6%) |
4.0% |
(8.1%) |
7.8% |
0.9% |
(4.1%) |
3.1% |
1.1% |
2.9% |
2.8% |
25.8% |
|
|
2018 |
Upslope |
(1.3%) |
1.6% |
5.5% |
0.4% |
2.0% |
(1.1%) |
(0.0%) |
1.2% |
(0.4%) |
1.0% |
(1.1%) |
(2.9%) |
4.6% |
|
S&P Midcap 400 |
2.8% |
(4.4%) |
1.0% |
(0.4%) |
4.1% |
0.4% |
1.7% |
3.2% |
(1.1%) |
(9.6%) |
3.2% |
(11.3%) |
(11.3%) |
|
|
2017 |
Upslope |
7.5% |
(1.9%) |
0.7% |
4.0% |
2.6% |
(0.4%) |
2.3% |
0.1% |
1.7% |
(0.8%) |
(0.7%) |
0.5% |
16.2% |
|
S&P Midcap 400 |
1.6% |
2.6% |
(0.5%) |
0.8% |
(0.5%) |
1.5% |
0.9% |
(1.5%) |
3.9% |
2.2% |
3.7% |
0.2% |
15.9% |
|
|
2016 |
Upslope |
— |
— |
— |
— |
— |
— |
— |
0.0% |
(0.8%) |
(1.6%) |
2.7% |
(1.8%) |
(1.6%) |
|
S&P Midcap 400 |
— |
— |
— |
— |
— |
— |
— |
(0.4%) |
(0.6%) |
(2.7%) |
7.9% |
2.2% |
6.2% |
|
Annualized Return |
Total Return |
Downside Dev. |
Sortino Ratio |
Corr. vs Upslope |
||
|
Since Inception |
Upslope |
8.4% |
63.3% |
5.0% |
1.3 |
— |
|
S&P Midcap 400 |
7.2% |
52.3% |
14.0% |
0.4 |
0.31 |
|
|
HFRX Equity Hedge Index |
3.8% |
25.7% |
5.5% |
0.3 |
0.27 |
|
Source: Upslope, Interactive Brokers, LICCAR, Sentieo, Morningstar Note: Returns shown for composite of all accounts invested according to Upslope’s core long/short strategy (the vast majority of AUM). Performance for S&P Midcap 400 represented by total return for related exchange-traded fund (ticker: MDY). Individual account performance may vary (minimum returns, net of fees, for an account invested since inception and YTD 2022 were +57.6% and -5.5%, respectively). Clients should always review statements for actual results. 10% of composite assets were non-fee paying at period-end. Data from inception (August 29, 2016) to June 24, 2017 based on portfolio manager’s (“PM”) performance managing the strategy under a prior firm (as sole PM). Thereafter, PM managed the strategy/accounts on a no-fee basis through August 11, 2017, after which Upslope became operational. PAST PERFORMANCE IS NO GUARANTEE OF FUTURE RESULTS. |
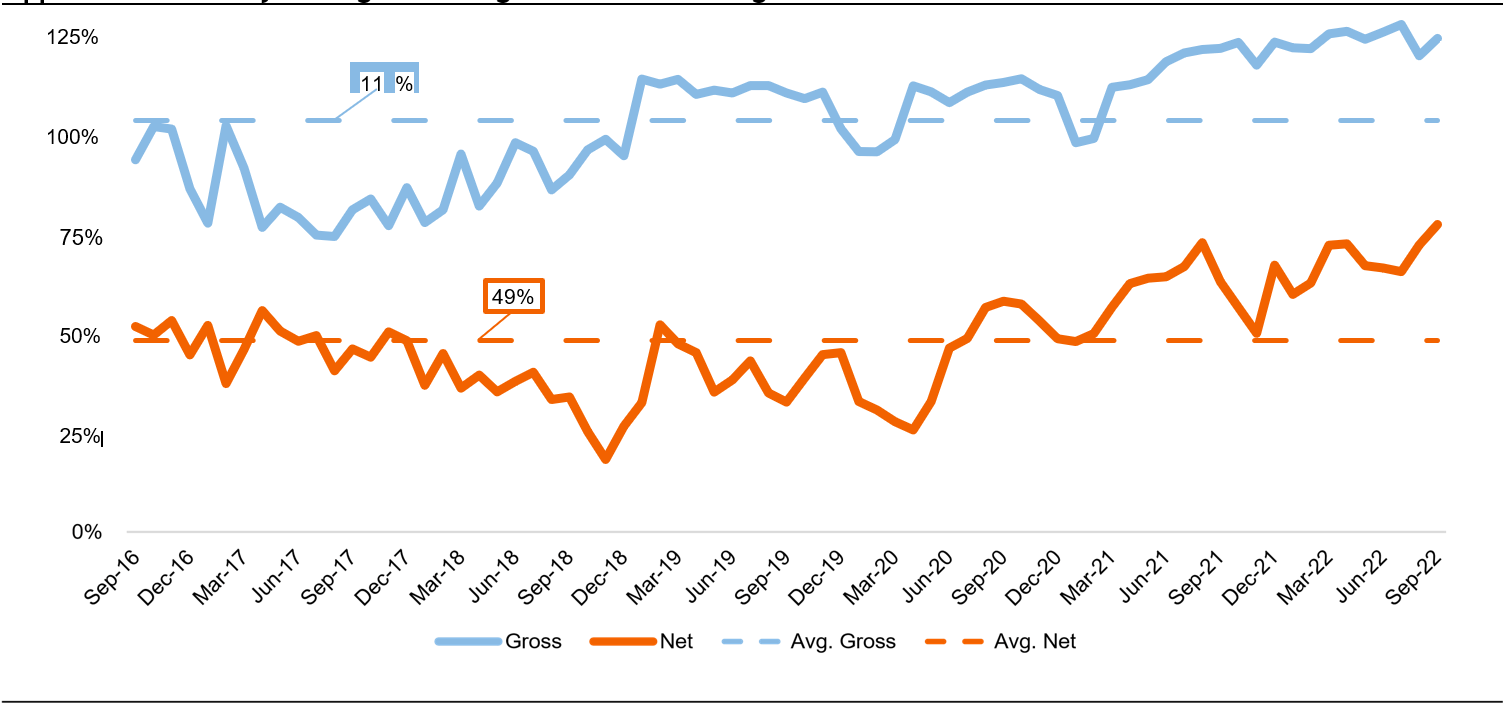
Appendix B: Monthly Average Net Long & Gross Positioning
|
Source: Upslope, Interactive Brokers Note: Based on composite of all accounts invested according to Upslope’s core long/short strategy. |
Appendix C: Portfolio Company ((Long)) Descriptions
AptarGroup (ATR): Specialty packaging business focused on pumps and sprayers, with a highly profitable, defensive, and growing Pharma unit. Misclassified and undervalued due to legacy/traditional packaging businesses (Food + Beverage, Beauty + Home), which contribute 60% of sales but just 15% of EBIT.
Bolsa Mexicana de Valores (OTCPK:BOMXF): Dominant financial exchange operator in Mexico. Despite known headwinds in its equities business, the company is diversified, highly cash generative, conservatively managed, and shares appear a cheap call option on global macro reacceleration and/or Mexico resurgence.
CACI International (CACI): Specialized technology and consulting services provider, primarily to U.S. defense and intelligence agencies. Anticipate company will benefit from geopolitical tailwinds, strong position in cyber defense, and continued consolidation opportunities.
Casey’s General Stores (CASY): 3rd largest independent convenience store operator in the U.S. and 5th largest pizza chain; unique footprint exclusively focused on the Midwest/South. Growing business with highly defensible model offers good value and significant optionality from organic initiatives and M&A.
Chemring (OTCPK:CMGMF): Niche defense contractor focused on Countermeasures & Energetics (defensive flares, specialty explosives) and Sensors & Info (cyber warfare, explosive/chem/bio detection). End markets should outgrow defense market for years; also has elevated “conflict-driven” demand exposure.
Diploma (OTCPK:DPMAY): U.K.-based specialty distributor focused on essential consumable products across life sciences, seals (machinery), and controls (aerospace wiring/harnesses). Unique model and conservative M&A strategy have historically enabled attractive free cash flow growth through the cycle.
FTI Consulting (FCN): Boutique consulting and advisory firm, with leading expertise in restructuring, dispute advisory, and other practices. Should ultimately benefit from elevated deal flow in wake of longerterm pandemic effects (e.g. rising rates and SPAC boom/bust) and restructuring cycle.
Kongsberg Gruppen (OTCPK:NSKFF): 200+ year old defense (missile/defense, remote weapons systems) and maritime (offshore, commercial) business, majority owned by Norwegian government. Dominant positions in niche products with cyclically attractive end markets, strong management team and solid balance sheet.
N. American Industrial (Undisclosed): “Starter” position with direct exposure to supply chain equipment and design, primarily for defensive sectors and end markets in North America and Europe. Potential reshoring beneficiary.
Silgan (SLGN): Food can, dispensing system, and plastic packaging producer managed with a private equity mindset. Defensive end markets, attractive valuation and disciplined model make for attractive baseline investment with balance sheet optionality (M&A or capital return).
Spec. Materials Co (Undisclosed): “Starter” position with a commodity-oriented business severely harmed by events in Europe/Ukraine. With a different profile vs. its own history, anticipate company may benefit from a recession due to input cost relief and mostly stable end market demand.
Tecan Group (OTCPK:TCHBF): Switzerland-based lab automation and consumables business, with leading market position in automated liquid handling. Attractive and defensible base business greatly enhanced by exceptional execution throughout the pandemic.
TMX Group (OTCPK:TMXXF): Largest exchange operator in Canada with exposure to equities, fixed income, and derivatives, as well as European power/energy trading/data. Anticipate steady, defensive growth with potential outperformance in the event of rising inflation and/or elevated volatility.
Important DisclosuresUpslope Capital Management, LLC (“Upslope”) is a Colorado registered investment adviser. Information presented is for discussion and educational purposes only and does not intend to make an offer or solicitation for the sale or purchase of any specific securities, investments, or investment strategies. Investments involve risk and, unless otherwise stated, are not guaranteed. Be sure to first consult with a qualified financial adviser and/or tax professional before implementing any strategy discussed herein. While Upslope believes all information herein is from reliable sources, no representation or warranty can be made with respect to its completeness. Any projections, market outlooks, or estimates in these materials are forward-looking statements and are based upon internal analysis and certain assumptions, which reflect the views of Upslope and should not be construed to be indicative of actual events that will occur. As such, the information may change in the future should any of the economic or market conditions Upslope used to base its assumptions change. The description of investment strategies in these materials is intended to be a summary and should not be considered an exhaustive and complete description of the potential investment strategies used by Upslope discussed herein. Varied investment strategies may be added or subtracted from Upslope in accordance with related Investment Advisory Contracts by Upslope in its sole and absolute discretion. Any specific security or investment examples in these materials are meant to serve as examples of Upslope’s investment process only. There is no assurance that Upslope Capital will make any investments with the same or similar characteristics as any investments presented. The investments are presented for discussion purposes only and are not a reliable indicator of the performance or investment profile of any composite or client account. The reader should not assume that any investments identified were or will be profitable or that any investment recommendations or investment decisions we make in the future will be profitable. Any index or benchmark comparisons herein are provided for informational purposes only and should not be used as the basis for making an investment decision. There are significant differences between Upslope’s strategy and the benchmarks referenced, including, but not limited to, risk profile, liquidity, volatility, and asset composition. You should not rely on these materials as the basis upon which to make an investment decision. There can be no assurance that investment objectives will be achieved. Clients must be prepared to bear the risk of a loss of their investment. Any performance shown for relevant time periods is based upon a composite of actual trading in accounts managed by Upslope under a similar strategy. Except where otherwise noted, performance is shown net of management and incentive fees (where applicable), and all trading costs charged by the custodian. Composite performance calculations have been independently verified by LICCAR, LLC. Performance of client portfolios may differ materially due to differences in fee structures, the timing related to additional client deposits or withdrawals and the actual deployment and investment of a client portfolio, the length of time various positions are held, the client’s objectives and restrictions, and fees and expenses incurred by any specific individual portfolio. Benchmarks: Upslope’s performance results shown are compared to the performance of the HFRX Equity Hedge Index, as well as the exchange-traded fund that tracks the S&P Midcap 400 (ticker: MDY). The HFRX Equity Hedge Index is typically not available for direct investment. Benchmark results do not reflect trading fees and expenses. The HFRX Equity Hedge Index (source: Hedge Fund Research, Inc. www.hedgefundresearch.com, © 2022 Hedge Fund Research, Inc. All rights reserved) was chosen for comparison as it is generally well recognized as an indicator or representation of the performance of equity-focused hedge fund products. Any other benchmarks noted and used by Upslope have not been selected to represent an appropriate benchmark to compare an investor’s performance, but rather are disclosed to allow for comparison of the investor’s performance to that of certain well-known and widely recognized, investable indexes. PAST PERFORMANCE IS NO GUARANTEE OF FUTURE RESULTS These materials may not be disseminated without the prior written consent of Upslope Capital Management, LLC. |
Footnotes[1] Unless otherwise noted, returns shown for a composite of all accounts invested according to Upslope’s core long/short strategy. Please see important performance-related details and disclosures in Appendix A. [2] My own twist on and a nod to Old Turkey in Reminiscences of a Stock Operator; quick background here. [3] Effectively defined as total dollars at risk per dollar invested with Upslope. For example, an account worth $100 that has $75 of longs and $50 of shorts has 125% gross exposure. [4] Astute observers may have noticed that historical gross exposure (Appendix B) has already risen above the historical 125% “max.” The excess above 125% has been entirely due to holding TCVA, which is a pre-deal SPAC that I view as cash-like and therefore exclude for gross (and net) exposure calculation purposes. |
Editor’s Note: The summary bullets for this article were chosen by Seeking Alpha editors.
Be the first to comment