

jetcityimage
This article was co-produced with James Marino Sr. of Portfolio Insight.
Created by the author
This article series compiles a list of upcoming ex-dividend dates of stocks in Dividend Radar, a spreadsheet containing stocks with dividend increase streaks of 5 or more years.
To earn the next dividend, be sure to buy the stock before its ex-dividend date, which usually is one business day before the record date. Unfortunately, if you wait until the ex-dividend date or thereafter, you won’t receive the next dividend payment! Instead, the seller will receive the next dividend.
Upcoming Ex-Dividend Dates
The following table summarizes the ex-dividend dates for the next two weeks. The table is divided into sections by Ex-Div Date and sorted by Ticker for each date. Yrs are years of consecutive dividend increases, Yield is the new dividend yield for the market close Price on the date listed, and 5-yr DGR is the compound annual growth rate of the dividend over a 5-year period (on a trailing 12-month basis). Note that Payout is the dollar amount payable per share or unit on the Pay Date.
| Company (Ticker) | Yrs | Price | Fwd | 5-Yr | Next | Pay |
| (08/11) | Yield | DGR | Payout | Date | ||
| Ex-Div Date: 08/12 (Last Day to Buy: Thursday, 08/11) | ||||||
| AmerisourceBergen (ABC) | 18 | $145.58 | 1.26% | 4.9% | 0.46 | 08/29 |
| Arbor Realty (ABR) | 10 | $16.04 | 9.73% | 16.9% | 0.39 | 08/31 |
| AGCO (AGCO) | 10 | $110.30 | 0.87% | 9.2% | 0.24 | 09/15 |
| Applied Industrial Technologies (AIT) | 13 | $106.04 | 1.28% | 3.3% | 0.34 | 08/31 |
| Allete (ALE) | 12 | $62.55 | 4.16% | 4.0% | 0.65 | 09/01 |
| American States Water (AWR) | 68 | $88.52 | 1.65% | 9.0% | 0.398 | 09/01 |
| Booz Allen Hamilton (BAH) | 11 | $96.15 | 1.79% | 20.1% | 0.43 | 08/31 |
| Bankwell Financial (BWFG) | 7 | $33.06 | 2.42% | 23.9% | 0.2 | 08/25 |
| Church & Dwight (CHD) | 26 | $88.09 | 1.19% | 7.0% | 0.263 | 09/01 |
| Chemed (CHE) | 14 | $484.62 | 0.30% | 6.7% | 0.38 | 09/02 |
| CNA Financial (CNA) | 6 | $40.70 | 3.93% | 9.3% | 0.4 | 09/01 |
| Cohen & Steers (CNS) | 13 | $77.95 | 2.82% | 13.1% | 0.55 | 08/25 |
| Cintas (CTAS) | 39 | $431.78 | 1.07% | 23.4% | 1.15 | 09/15 |
| Coterra Energy (CTRA) | 6 | $28.33 | 2.12% | 37.2% | 0.15 | 08/25 |
| Enbridge (ENB) | 26 | $43.88 | 6.01% | 9.5% | 0.86 | 09/01 |
| Greene County Bancorp (GCBC) | 9 | $52.40 | 0.99% | 6.5% | 0.14 | 08/31 |
| Global Industrial (GIC) | 6 | $31.97 | 2.25% | 22.2% | 0.18 | 08/22 |
| Gorman-Rupp (GRC) | 16 | $27.80 | 2.45% | 8.1% | 0.17 | 09/09 |
| Jefferies Financial (JEF) | 6 | $34.13 | 3.52% | 34.5% | 0.3 | 08/26 |
| KLA (KLAC) | 13 | $374.51 | 1.12% | 14.4% | 1.3 | 09/01 |
| Kroger (KR) | 16 | $46.79 | 2.22% | 11.9% | 0.26 | 09/01 |
| Eli Lilly (LLY) | 9 | $304.61 | 1.29% | 12.2% | 0.98 | 09/09 |
| ONE Gas (OGS) | 8 | $82.11 | 3.02% | 9.3% | 0.62 | 09/01 |
| Oshkosh (OSK) | 9 | $85.06 | 1.74% | 11.9% | 0.37 | 08/29 |
| Otter Tail (OTTR) | 9 | $79.99 | 2.06% | 4.9% | 0.413 | 09/09 |
| Rockwell Automation (ROK) | 13 | $253.61 | 1.77% | 8.1% | 1.12 | 09/12 |
| Selective Insurance (SIGI) | 9 | $79.10 | 1.42% | 11.6% | 0.28 | 09/01 |
| Southern Missouri Bancorp (SMBC) | 11 | $53.59 | 1.49% | 14.9% | 0.21 | 08/31 |
| Southern (SO) | 21 | $78.29 | 3.47% | 3.3% | 0.68 | 09/06 |
| Southwest Gas (SWX) | 16 | $75.69 | 3.28% | 5.5% | 0.62 | 09/01 |
| Timken (TKR) | 9 | $66.75 | 1.86% | 2.9% | 0.31 | 09/02 |
| United Parcel Service (UPS) | 13 | $202.37 | 3.00% | 9.6% | 1.52 | 09/01 |
| Ex-Div Date: 08/15 (Last Day to Buy: Friday, 08/12) | ||||||
| Bar Harbor Bankshares (BHB) | 19 | $29.49 | 3.53% | 5.7% | 0.26 | 09/16 |
| BOK Financial (BOKF) | 17 | $91.60 | 2.31% | 3.8% | 0.53 | 08/25 |
| Donaldson (DCI) | 36 | $55.82 | 1.65% | 4.9% | 0.23 | 08/31 |
| International Bancshares (IBOC) | 13 | $44.70 | 2.68% | 13.4% | 0.6 | 08/29 |
| MSA Safety (MSA) | 51 | $126.99 | 1.45% | 5.9% | 0.46 | 09/10 |
| Reinsurance of America (RGA) | 13 | $127.70 | 2.29% | 12.2% | 0.8 | 08/30 |
| Re/Max (RMAX) | 6 | $27.24 | 3.38% | 6.9% | 0.23 | 08/30 |
| Ex-Div Date: 08/16 (Last Day to Buy: Monday, 08/15) | ||||||
| Archer-Daniels-Midland (ADM) | 47 | $83.60 | 1.91% | 4.4% | 0.4 | 09/07 |
| Assured Guaranty (AGO) | 11 | $54.25 | 1.84% | 11.5% | 0.25 | 08/31 |
| AudioCodes (AUDC) | 5 | $22.78 | 1.58% | N/A | 0.18 | 08/31 |
| Consolidated Edison (ED) | 48 | $98.99 | 3.19% | 2.9% | 0.79 | 09/15 |
| Equinix (EQIX) | 8 | $709.46 | 1.75% | 9.8% | 3.1 | 09/21 |
| Global Water Resources (GWRS) | 5 | $14.73 | 2.00% | 1.9% | 0.025 | 08/31 |
| Home Bancshares (HOMB) | 12 | $24.36 | 2.71% | 11.1% | 0.165 | 09/07 |
| Lindsay (LNN) | 20 | $164.61 | 0.83% | 2.6% | 0.34 | 08/31 |
| Paccar Inc (PCAR) | 12 | $93.25 | 1.46% | 7.0% | 0.34 | 09/07 |
| PNM Resources (PNM) | 11 | $48.60 | 2.86% | 7.9% | 0.348 | 08/31 |
| Target (TGT) | 55 | $169.67 | 2.55% | 8.5% | 1.08 | 09/10 |
| Vulcan Materials (VMC) | 9 | $174.52 | 0.92% | 11.4% | 0.4 | 09/02 |
| Ex-Div Date: 08/17 (Last Day to Buy: Tuesday, 08/16) | ||||||
| Amgen (AMGN) | 11 | $252.09 | 3.08% | 11.5% | 1.94 | 09/08 |
| Black Hills (BKH) | 52 | $76.86 | 3.10% | 6.3% | 0.595 | 09/01 |
| Cogent Communications (CCOI) | 10 | $58.86 | 5.98% | 15.5% | 0.905 | 08/31 |
| Carlisle (CSL) | 46 | $307.11 | 0.70% | 9.1% | 0.75 | 09/01 |
| Comfort Systems USA (FIX) | 10 | $102.75 | 0.55% | 12.8% | 0.14 | 08/29 |
| First Mid Bancshares (FMBH) | 12 | $37.90 | 2.43% | 12.9% | 0.23 | 09/01 |
| Forward Air (FWRD) | 7 | $107.52 | 0.89% | 9.6% | 0.24 | 09/08 |
| Griffon (GFF) | 11 | $32.98 | 1.09% | 8.8% | 0.09 | 09/15 |
| Louisiana-Pacific (LPX) | 5 | $57.47 | 1.53% | N/A | 0.22 | 09/01 |
| Microsoft (MSFT) | 20 | $289.16 | 0.86% | 9.6% | 0.62 | 09/08 |
| Phillips 66 (PSX) | 10 | $85.63 | 4.53% | 7.5% | 0.97 | 09/01 |
| Southside Bancshares (SBSI) | 28 | $39.98 | 3.40% | 6.1% | 0.34 | 09/01 |
| Thomson Reuters (TRI) | 29 | $115.45 | 1.54% | 4.4% | 0.445 | 09/15 |
| Waste Connections (WCN) | 12 | $140.00 | 0.66% | 14.4% | 0.23 | 09/01 |
| Walker & Dunlop (WD) | 5 | $110.28 | 2.18% | N/A | 0.6 | 09/02 |
| Zions Bancorporation (ZION) | 10 | $56.39 | 2.70% | 36.6% | 0.41 | 08/25 |
| Ex-Div Date: 08/18 (Last Day to Buy: Wednesday, 08/17) | ||||||
| Avista (AVA) | 20 | $43.21 | 4.07% | 4.3% | 0.44 | 09/15 |
| BWX Technologies (BWXT) | 7 | $55.26 | 1.59% | 17.8% | 0.22 | 09/08 |
| Cognex (CGNX) | 7 | $47.93 | 0.54% | 10.5% | 0.065 | 09/02 |
| Cummins (CMI) | 17 | $221.89 | 2.61% | 7.2% | 1.57 | 09/01 |
| Chevron (CVX) | 35 | $155.82 | 3.65% | 5.1% | 1.42 | 09/12 |
| Evergy (EVRG) | 19 | $69.57 | 3.29% | 7.6% | 0.573 | 09/20 |
| Fidelity D & D Bancorp (FDBC) | 8 | $39.14 | 3.37% | 10.0% | 0.33 | 09/09 |
| Healthcare Services (HCSG) | 19 | $14.06 | 6.05% | 2.6% | 0.214 | 09/23 |
| Hershey (HSY) | 13 | $226.46 | 1.83% | 7.8% | 1.036 | 09/15 |
| Hawkins (HWKN) | 18 | $42.65 | 1.31% | 5.2% | 0.14 | 09/02 |
| Microchip Technology (MCHP) | 19 | $70.69 | 1.70% | 6.3% | 0.301 | 09/02 |
| Moody’s (MCO) | 13 | $322.54 | 0.87% | 12.0% | 0.7 | 09/09 |
| Midland States Bancorp (MSBI) | 6 | $27.43 | 4.23% | 8.5% | 0.29 | 08/26 |
| Park National (PRK) | 5 | $133.51 | 3.12% | 2.0% | 1.04 | 09/09 |
| Reliance Steel & Aluminum (RS) | 12 | $193.93 | 1.80% | 12.3% | 0.875 | 09/02 |
| Raytheon Technologies (RTX) | 29 | $93.42 | 2.35% | 4.6% | 0.55 | 09/08 |
| Sherwin-Williams (SHW) | 44 | $243.74 | 0.98% | 15.4% | 0.6 | 09/09 |
| Snap-on (SNA) | 13 | $226.79 | 2.50% | 14.9% | 1.42 | 09/09 |
| TE Connectivity (TEL) | 13 | $134.21 | 1.67% | 6.4% | 0.56 | 09/02 |
| Washington Federal (WAFD) | 12 | $34.89 | 2.75% | 10.1% | 0.24 | 09/02 |
| Walgreens Boots Alliance (WBA) | 47 | $39.90 | 4.79% | 5.0% | 0.48 | 09/09 |
| Ex-Div Date: 08/19 (Last Day to Buy: Thursday, 08/18) | ||||||
| Atmos Energy (ATO) | 38 | $114.47 | 2.38% | 8.5% | 0.68 | 09/06 |
| Haverty Furniture (HVT) | 9 | $29.42 | 3.81% | 16.5% | 0.28 | 09/07 |
| Primerica (PRI) | 12 | $134.30 | 1.64% | 22.5% | 0.55 | 09/14 |
| Ryder System (R) | 18 | $81.79 | 2.84% | 5.7% | 0.62 | 09/16 |
| Switch (SWCH) | 5 | $33.90 | 0.62% | N/A | 0.053 | 09/01 |
| Tractor Supply (TSCO) | 13 | $192.30 | 1.91% | 23.8% | 0.92 | 09/07 |
| Ex-Div Date: 08/22 (Last Day to Buy: Friday, 08/19) | ||||||
| Dolby Laboratories (DLB) | 8 | $79.09 | 1.26% | 12.4% | 0.25 | 08/31 |
| Gladstone Investment (GAIN) | 11 | $15.36 | 5.86% | 3.3% | 0.075 | 08/31 |
| Johnson & Johnson (JNJ) | 60 | $170.67 | 2.65% | 5.9% | 1.13 | 09/06 |
| Gladstone Land (LAND) | 8 | $25.71 | 2.13% | 1.2% | 0.046 | 08/31 |
| Nordson (NDSN) | 59 | $237.87 | 0.86% | 13.6% | 0.65 | 09/06 |
| Prudential Financial (PRU) | 14 | $101.65 | 4.72% | 10.1% | 1.2 | 09/15 |
| Ex-Div Date: 08/23 (Last Day to Buy: Monday, 08/22) | ||||||
| Aflac (AFL) | 40 | $61.71 | 2.59% | 11.4% | 0.4 | 09/01 |
| Brunswick (BC) | 10 | $81.78 | 1.79% | 22.3% | 0.365 | 09/15 |
| Ritchie Bros. Auctioneers (RBA) | 19 | $70.39 | 1.42% | 8.0% | 0.27 | 09/14 |
| Ex-Div Date: 08/24 (Last Day to Buy: Tuesday, 08/23) | ||||||
| Applied Materials (AMAT) | 5 | $105.05 | 0.99% | 19.6% | 0.26 | 09/15 |
| CDW (CDW) | 9 | $176.01 | 1.14% | 26.5% | 0.5 | 09/09 |
| Discover Financial Services (DFS) | 12 | $107.98 | 2.22% | 11.9% | 0.6 | 09/08 |
| Littelfuse (LFUS) | 12 | $251.01 | 0.84% | 9.9% | 0.6 | 09/08 |
| LeMaitre Vascular (LMAT) | 12 | $55.06 | 0.91% | 18.6% | 0.125 | 09/08 |
| Robert Half International (RHI) | 18 | $80.05 | 2.15% | 12.0% | 0.43 | 09/15 |
| Skyworks Solutions (SWKS) | 8 | $111.01 | 2.02% | 14.9% | 0.62 | 09/15 |
| Ex-Div Date: 08/25 (Last Day to Buy: Wednesday, 08/24) | ||||||
| ACCO Brands (ACCO) | 5 | $6.73 | 4.46% | N/A | 0.075 | 09/20 |
| Cabot (CBT) | 11 | $72.50 | 2.04% | 3.8% | 0.37 | 09/09 |
| Evercore (EVR) | 16 | $102.26 | 2.82% | 15.7% | 0.72 | 09/09 |
| Fortune Brands Home & Security (FBHS) | 10 | $67.88 | 1.65% | 9.7% | 0.28 | 09/14 |
| Huntington Ingalls Industries (HII) | 10 | $227.02 | 2.08% | 15.3% | 1.18 | 09/09 |
| National Bank (NBHC) | 7 | $42.21 | 2.18% | 26.3% | 0.23 | 09/15 |
| Nu Skin Enterprises (NUS) | 22 | $45.20 | 3.41% | 1.4% | 0.385 | 09/07 |
| Scotts Miracle-Gro (SMG) | 13 | $80.86 | 3.26% | 5.7% | 0.66 | 09/09 |
| S&P Global (SPGI) | 49 | $393.20 | 0.86% | 15.5% | 0.85 | 09/12 |
| Weyco (WEYS) | 8 | $27.43 | 3.50% | 2.5% | 0.24 | 09/30 |
High-Quality Candidates
We use DVK Quality Snapshots to assess the quality of dividend growth stocks. DVK Quality Snapshots is an elegant and effective system that employs five quality indicators and assigns 0-5 points to each quality indicator for a maximum quality score of 25 points.
To find high-quality candidates from Dividend Radars stocks with upcoming ex-dividend dates, we screened for the stocks with quality scores of 22 or higher. There are nine such candidates this week.
Below we present the quality scores, an assessment of fair value (whether Above, At, or Below fair value), and two measures of each stock’s recent performance (1-year and 3-year trailing total returns [TTR]). Key metrics from the previous table are repeated here for convenience.
Created by the author from data in Dividend Radar and using DVK Quality Snapshots
Dividend Radar views fair value as a range. Two stocks are fairly valued as they are trading within the fair value range, and three stocks have discounted valuations below the fair value range. These are indicated with green cells in the Fair Value column.
TTR adds the returns due to stock price appreciation (or depreciation) and dividend payments over each time frame. Dividend Radar provides 1-year and 3-year TTRs. The summary table highlights 3-year TTRs of 10% or higher in orange and any 1-year that exceeds the 3-year TTR in green (indicating stronger recent performance).
All but two of this week’s candidates have 3-year TTRs above 10%, but only one of those has a 1-year TTR that exceeds its 3-year TTR (HSY).
We also color-code the Yield and 5-yr DGR columns, preferring dividend yields above 2.5% and 5-year dividend growth rates of 10% or higher.
Three candidates have 5-year dividend growth rates above 10% (AMGN, LLY, and SHW), and three have forward yields above 2.5% (AMGN, JNJ, and UPS).
An Interesting Candidate
Ideally, we’d like to see green cells in each of the Fair Value, 1-yr TTR, Yield, and 5-yr DGR columns. That rarely happens, though, so we look for a candidate that offers the best metrics overall, at least based on our current investment objectives. We also like to focus on stocks we haven’t covered before.
This week, we’re highlighting Sherwin-Williams (SHW), a Dividend Aristocrat and Dividend Champion with 44 consecutive years of higher dividend payouts.
SHW develops, manufactures, distributes, and sells paints, coatings, and related products to professional, industrial, commercial, and retail customers in North and South America, the Caribbean, Europe, Asia, and Australia. The company operates in three segments: The Americas Group, Consumer Brands Group, and Performance Coatings Group. SHW was founded in 1866 and is headquartered in Cleveland, Ohio.
SHW is rated Fine (quality score 19-22):
Created by the author from a personal spreadsheet based on DVK Quality Snapshots
The stock yields only 0.98% at $243.74 per share but has an impressive 5-year dividend growth rate [DGR] of 15.4%.
Over the past ten years, SHW easily outperformed the SPDR S&P 500 ETF (SPY), an ETF designed to track the 500 companies in the S&P 500 index:
Portfolio-Insight.com
SHW delivered total returns of 477% versus SPY’s 256%, a margin of 1.86-to-1.
If we extend the time frame of comparison to the past 20 years, SHW also outperformed SPY, with total returns of 3,349% versus SPY’s 567% (a margin of 5.91-to-1). That’s a remarkable performance!
Here is a chart showing SHW’s dividend growth history through the end of 2021:
Portfolio Insight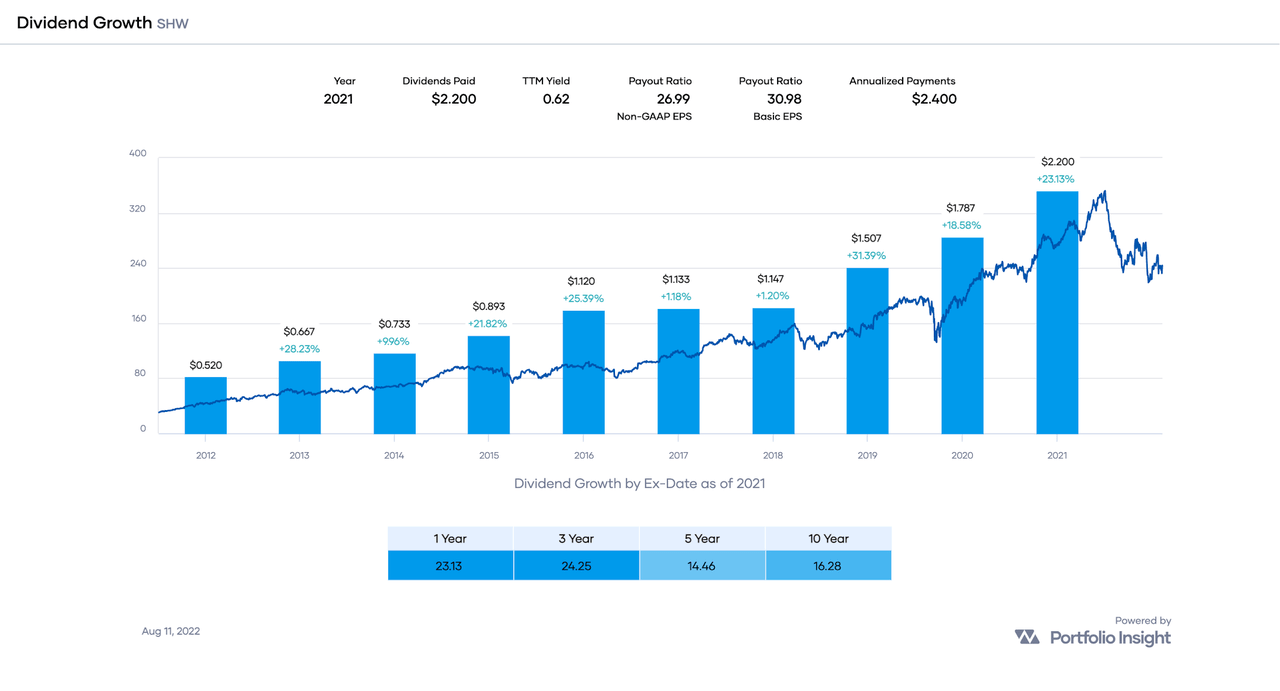
SHW has grown its dividend consistently and rapidly, particularly in the last three years. We can see this by dividing the 3-year DGR by the 5-year counterpart: 24.25 ÷ 14.45 = 1.68. A ratio above 1.00 indicates an acceleration of the DGR.
Likewise, SHW has grown its earnings per share over the past decade, but at a decelerating growth rate:
Portfolio Insight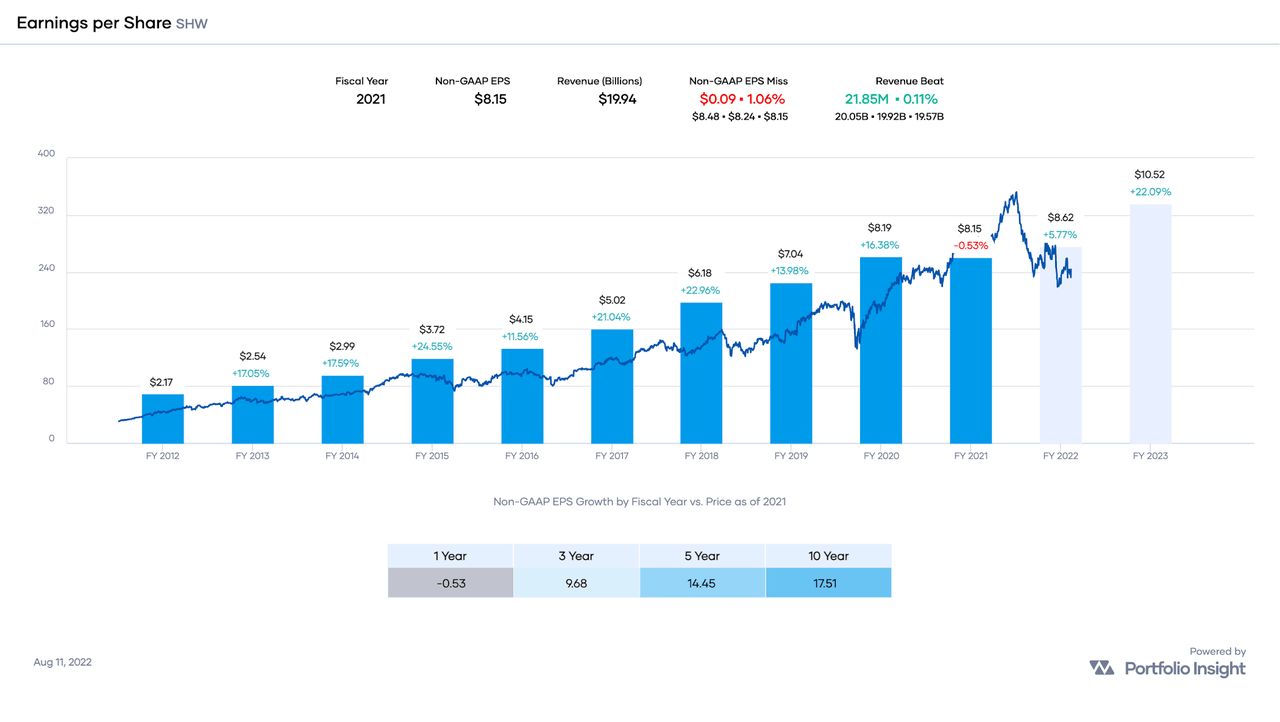
In the long term, sustainable dividend growth is only possible with commensurate earnings growth, so it is essential to consider SHW’s earnings payout ratio.
SHW’s earnings payout ratio of 31% is “low for most companies,” according to Simply Safe Dividends:
Simply Safe Dividends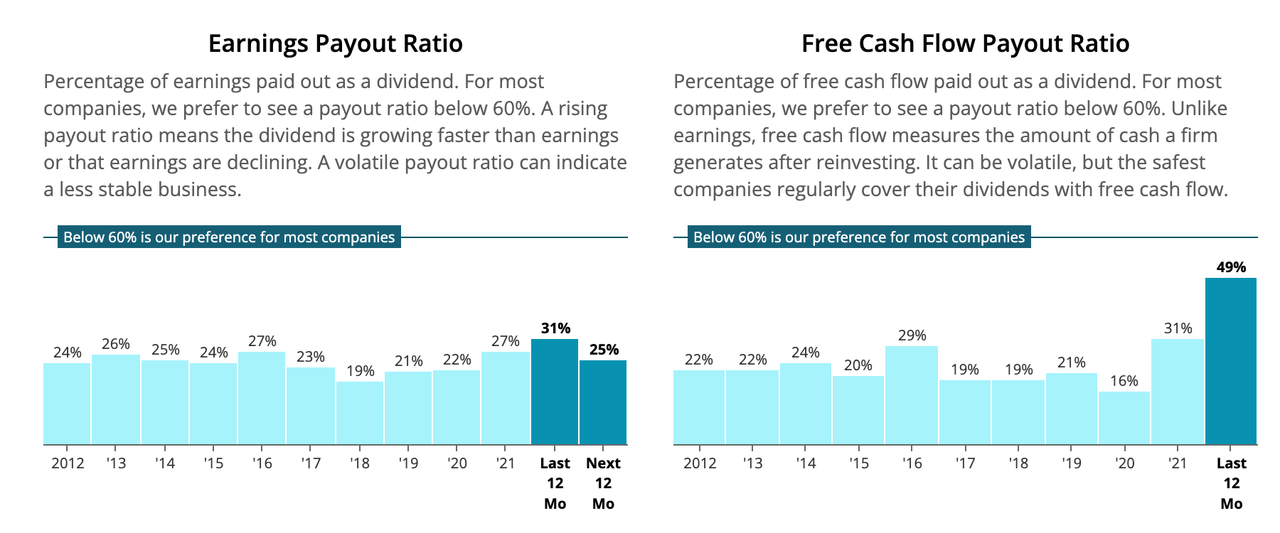
So, SHW has plenty of room to continue paying and increasing its dividend! Moreover, Simply Safe Dividends considers SHW’s dividend Very Safe with a Dividend Safety Score of 87.
Let’s now consider SHW’s valuation.
Portfolio Insight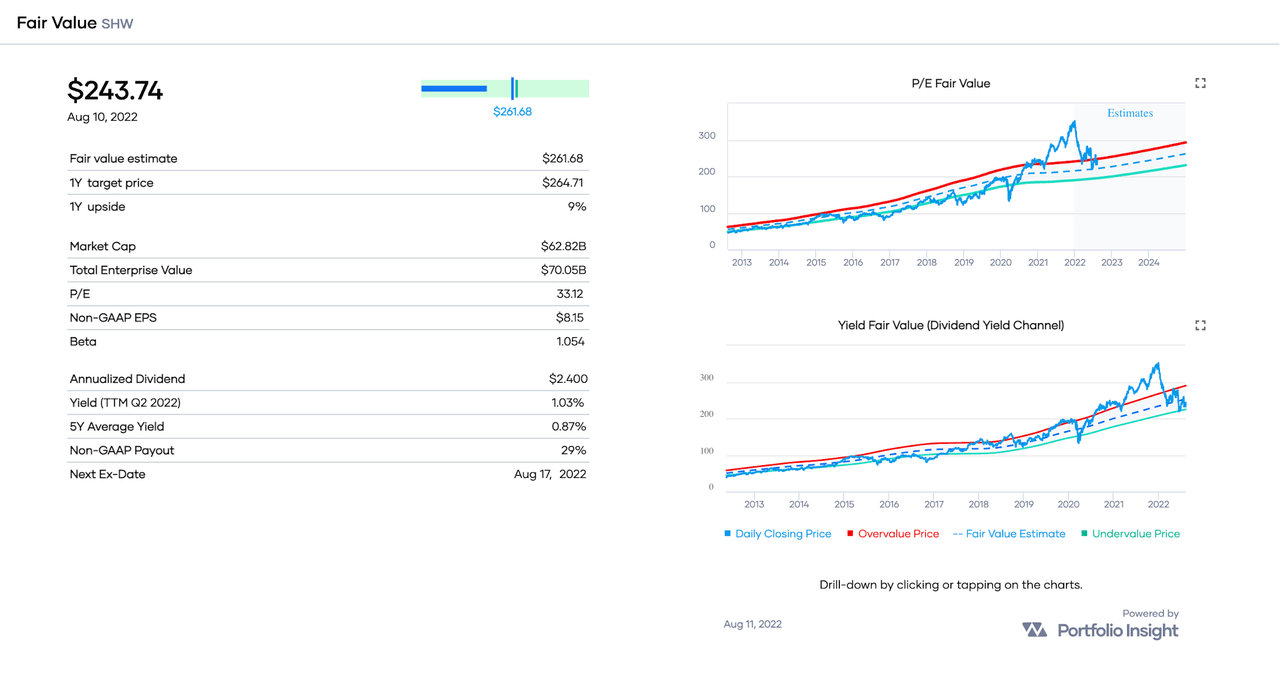
A quick way to estimate fair value is to divide the annualized dividend ($2.40) by the stock’s 5-year average yield (0.87%). That results in a fair value [FV] estimate of $276 based on SHW’s dividend yield history.
For reference, CFRA’s FV is $133, Morningstar’s FV is $200, Portfolio Insight’s FV is $262, Finbox.com’s FV is $241, and Simply Wall St’s FV is $268. That’s quite a range of opinions!
My own FV estimate of SHW is $255.
The average of all these estimates is $234. Given the stock’s current share price of $243.74 per share, it appears that SHW is trading at a small premium of about 4%.
Here are the most recent Seeking Alpha articles covering SHW:
Conclusion: SHW is a high-quality dividend growth stock trading below my FV estimate of $255. For stocks rated Fine, I require a discounted valuation. Therefore, my Buy Below price for SHW is $255 per share. For conservative investors, a buy below $230 would be more appropriate.
Be the first to comment