


coffeekai/iStock via Getty Images
The Fed released very few details thus far regarding the pace of the balance sheet reduction and just how it plans to go about it. However, a few clues dropped by Fed officials over the past few weeks suggest the size and pace of the reduction could be fast enough to be a massive problem for stocks.
Some early indications are for a reduction of around $100 billion per month. In a speech, the NY Fed’s Lori Logan indicated an average run-off of $80 billion a month in treasuries and 25 billion per month in MBS securities, or around $105 billion per month. Additionally, Minnesota Fed’s Governor Kashkari has indicated the pace of the run-off should be double the pace of the prior cycle. In December 2018, the balance sheet was running off at $50 billion.
The run-off at that pace could be a considerable problem for stocks because the last time the Fed ran down the balance sheet in 2018, it created a tremendous amount of volatility in the equity market.
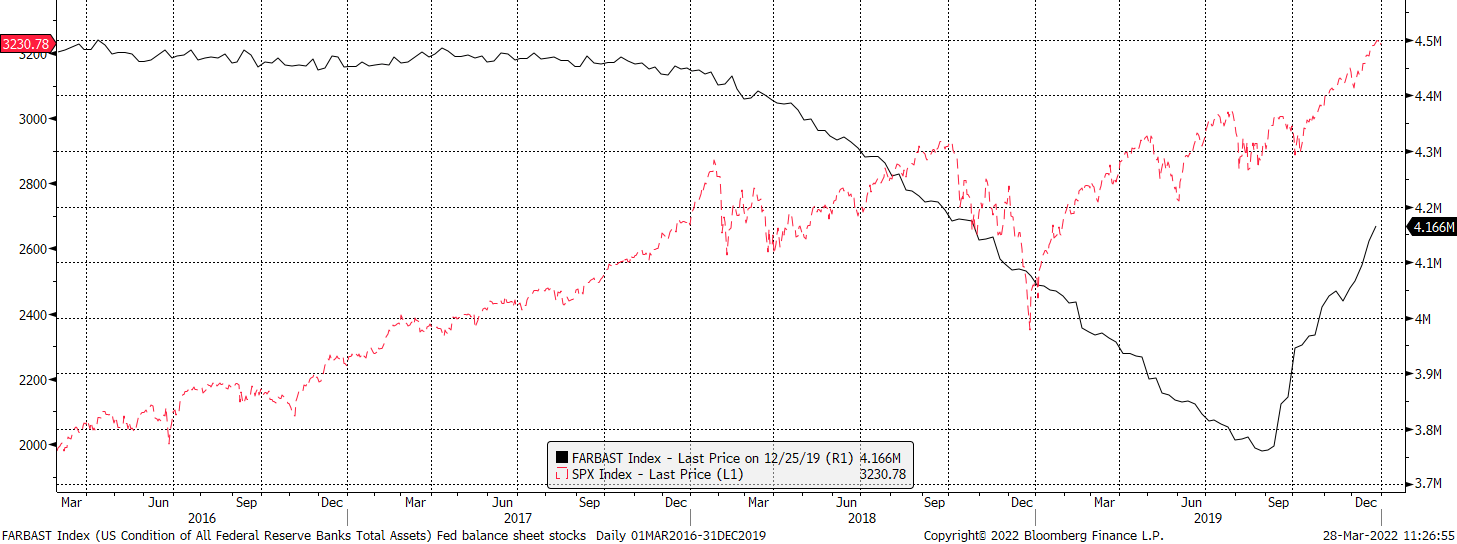
Bloomberg
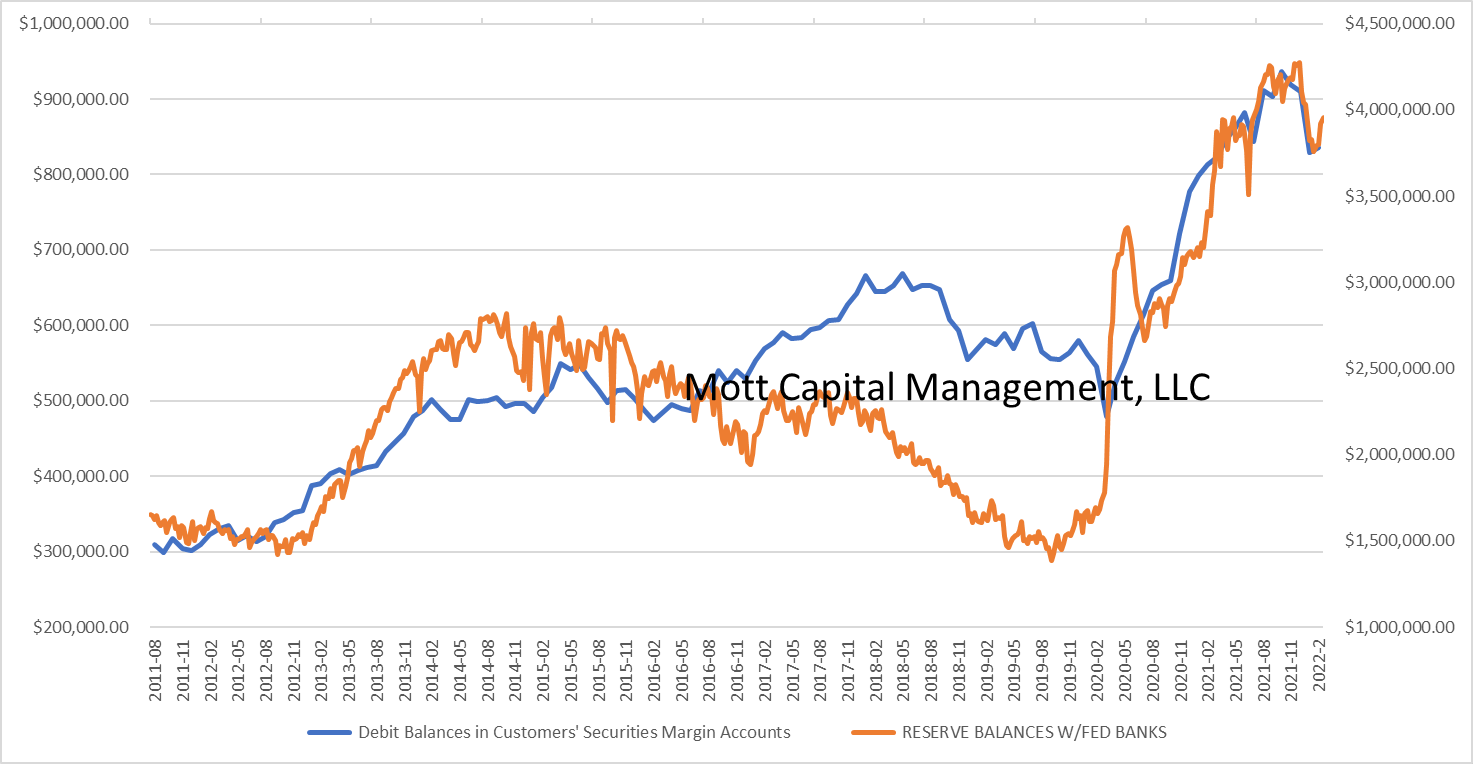
The big difference is that now stocks seem more tied to cheap liquidity than in 2018. Stocks trade for even higher PE multiples, with margin levels almost 50% higher than in 2018. So as the Fed begins to unwind its balance sheet, the market will lose liquidity as the reserve balances held by banks at the Fed begin to drop.
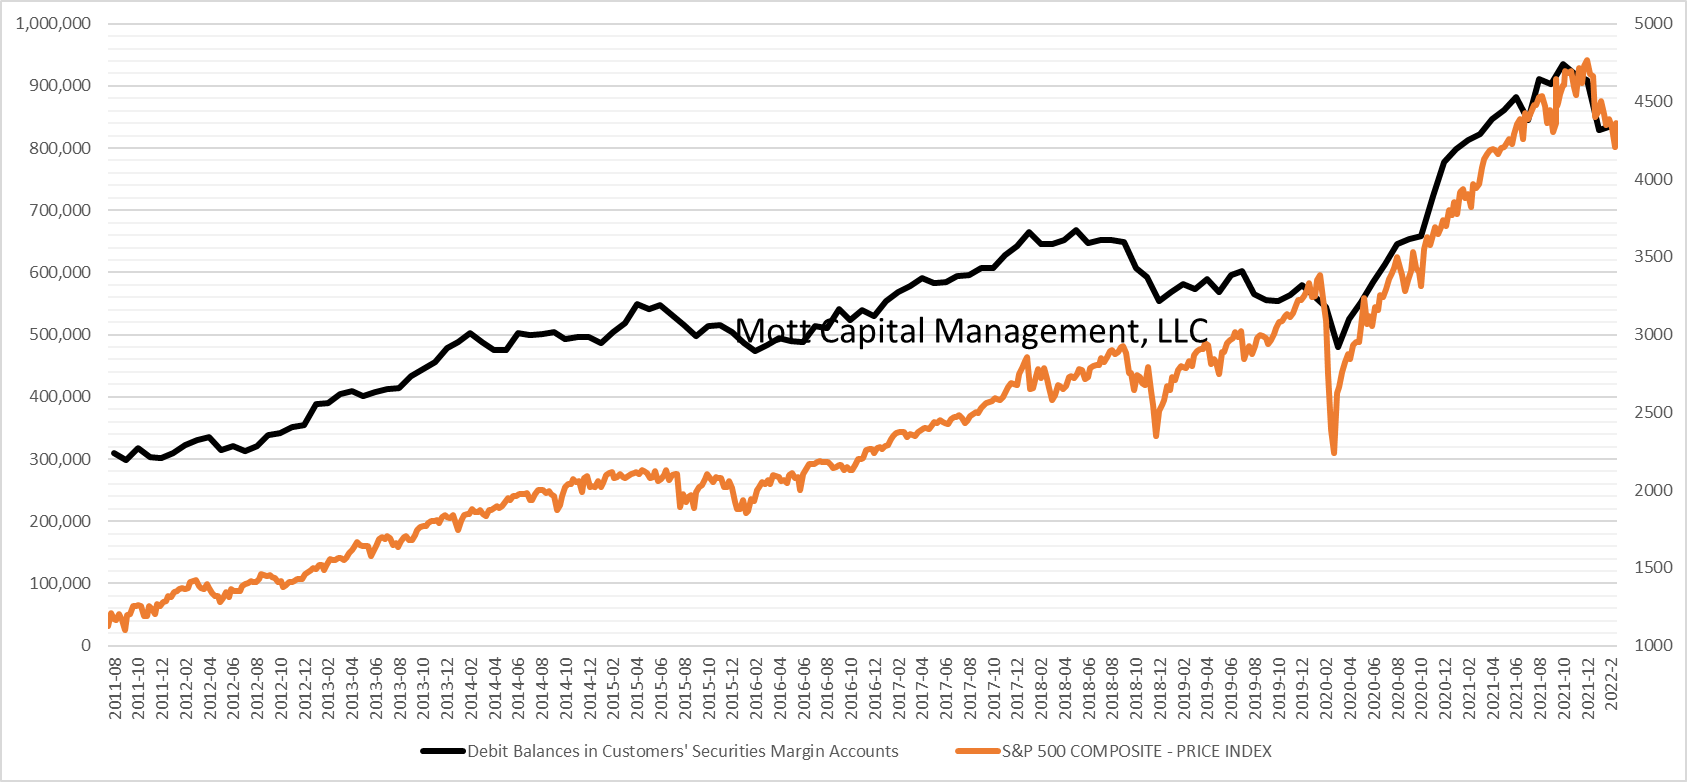
Mott Capital
Warning Signs
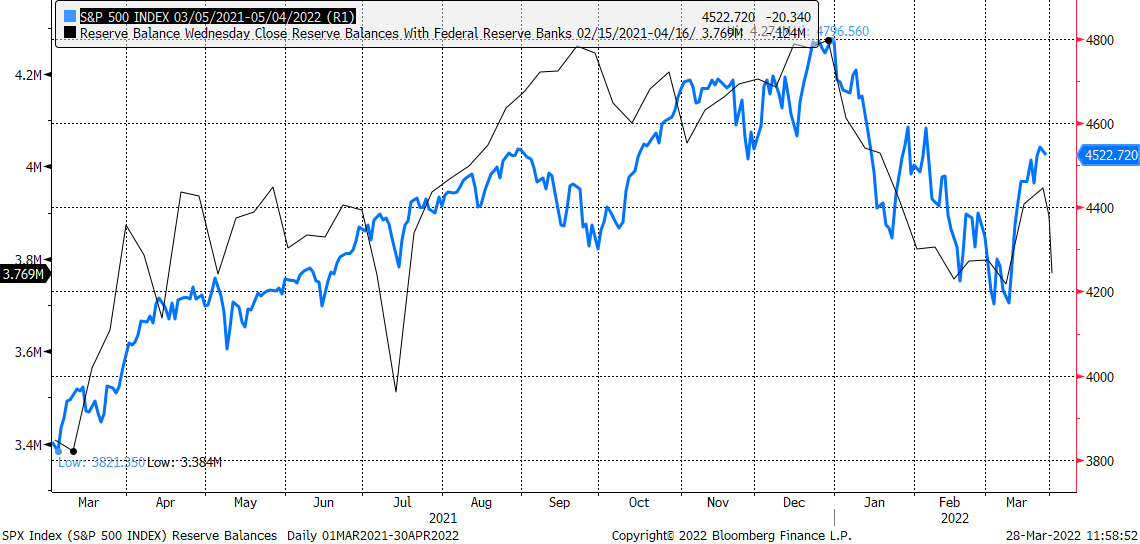
The early indication is that the balance sheet reduction will significantly affect where stocks go. With QE over, reserve balances have stopped rising. The reserve balances peaked on December 29 at nearly $4.3 trillion and have been steadily falling since and currently stand shy of $3.8 trillion.
The decline in reserve balances is due to increased activity in reverse repos at the NY Fed and increases in the US Treasury’s general account. Now, since the Fed is no longer buying bonds, the size of the balance sheet is no longer growing, and day-to-day changes in an activity like reverse repos can act in a way to drain liquidity from the balance sheet. We are getting a preview of what might happen once the Fed starts balance sheet reduction.
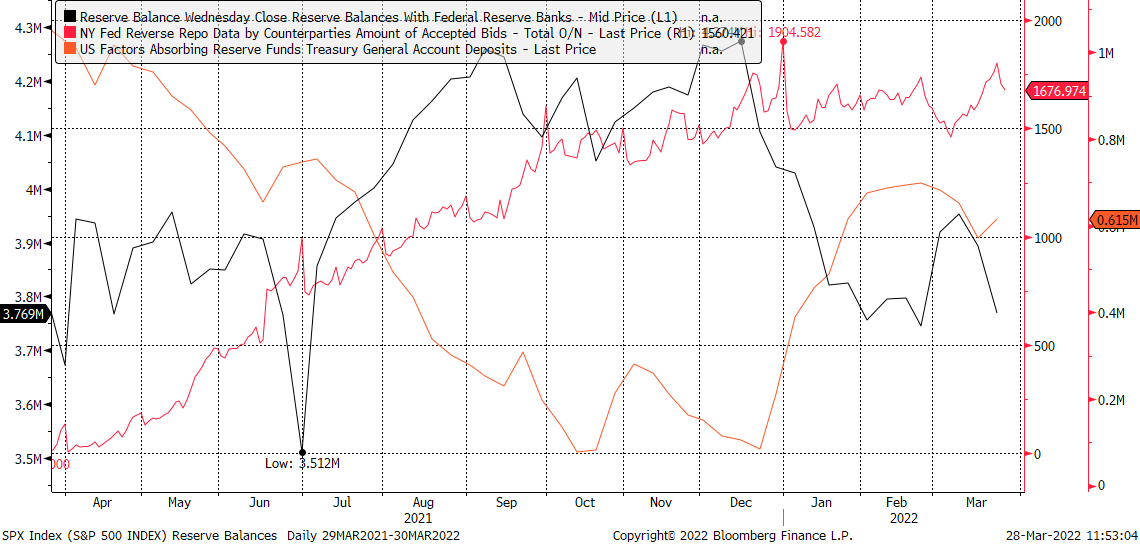
Bloomberg
It may not be by chance that the S&P 500 peaked in early January, around two weeks after reserve balances peaked. It may not be by chance that the S&P 500 bottomed in early March, nearly two weeks after the balance sheet bottomed on February 23.
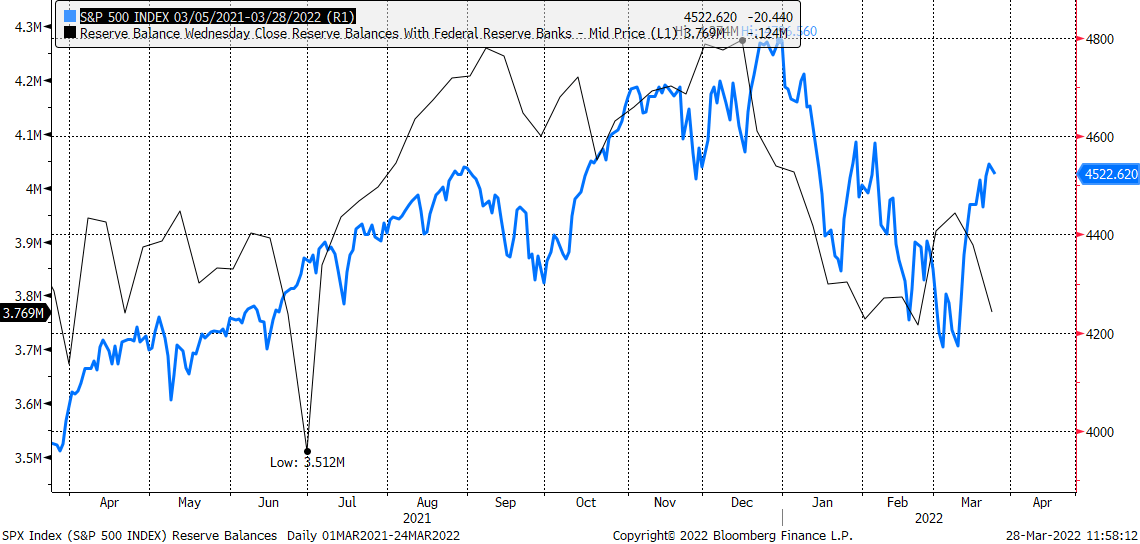
Bloomberg
A Test
It could very well be the case that reserve balance dictates where the stock market is heading with a 14-day lead time. When adjusting the chart with the reserve balances forward by 14 days, the S&P 500 and the reserve balances match up rather nicely. The sharp plunge in reserve balances over the past two weeks suggests the S&P 500 falls by a quiet bit over the next two weeks, perhaps giving back nearly all of its recent gains.
Bloomberg
One reason I think this may be happening has to do with the relationship between reserve balances and margin levels. Historically, margin levels tend to rise with reserve balances and fall when reserve balances fall.
Mott Capital
It isn’t to say this is a perfect correlation, but one that could easily be monitored over the next couple of weeks to see whether or not the relationship holds together. A simple test will come over the next two weeks. If the S&P 500 falls sharply, as indicated by the drop in reserve balances, and continues to work after that. It suggests that once the Fed does start to reduce the size of the balance, the stock market could fall sharply, or at least until it finds such an equilibrium where investors find real value in stock prices.
Be the first to comment