

svetikd
Clean energy stocks took a beating to cap off 2022. The Invesco WilderHill Clean Energy Portfolio ETF (PBW) fell huge from mid-August through year-end. One name in the fund’s portfolio is one you might not think of, but it could be forming a tradeable low.
But is the valuation of Universal Display now attractive after a lengthy downtrend? Let’s take a look.
Clean Energy: Dirty 2022 Returns
Stockcharts.com
According to Bank of America Global Research, Universal Display (NASDAQ:OLED) is currently a leader in the research, development, and commercialization of OLED materials with over 5,000 patents worldwide. UDC’s business segments include OLED material sales (over 50% of sales), royalty and license fees (40%), and contract research services (2-3%). Key customers are all major global panel makers such as Samsung Display, LG Display, BOE, etc.
The New Jersey-based Semiconductor & Semiconductor Equipment industry company within the Information Technology sector trades at a high 28.0 trailing 12-month GAAP price-to-earnings ratio and pays a small 1.1% dividend yield, according to the Wall Street Journal.
Back in November, shares surged following an EPS and revenue beat, helping to put in a bottom after a protracted downtrend. Still, there are risks such as weak operating performance out of LG and the possibility of declining capex by that firm. While margins are strong care of licensing agreements right now, a macro downturn would certainly hit Universal Display hard.
On valuation, analysts at BofA see earnings climbing below the rate of inflation through 2023. With just 2.2% of EPS growth seen in its FY 2022 and 2023, investors must wait until 2024 before earnings re-accelerate. Dividends should eventually move higher but may be stuck at $1.20 for the next several quarters.
Free cash flow, though, is seen as rising at an impressive pace in the next few years. The operating earnings ratio remains somewhat high and OLED’s EV/EBITDA multiple is at a premium to the market’s. Seeking Alpha rates the stock with a poor F grade, though the company’s PEG ratio is not exorbitant at just 1.76. Overall, the valuation has come in, but a downward re-rating could still be in the cards.
OLED: Earnings, Valuation, Free Cash Flow Forecasts
BofA Global Research
Looking ahead, corporate event data provided by Wall Street Horizon show an unconfirmed Q4 2022 earnings date of Wednesday, February 22 AMC. Before that, OLED’s management team is expected to speak at the upcoming 25th Annual Needham Growth Conference from January 10 through 12. The volatility catalysts don’t end there, though, as another presentation engagement comes from February 28 through March 2 at LOPEC 2023.
Corporate Event Calendar
Wall Street Horizon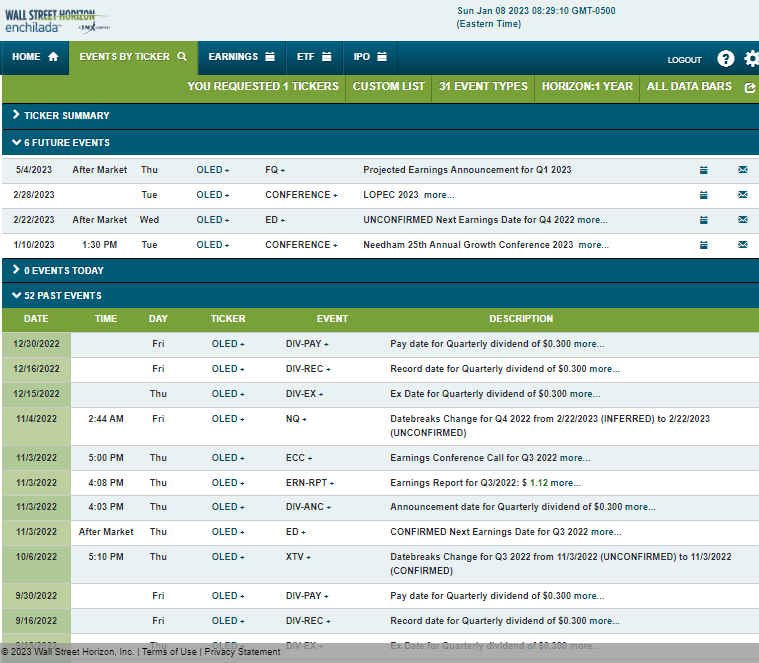
The Technical Take
OLED is getting close to a bullish breakout, but we aren’t quite there yet. Notice in the chart below that shares remain stuck in a downtrend that has been ongoing for the better part of two years. What’s encouraging for the bulls, however, is that the RSI momentum indicator at the top of the chart shows a bullish divergence back during the stock’s Q4 lows.
Now, OLED is probing its falling 200-day moving average which has confluence with a downtrend resistance line. If the stock climbed above the $120 to $125 range, that could portend a rally toward the mid to high $170s – the highest from early Q1 and Q2 last year. Keep this one on your radar.
OLED: On Breakout Watch
Stockcharts.com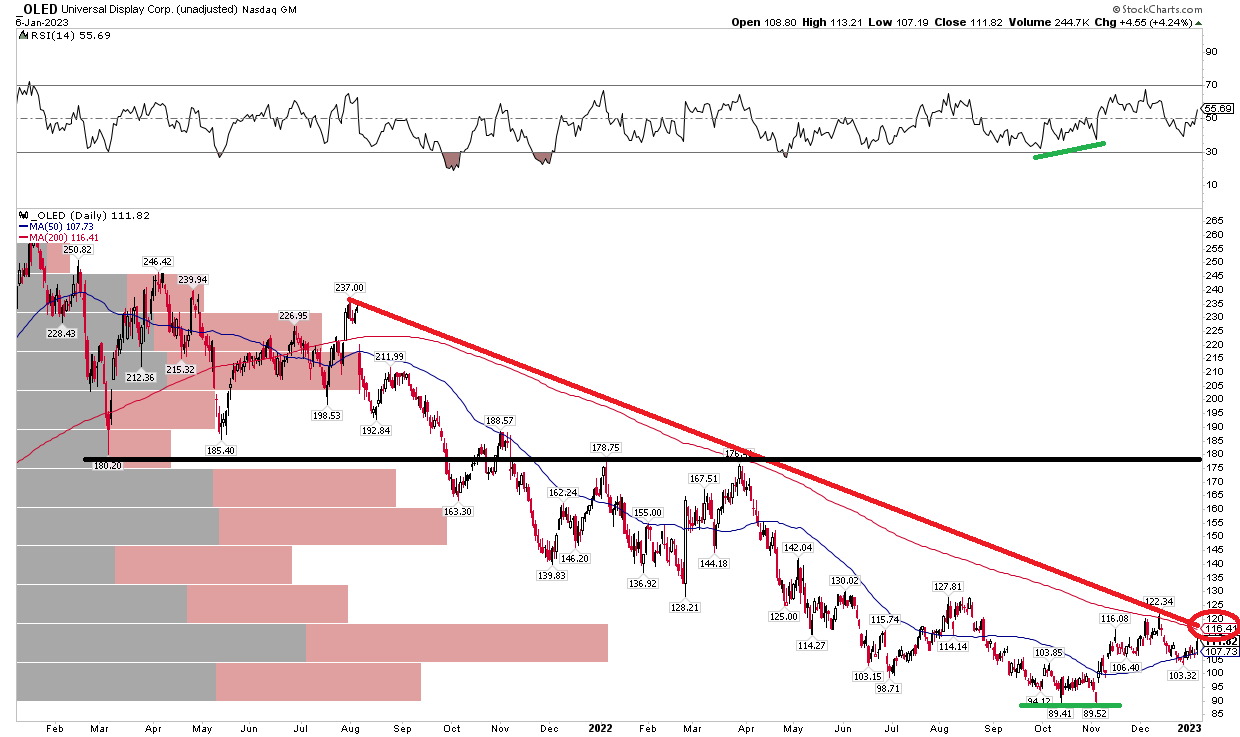
The Bottom Line
I am not a big fan of Universal Display’s valuation yet, but the chart is nearing a critical juncture. If the stock rallied a bit more, which could happen with a few notable events on tap, then momentum might be seen in the stock. For now, that technical move remains to be seen while decent earnings growth is still a couple of years away.
Be the first to comment