

Viorika
UnitedHealth (NYSE:UNH) has been a notable outperformer over the past year, with a total return of 26.5% vs. -12.2% for the S&P 500 (SPY) and -2.7% for the Health Care Select SPDR ETF (XLV). For context, XLV is allocated to the healthcare companies in the S&P 500 and UNH is the largest holding. It is also important to note that the healthcare plan industry (as tracked by Morningstar) is up 26.1% over the last year, so UNH’s returns are primarily a reflection of a resurgence in investor confidence in this industry. That said, UNH is clearly laying a foundation to lead in the emerging healthcare space.
Seeking Alpha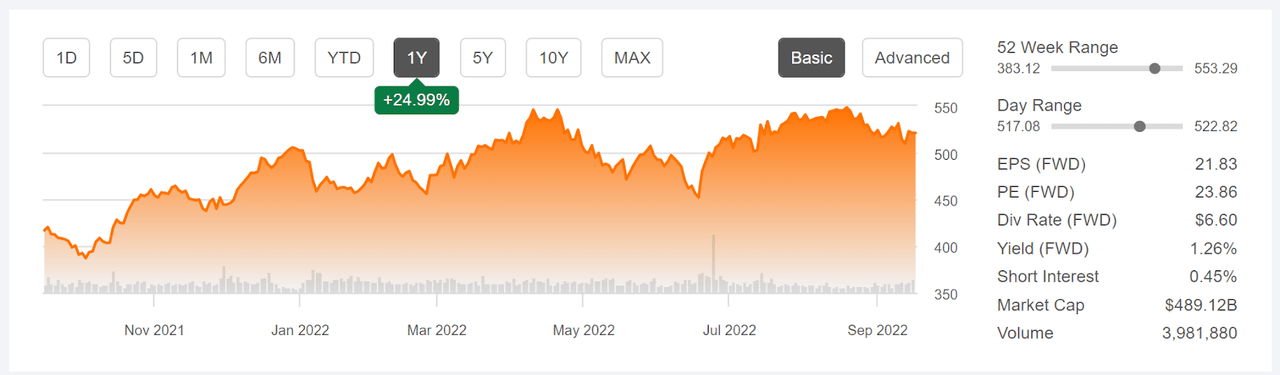
12-Month price history and basic statistics for UNH (Source: Seeking Alpha)
UNH’s growth advantages come from the synergies of combining health insurance (UnitedHealthcare), data analytics (Optum Insight), pharmacy services (Optum Rx), and medical care facilities (Optum Health). UNH and Walmart recently announced a collaboration to provide affordable health services, initially in 13 Walmart stores with plans to expand. The effort leverages data analytics and decision support from UNH’s Optum division. Not surprisingly, the company is also focused on growing digital engagement with patients.
UNH has been growing earnings steadily, albeit with a blowout in Q2 of 2020, largely due to insurance customers putting off all kinds of non-critical medical services during COVID. At that time, the percentage of premiums paid out cover claims, referred to as the medical loss ratio, reached historic lows. Management warned that this earnings boost would be offset by higher claims later in the year as patients caught up on deferred medical services. Indeed, earnings fell in Q3 of 2020 and further still in Q4. Since then, as demand has normalized, earnings have grown consistently. The consensus outlook for earnings growth over the next 3 to 5 years is 13.9% per year.
ETrade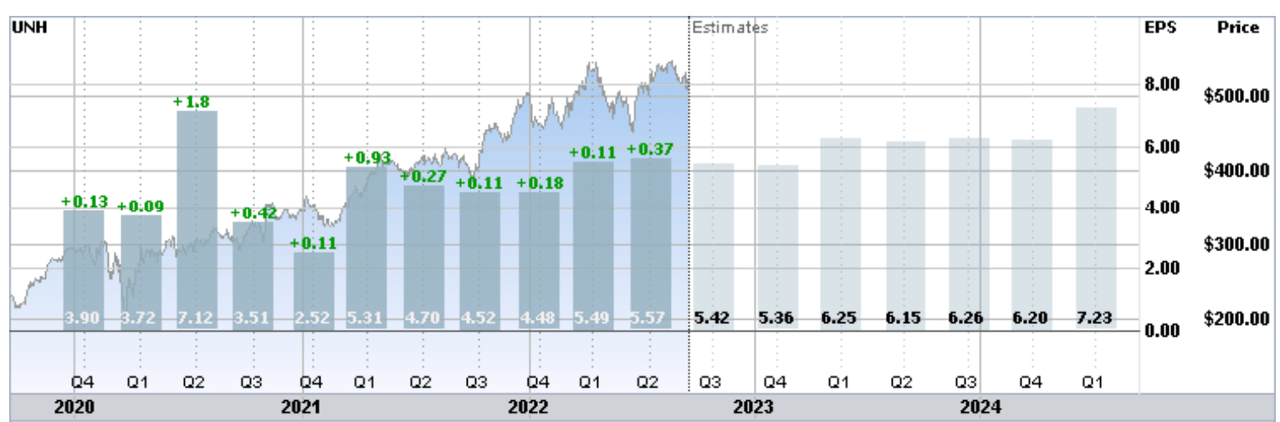
Historical (3 years) and estimated future (2 years) quarterly EPS for UNH. Green values are amounts by which reported EPS beat the consensus expected value (Source: ETrade)
I last wrote about UNH on February 24, 2022, almost 7 months ago, and I maintained a buy rating on the stock. At that time, ahead of the Q1 results reported on April 14th, the growth trajectory looked solid. The shares were definitely expensive in terms of historical P/E levels, but the growth narrative made the pricing look acceptable. The Wall Street consensus rating was bullish, with an expected 12-month total return of about 15.5%. In analyzing a stock, I also rely on a form of consensus outlook derived from the prices of call and put options on a stock, the market-implied outlook. As of February 24th, the market-implied outlooks were robustly bullish to the middle of 2022 and also to the start of 2023, with expected volatility in the range of 30%-31% (annualized). As a rule of thumb for a buy rating, I want to see an expected total (12-month) return that is at least ½ of the annualized volatility. Taking the Wall Street consensus price target at face value, UNH just hit this threshold (15.5% expected return vs. 30%-31% volatility). With all of the indicators lining up, maintaining the buy rating was the obvious conclusion. Since this post, UNH has returned 17% vs. a decline for the S&P 500.
Seeking Alpha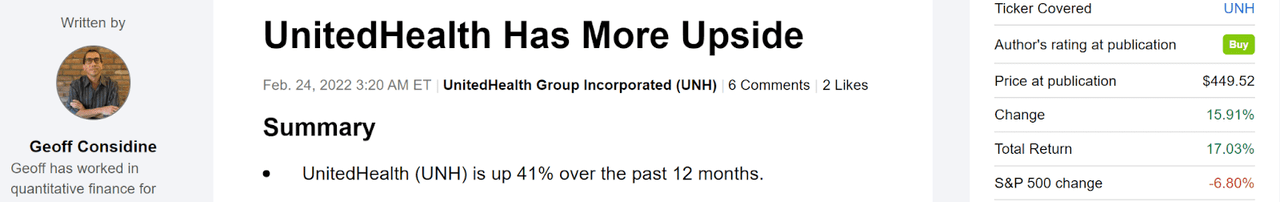
Previous post on UNH and subsequent performance vs. the S&P 500 (Source: Seeking Alpha)
For readers who are unfamiliar with the market-implied outlook, a brief explanation is needed. The price of an option on a stock is largely determined by the market’s consensus estimate of the probability that the stock price will rise above (call option) or fall below (put option) a specific level (the option strike price) between now and when the option expires. By analyzing the prices of call and put options at a range of strike prices, all with the same expiration date, it is possible to calculate a probabilistic price forecast that reconciles the options prices. This is the market-implied outlook. For a deeper explanation and background, I recommend this monograph published by the CFA Institute.
Readers may also find it interesting that the market-implied outlook was strongly bullish on XLV at the start of March of 2022.
With almost 7 months, and 2 additional quarters’ earnings, since I looked at UNH, I have calculated updated market-implied outlooks for UNH and compared these with the current Wall Street consensus outlook in revisiting my rating on the stock.
Wall Street Consensus Outlook for UNH
ETrade calculates the Wall Street consensus outlook for UNH by combining the views of 12 ranked analysts who have published ratings and price targets over the past 3 months. The consensus rating is a buy and the consensus 12-month price target is 13.25% above the current share price. For my previous analysis in March, the consensus 12-month price target was $527.70 and the 12-month price return implied by this price target was 14.56%. The price target has risen only slightly slower than the share price, so the expected price appreciation remains comparable to the value from February.
ETrade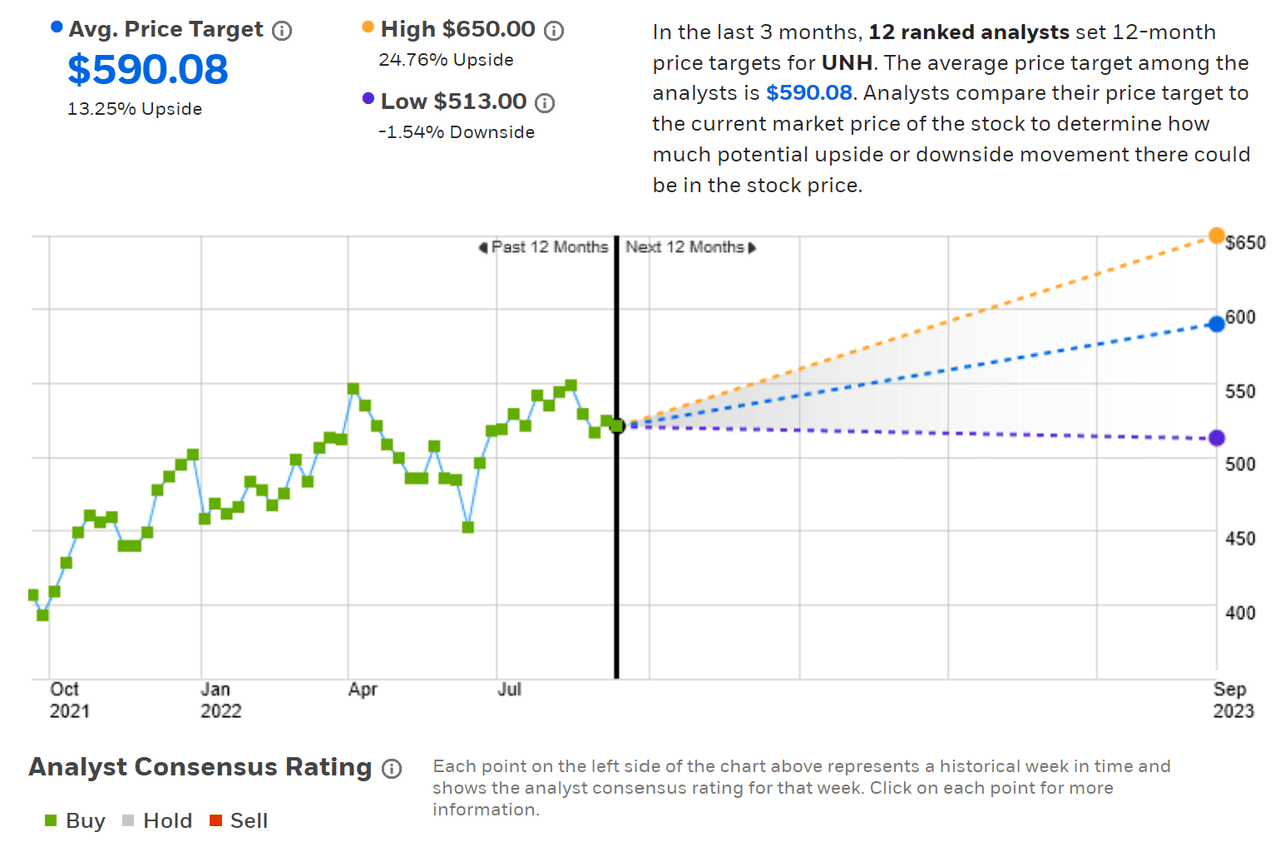
Wall Street analyst consensus rating and 12-month price target for UNH (Source: ETrade)
Seeking Alpha’s version of the Wall Street consensus outlook uses price targets and ratings from 26 analysts who have published opinions within the last 90 days. The consensus rating is a buy and the consensus 12-month price target is 10.1% above the current share price. The 12-month price target was $526.47 when I last wrote about UNH in February.
Seeking Alpha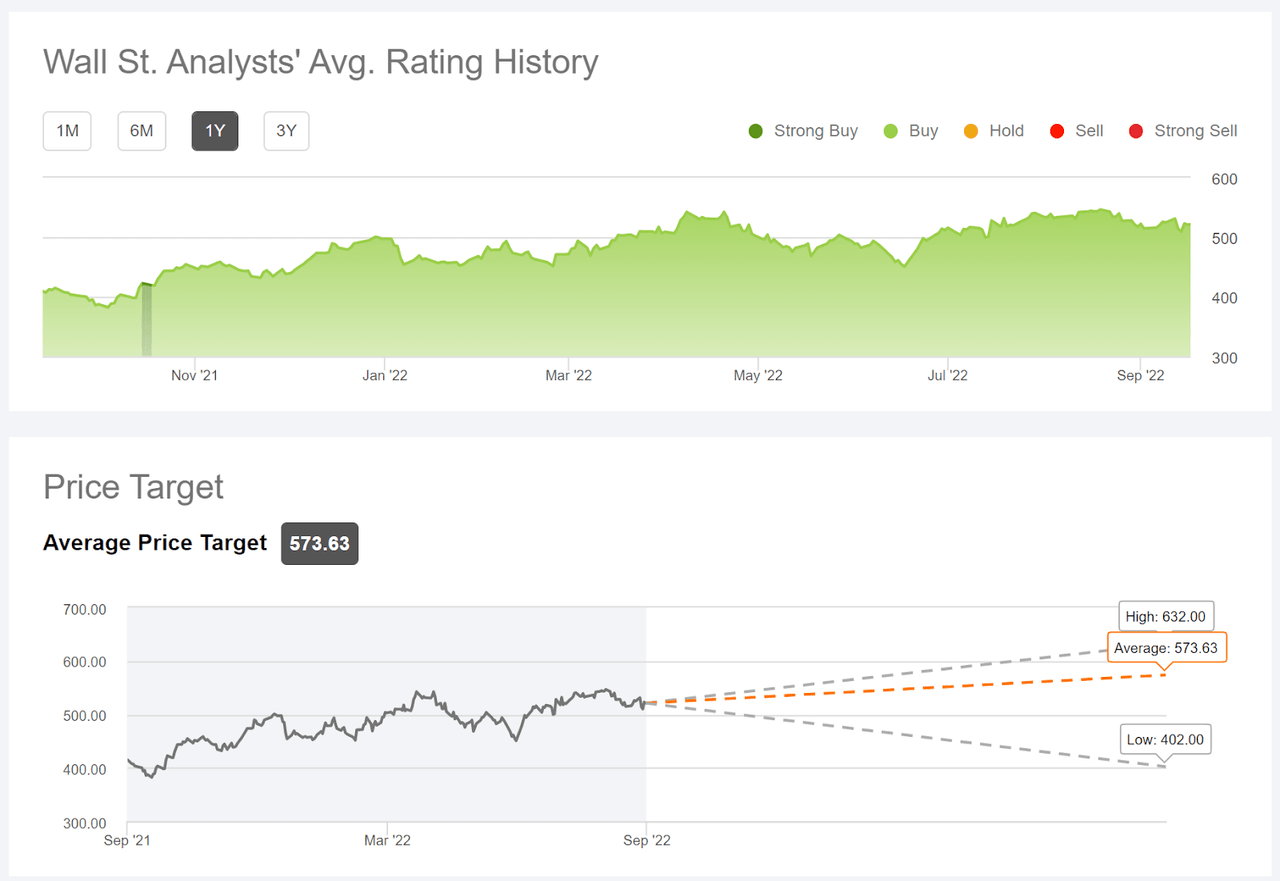
Wall Street analyst consensus rating and 12-month price target for UNH (Source: Seeking Alpha)
The Wall Street consensus outlook on UNH has been continuously bullish over the past year and continues to be favorable. The consensus expected 12-month total return is 12.9% (averaging the two consensus price targets and adding the dividend). To put this number in context, the trailing 5-, 10-, and 15-year annualized total returns are 22.4%, 26.2%, and 17.4%, respectively. In other words, the prevailing view is that the expected return will be well below historical levels.
Market-Implied Outlook for UNH
I have calculated the market-implied outlook for UNH for the 4.1-month period from now until January 20, 2023 and for the 8.9-month period from now until June 16, 2023, using the prices of call and put options that expire on these dates. I selected these two dates to provide a view to the start and middle of 2023, as well as because the options expiring in January and June tend to be among the most liquid.
The standard presentation of the market-implied outlook is a probability distribution of price return, with probability on the vertical axis and return on the horizontal.
Geoff Considine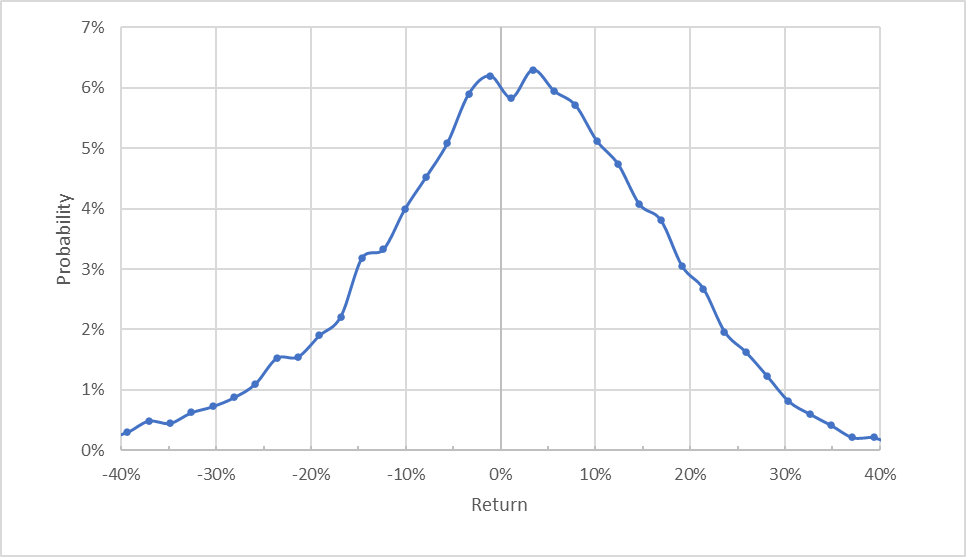
Market-implied price return probabilities for UNH for the 4.1-month period from now until January 20, 2023 (Source: Author’s calculations using options quotes from ETrade)
The market-implied outlook to the middle of January of 2023 looks generally symmetric, although it is evident that the probabilities are shifted (to the right) to favor positive returns. The expected volatility calculated from this outlook is 27.6% (annualized). This is slightly below the annualized volatility of around 30% from back in February.
To make it easier to compare the relative probabilities of positive and negative returns, I rotate the negative return side of the distribution about the vertical axis (see chart below).
Geoff Considine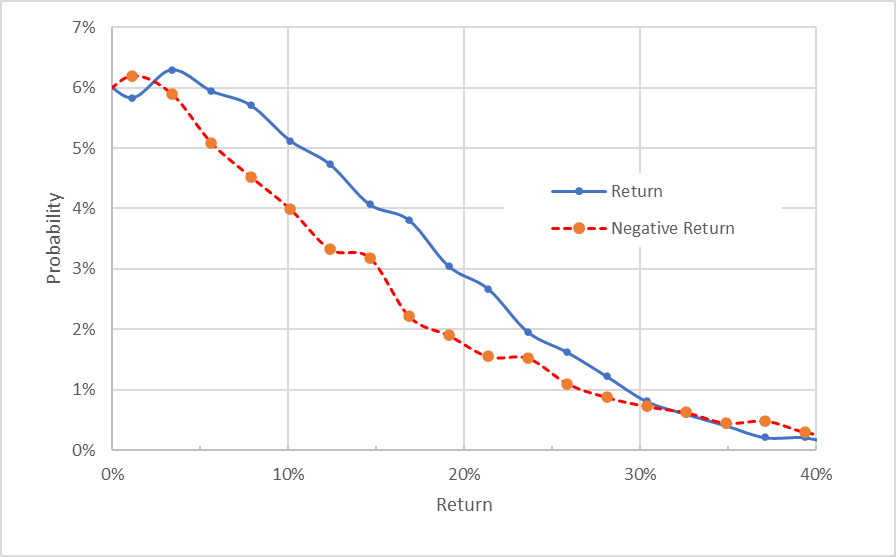
Market-implied price return probabilities for UNH for the 4.1-month period from now until January 20, 2023. The negative return side of the distribution has been rotated about the vertical axis (Source: Author’s calculations using options quotes from ETrade)
This view shows that the probabilities of positive returns are consistently higher than those for negative returns of the same magnitude, across a wide range of the most-probable outcomes (the solid blue line is well above the dashed red line over almost all of the left ¾ of the chart above). This is a solidly bullish outlook. This outlook is qualitatively very similar to the 3.7-month outlook from back in February.
Theory indicates that the market-implied outlook is expected to have a negative bias because investors, in aggregate, are risk averse and thus tend to pay more than fair value for downside protection. There is no way to measure the magnitude of this bias, or whether it is even present, however. The expectation of a negative bias reinforces the bullish interpretation of this outlook.
The market-implied outlook for the next 8.9 months, from now until June 16, 2023, is also bullish (see chart below), with elevated probabilities of positive returns over almost the entire range of possible outcomes. The expected volatility calculated from this distribution is 28.5%. This outlook is more bullish than the 10.8-month outlook from February.
Geoff Considine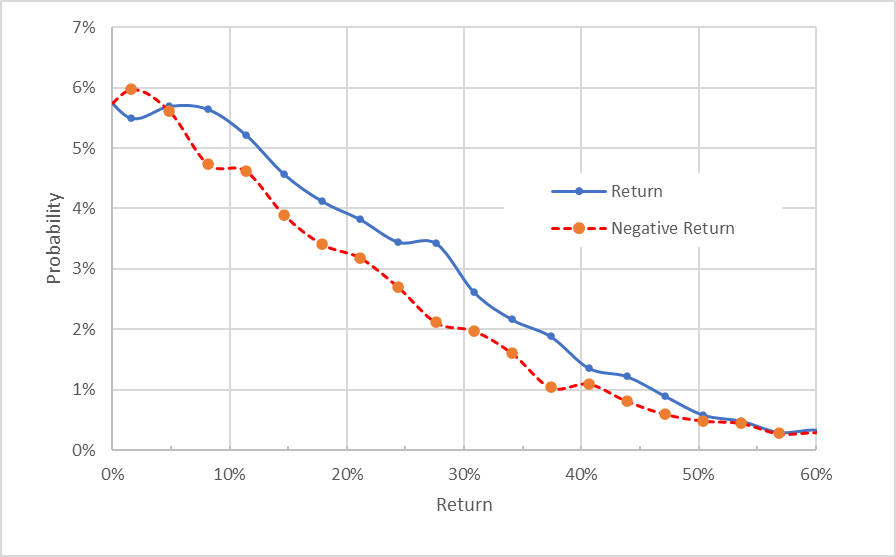
Market-implied price return probabilities for UNH for the 8.9-month period from now until June 16, 2023. The negative return side of the distribution has been rotated about the vertical axis (Source: Author’s calculations using options quotes from ETrade)
The updated market-implied outlooks, looking to January and to June of 2023, continue to be bullish and the expected volatility has fallen slightly to about 28%.
Summary
UnitedHealth has been a strong performer over the last year, continuing to grow at an impressive rate. The company has mapped out a compelling vision as a hub of healthcare services and the company’s portfolio of products and services is hard to compete with. The rising valuation, reflecting increasing investor optimism, is something of a concern, however. Even with the substantial gains over the recent years, the Wall Street consensus rating remains bullish, but the expected return implied by the consensus price target is below the stock’s annualized returns over the past 15 years. The prevailing view is that the company is well-positioned but that price appreciation is expected to slow as more and more expected growth is reflected in the current share price. The Wall Street consensus 12-month price target implies a total return of 12.9% over the next year, slightly less than ½ the annualized expected volatility, 28%. This ratio of expected return to risk is a bit below what I look for in assigning a buy rating. The market-implied outlooks continue to be robustly bullish to the start and to the middle of 2023, however. I am maintaining a buy rating on UNH.
Be the first to comment