

MarekUsz
This article examines the fundamental and technical outlook for the US Dollar Index (DXY) by studying the present situation of the economy, federal debt, inflation, and interest rates of the United States. The debt of the United States has been growing exponentially, and in 2022, inflation hits the highest level in the past four decades. In an effort to control inflation, the Federal Reserve (Fed) has been increasing interest rates, but the inflation curve has not been significantly affected. In 2023, the Fed is likely to raise interest rates, which will affect the yield on US Treasury securities and, consequently, the value of the US dollar. As indicated by the position of the 10-year treasury constant maturity minus the 3-month treasury constant maturity below zero, a recession is imminent. On the other hand, there is no significant impact of higher interest rates on retail sales and the net worth of households and non-profit organizations.
Technically, the US dollar achieves the objective of 114.50 in 2022. After achieving the objective, the US dollar index declined to close the yearly candle between the long-term range of 88 and 103.50. The monthly and weekly charts also indicate a bearish outlook by forming a symmetrical broadening wedge and ascending broadening pattern. Therefore, the medium-term outlook for the US dollar index is bearish, while the long-term outlook will depend on the breakout below 88 levels on the monthly charts. Traders will be selling US dollars with the objective of 88 levels during 2023.
Debt, inflation, and interest rates
The total federal debt is $31.35 at the time of writing and continues to increase exponentially. The US inflation rate has surpassed the 40-year record and shows no signs of easing. The rising US debt accompanied by rising interest rates as a result of higher inflation has been a significant problem for the US treasury that is currently unnoticed. The chart below presents the Consumer Price Index (CPI) of all consumers in US cities and the effective federal funds rates for the past 20 years, and it can be seen that the increment in federal funds rates above 4% over the past three months has only resulted in a decrement of CPI to 7.11%. The decline in inflation is unnoticed, and if investors’ capital does not increase in tandem with the increase in real inflation, investors’ wealth may decline over time.
Consumer Price Index and Effective Federal Funds Rate (fred.stlouisfed.org)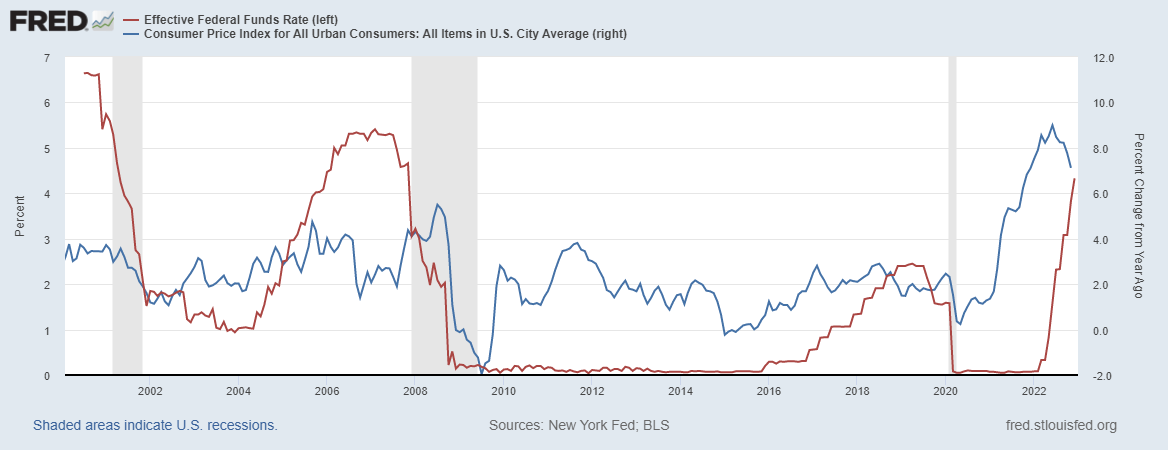
In my opinion, Fed will likely raise interest rates further in 2023 due to uncontrollable inflation, and the effect of interest rates on the economy takes several months to actually happen. Consequently, increased debt, interest rates, and inflation will have a negative effect on the economy of the United States. In contrast, the Russia-Ukraine conflict has a much greater impact on US spending as well.
The higher interest rates have also affected the yield on US Treasury securities, with the 1-year yield exceeding the 2-year yield, reflecting the bond market’s expectation that the Fed will soon be forced to reduce rates. Similarly, a negative yield curve, as indicated by a 10-year constant maturity minus 3-month constant maturity below zero, indicates that the United States economy might enter a recession in 2023. The area marked in the chart below indicates that when the curve enters the negative territory, a recession evolves.
10-year Treasury maturity constant minus 3-month Treasury maturity constant (fred.stlouisfed.org)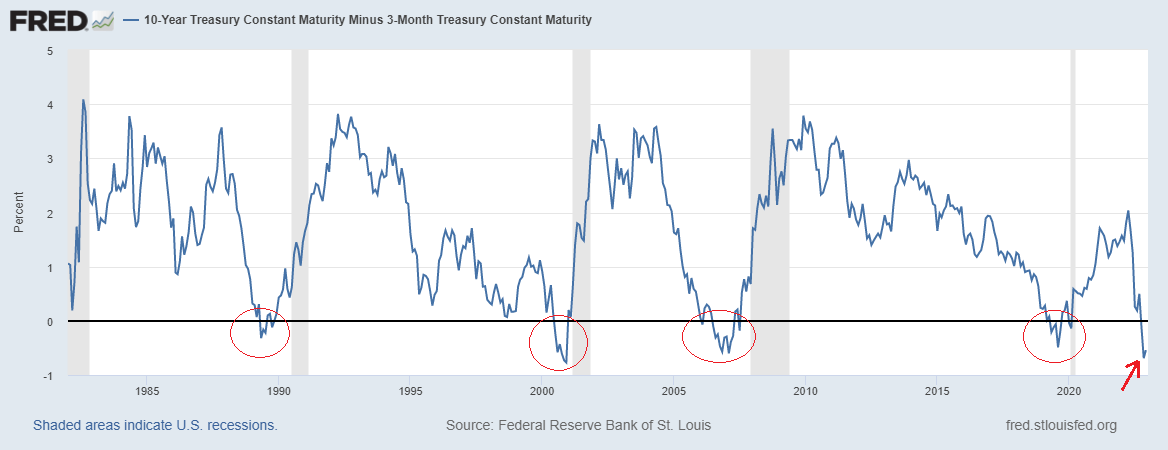
The US economy
Despite the rise in interest rates since March 2022, real retail sales continue to outpace the pre-pandemic trend with no signs of slowing. The increment in retail sales is greater than the increment in disposable personal income, as consumers incur debt and deplete savings. As consumers continue to spend, the Fed’s efforts to reduce demand in order to curb inflation are waning. On the other hand, household net worth has skyrocketed due to the enormous increase in home and stock prices. This is bolstered by inexpensive debt and rising savings, both of which are a result of government stimulus during the pandemic. Since the 2008 global financial crisis, the ratio of household and non-profit organizations’ net worth to disposable personal income has increased as shown in the chart below. In contrast, the unemployment rate has reached record lows as a result of higher inflation, as employers battle for scarce labor.
Household and Nonprofit Organization Net Worth (fred.stlouisfed.org)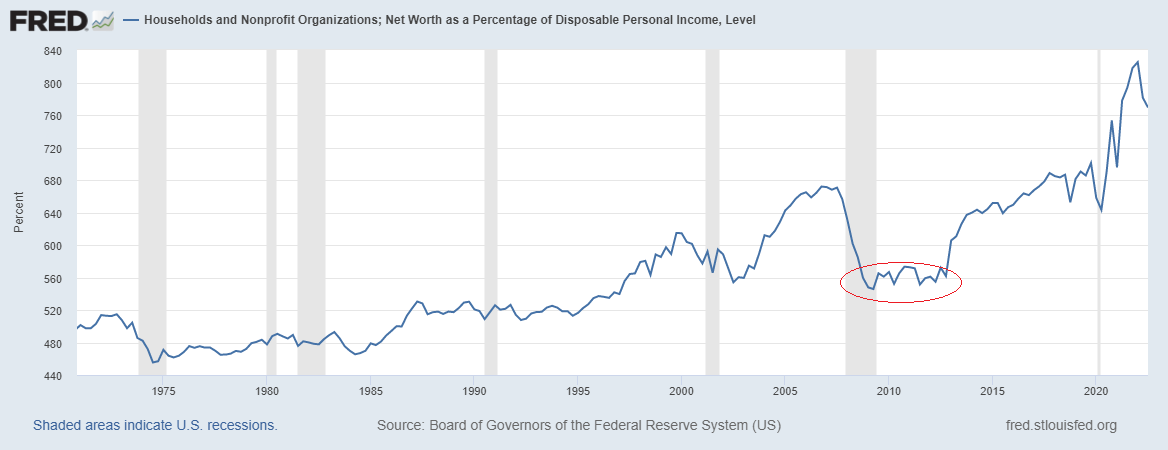
Permits for new construction fell 11.2% in November 2022 as seen in the chart below, representing another leading indicator for the US economy. During the 2011 financial crisis, the monthly permits were between 500,000 and 600,000. The number of building permits steadily rises to approximately 1.9 million. Despite a slight decline in 2022, the permits are still 1.34 million, the lowest level since June 2020. However, it remains far above the levels seen during the global financial crisis of 2011. A decline in housing permits is indicative of a weakening of the US economy, and a decline below 1 million would increase the likelihood of further inflation.
New Privately-Owned Housing Units (fred.stlouisfed.org)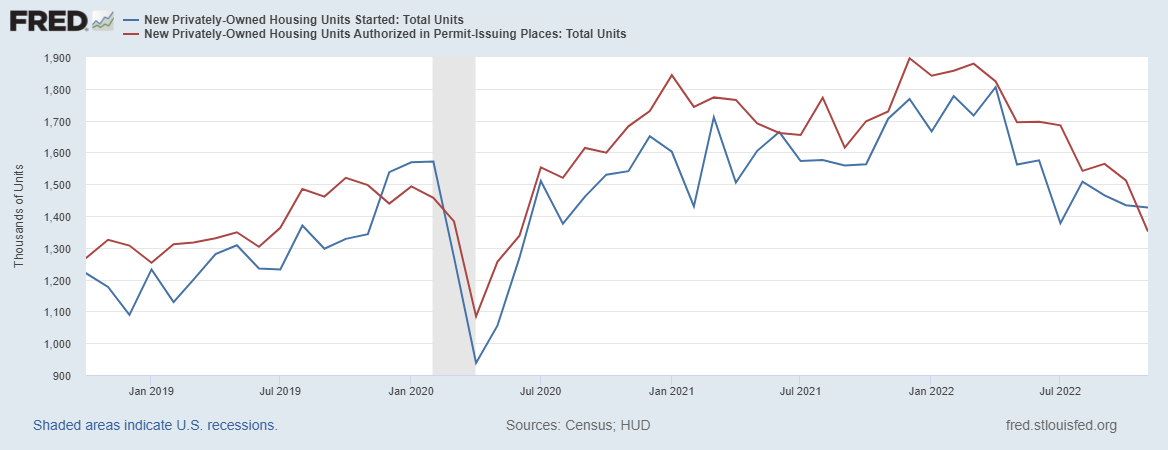
Bearish development in the US dollar index
Long-term outlook
The US dollar index has been consolidating between 88 and 103.50 for the past seven years, as shown by the yearly chart below. Monetary policies, including geopolitical tensions among nations and higher interest rates, boosted dollar demand, and the price broke above 103.50 and hit a strong resistance on the monthly chart, as depicted in the second chart of this section. After the hit of resistance, the price retraced back to finish the year 2022 within the defined range of 88 and 103.50. This dollar pumping cast a significant shadow on the 2022 yearly candle as seen in the chart below. This shadow indicates that the US dollar index is experiencing additional weakness and may continue to decline in 2023.
US Dollar Yearly (stockcharts.com)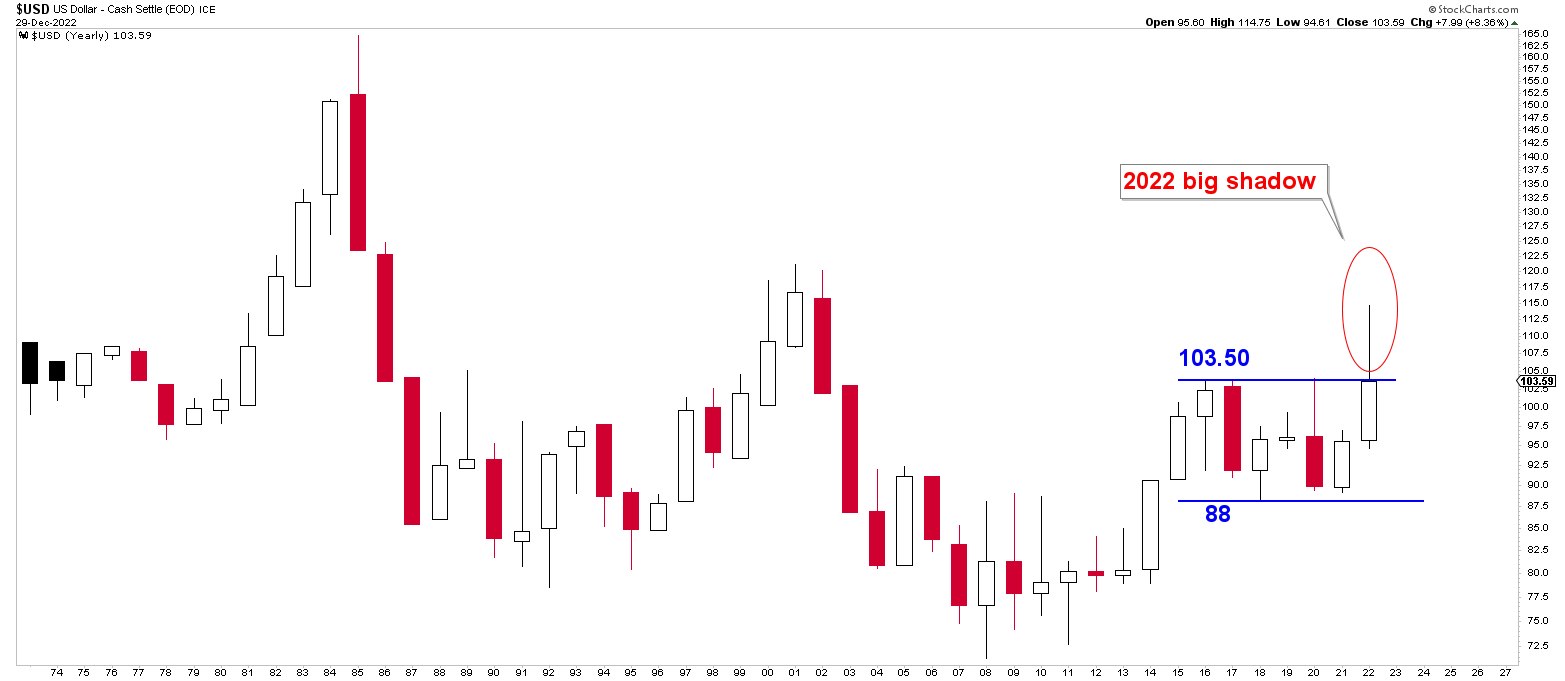
The following monthly chart illustrates the current state of the US dollar for better assessment. The year 2015 marked the breakout of the 37-year long-term trendline coming from 1985. This trendline was tested multiple times after the breakout denoted by the red arrow on the below chart. The US dollar index has been trading within the blue channel with a target of 114.50 since the 2015 breakout. The target was met in 2022, resulting in a precipitous decline in the value of the US dollar. The rapid decline in the US dollar index during the months of November and December, in my opinion, was intended to close the yearly candle within the defined range of 88 to 103.50, which produced bearish price behavior on the chart. In my opinion, the price will trade lower towards the blue channel at around 88-92 levels.
US Dollar Monthly (stockcharts.com)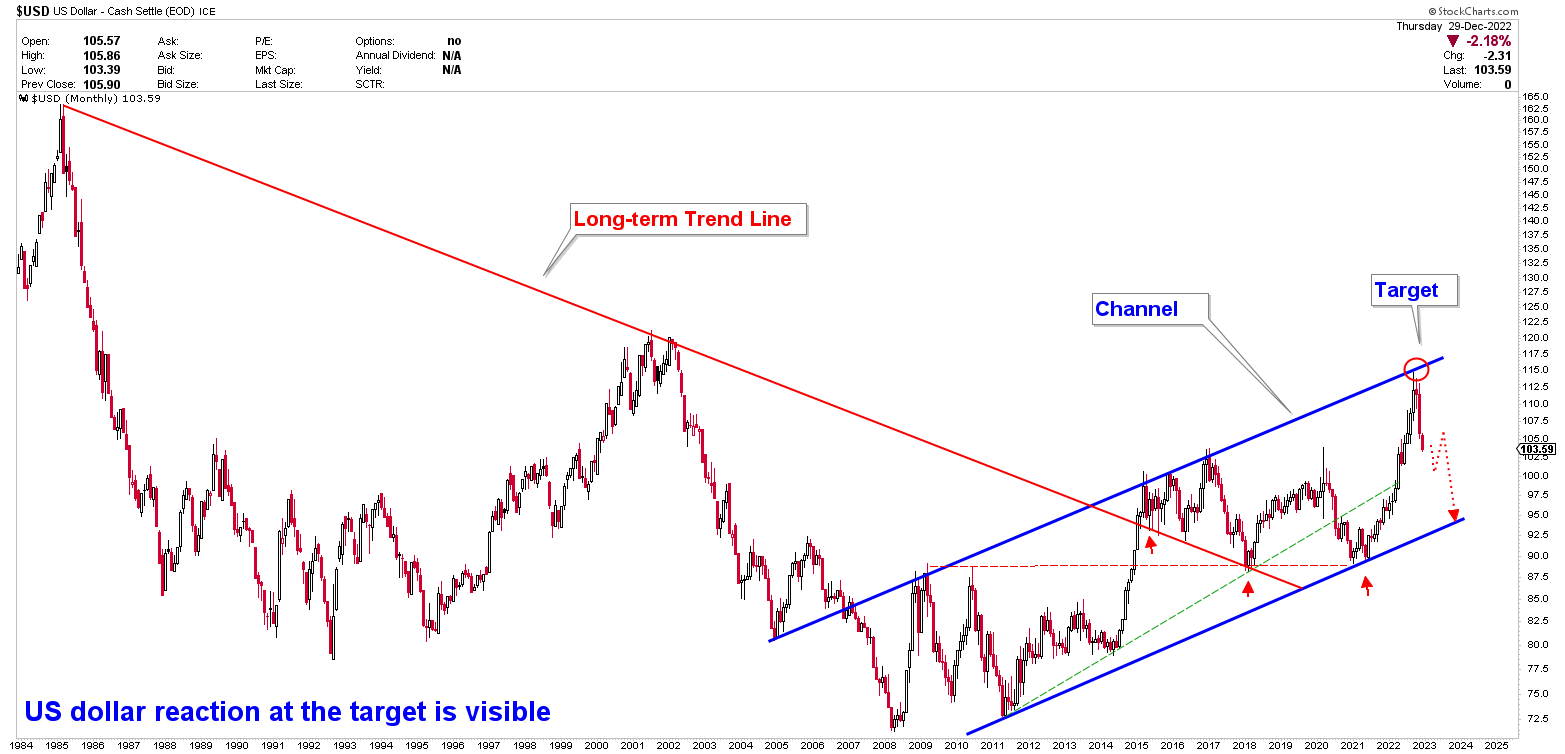
Current US dollar situation
Investigating the weekly chart for the US dollar index further simplifies the previous discussion. The weekly chart reveals the formation of a symmetrical broadening wedge, whereby the price reaches a significant target. The target is also validated on the monthly chart of the US dollar index. Ascending broadening wedge was formed on the chart after the decline from the target, which is typically a bearish pattern. Currently, the US dollar index is trading near the crucial support of the ascending broadening patterns; any breakout from this pattern would indicate a target range of 88 to 92. At the time of writing, there is a lot of empty space in the US dollar index; therefore short- and medium-term outlook is bearish, but the outlook for the long term will depend on the breakout from 88 levels.
US Dollar Weekly (stockcharts.com)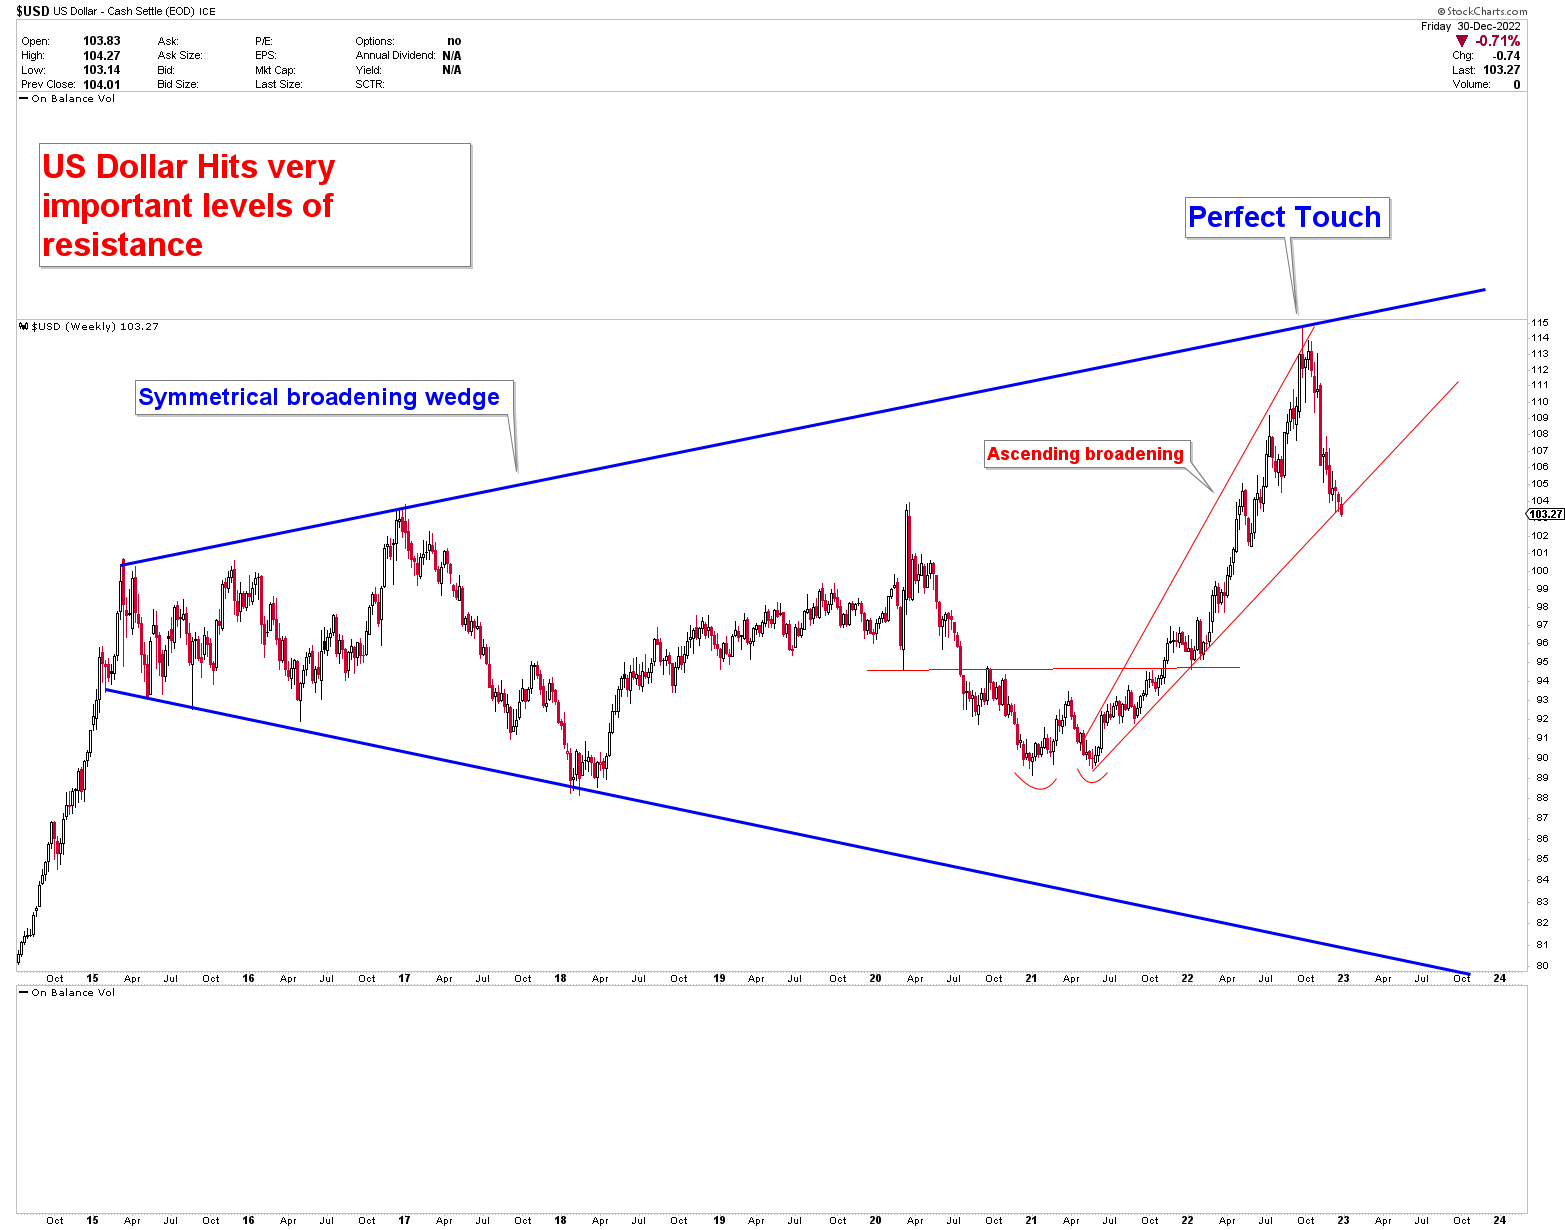
Conclusion
According to the above fundamental and technical analyses, the US economy is in trouble due to high debt, inflation, and interest rates. I think that the Fed will raise interest rates further in 2023 to combat inflation, which is currently out of control. It will take some time for the effects of higher interest rates to be reflected in the US economy, which will affect other global financial systems. When the US economy realizes that higher inflation is uncontrollable, the US dollar will be hurt. Technically, the US dollar has reached a significant target and is expected to decline in the medium term due to the development of symmetrical broadening wedge and ascending broadening formations. The ascending broadening wedge breaks at 102.50, therefore, a strong bounce from the 103.00 level might be seen in the US dollar index. A breakout from the ascending broadening wedge will target 88 levels in 2023. However, if the US dollar is to continue the long-term decline, a break below 88 will be required. On the basis of the preceding discussion, the US dollar index will begin in 2023 with a negative bias and investors have to consider selling the US dollar index after the breakout from ascending broadening wedge at 102.50.
Be the first to comment