Gam1983/iStock via Getty Images
“How does it feel like to be out of control?”
–John, 9 ½ Weeks, 1986
Far less salacious, much more significant. It has been more than thirteen years since capital markets have taken investors on such a tumultuous and grueling ride to the downside. But following the most recent sharp drop in mid-June, the latest bounce in the U.S. stock market is now underway. How much further should we reasonably expect this bounce to climb, and what are strategies that might consider employing along the way?
Lower highs, lower lows. Before going any further, it is important to clarify. We are now fully in the clutches of a new bear market. This isn’t your COVID-19 bear market from March 2020 that was effectively over almost immediately after it started. It’s not even the post Lehman Brothers variety from late 2008 and into early 2009. Both were undoubtedly traumatic with declines that were sharp and steep. But the key difference is that the U.S. Federal Reserve had unlimited policy flexibility to unleash the full power of easy monetary policy due to the outright deflation that was gripping the global economy during these past episodes.
Not so this time. Instead, the Fed is currently battling a blazing inflation. As a result, it has had to step up its monetary policy tightening at the same time that stocks are already falling. This bear market is going to take time to play out, and we’re likely still at the early stages of a long fight. Be fully prepared for lower highs and lower lows in fits and starts in the months if not year or two ahead.
Tech leaders continue to fade. A worthwhile place to begin examining the strength of this latest bounce is the NASDAQ Composite Index. Why? Because it is heavy in the formerly high-flying technology names that drove the broader U.S. stock market higher for so many years.
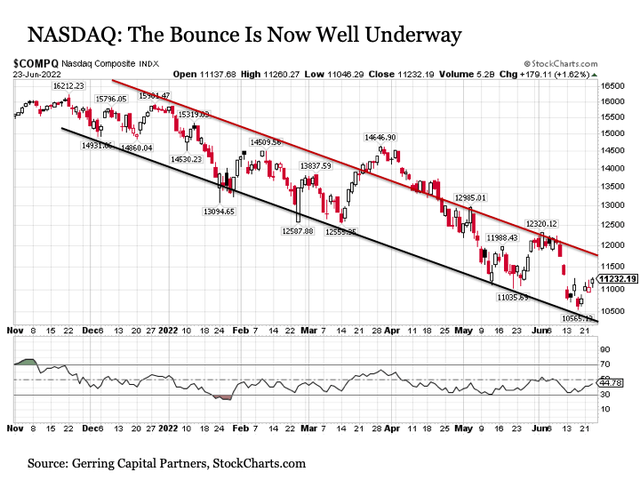
Here we see that technology stocks continue to oscillate in an orderly fashion within its downward sloping trading channel dating back to its pre-Thanksgiving highs. What is discouraging at first glance for investors still concentrated in tech is that the slope of this declining trading channel is so steep that any rally that might play itself out into early July is likely to end up peaking about -5% below levels from just a few weeks ago at the start of June. And with many of these tech stocks still trading at premium valuations and peak earnings even after what has been precipitous price declines already, very little relief appears to be in sight for tech shares anytime soon.
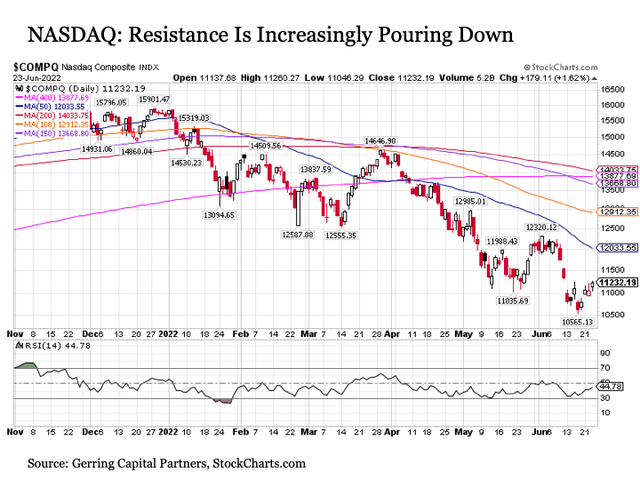
Building on the challenges confronting the NASDAQ in general and tech shares more specifically, we see that various moving average resistance lines are increasingly pouring down on the Index, which are likely to continue to press tech shares to the downside for the foreseeable future.
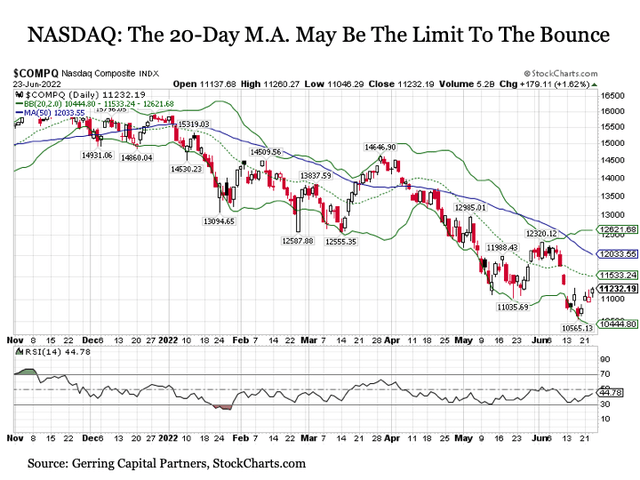
Moreover, when considering the short-term 20-day moving average (dotted green line in the chart above), we see that this alone has provided stiff resistance at many points throughout 2022. As a result, if this resistance asserts itself again in the latest rally, we may see no more than +2% to +3% further to the upside on the NASDAQ in this latest bounce before it turns its way back toward fresh new lows.
A modestly better picture for the broader market. Of course, for investors that are zero weighted to the information technology sector within their stock allocation, the fate of the broader market as measured by the S&P 500 Index is likely of greater interest (tech and tech adjacent stocks like Amazon (AMZN), Tesla (TSLA), Alphabet (GOOG)(GOOGL), and Meta Platforms (META) still make up over 35% of the S&P 500, which is still extraordinarily high by historical standards, so even the S&P 500 could be described as tech heavy nowadays – nonetheless it is a better measure of the broader market).
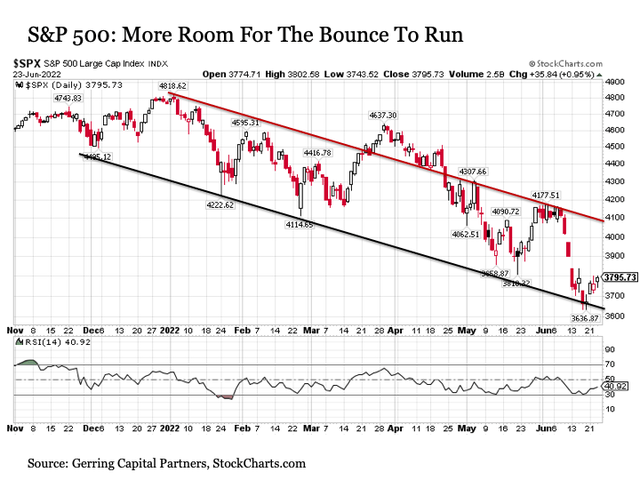
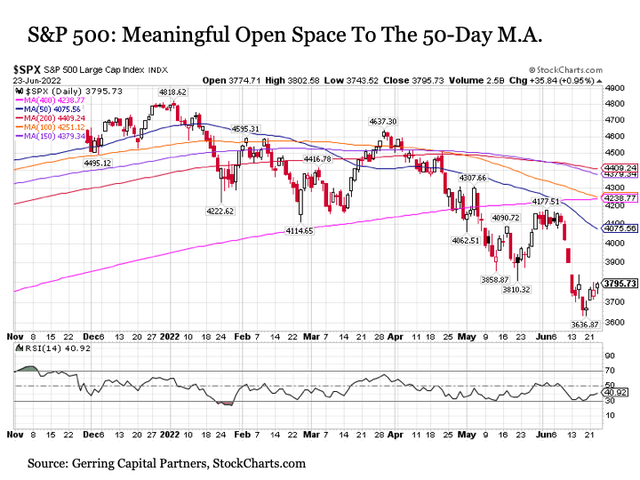
Here we see a bounce on the S&P 500 that is seemingly in a much earlier stage. The pessimist might look at the above chart and conclude that this latest bounce looks awfully tepid given the magnitude of the decline that preceded it. This is a downside risk that must be considered in the days and weeks ahead. But the more constructive view could reasonably conclude that more room remains for this latest bounce in the S&P 500 to run to the upside. This includes a short-term move back above 4000 that cannot be ruled out by this measure.
Of course, the same downward sloping moving average problem plaguing the NASDAQ is also confronting the S&P 500 as shown in the chart above. But the good news here on a short-term basis is that resistance at the 50-day moving average (blue line) still remains roughly +7% above current levels.
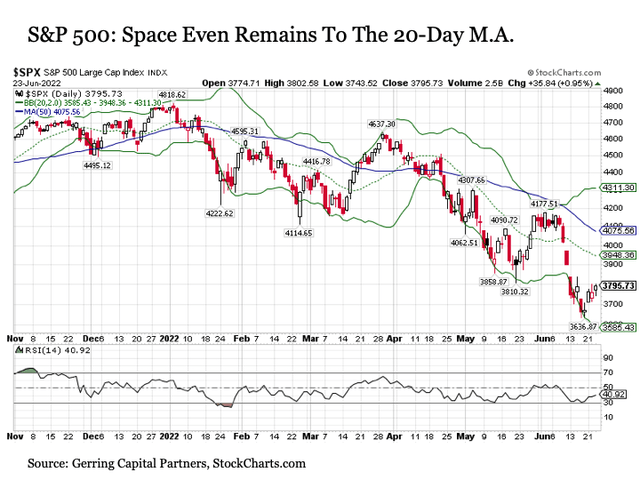
Even when considering the short-term 20-day moving average, which has proven far less resistance for the broader S&P 500 versus the NASDAQ in 2022, this still provides space for another roughly +4% to the upside before hitting this potential resistance level.
The potential for the S&P 500 to advance toward these two key resistance levels over the coming weeks is further supported by the Relative Strength Index (RSI) shown in the charts above. Given that it has reached 50 or above during past rallies, the fact that the RSI on the S&P 500 is just over 40 today suggests more upside room to move in the near term.
2 ½ weeks. So how much longer could we reasonably expect the S&P 500 Index to continue with its current short-term bounce before topping out? From a fundamental and economic perspective, markets have fairly clear sailing for the next two and a half weeks.
The second quarter of 2022 will draw to a close next week, so we should be prepared for the volatility that comes with the customary portfolio manager window dressing and deck chair shuffling that comes with the end of any quarter. We’ll get the latest reading on the Personal Consumption Expenditures Price Index (PCEPI), which is the Fed’s preferred reading for inflation, for the month of May on June 30, and this report might actually deliver some good news on the core inflation front for investors as they wrap up the quarter.
The start of the third quarter gets underway with a summer Friday trading day heading into a long Fourth of July weekend, and it is likely that many of the trader cats will be away much of the first full week of July for the holiday week. This brings us out to July 11 before things start to get dicey again.
Roughly two and a half weeks from today on Wednesday, July 13, we will get the latest reading on headline Consumer Price Index (CPI) inflation for the month of June. While the Core CPI reading might post another month of gradually lower inflation, the headline number is setting up to come in even hotter than May’s reading due in part to gasoline prices that surged through mid-June. Another even hotter headline inflation number is likely to rattle investor cages with the next FOMC meeting looming two weeks later during the last week of July.
Around the same time starting in the third week of July, second quarter earnings season will get underway in earnest. And while the numbers for 2022 Q2 may come in OK before it’s all said and done, what will be worth watching is the potential forecast outlook revisions by companies looking ahead to an economy that may be starting to slow markedly by the last few months of the year. I know many expert pundits are still proclaiming that a recession will be avoided, but I’m not sure we’re not already in one as I write today. Time will tell, but neither scenario is good for corporate profits and their associated margins.
Staying in control. While it may come to an end sooner, the latest bounce in the S&P 500 Index reasonably has a runway of about two and a half weeks through mid-July before it starts to hit some potentially heavy headwinds. As a result, investors are currently operating in a window where evaluating current stock allocations and adjusting long-term strategy if needed is warranted before the next spell of downside volatility takes hold.
In recent months, I have been of the view that the opportunity existed to potentially rotate out of stock market segments that were expected to lag in the months ahead and into those segments that had the potential to lead going forward. But given the suddenly more aggressive monetary policy turn by the Fed in opting toward 75 basis points at their June meeting and likely being pulled again toward another 75 basis points at their July meeting (the CME Fed Watch Tool currently has a more than 90% probability for a 75 basis point hike at their next meeting), my view has changed on the margins.
Put simply, I believe the Fed has turned far too hawkish, far too late at this stage. They never should have poured on so much stimulus during the COVID crisis, and they kept the spigots open full blast waaaaaaay too long after conditions had stabilized. If they had quit QE and started hiking rates much earlier, the opportunity would have existed to take a more gradual approach. Instead, the Fed is now going all in to fight a white-hot inflation problem that in reality has already been on the fade for the last few months outside of the more volatile food and energy headline components with an economy that is instead more likely fast tracking its way toward recession in the year ahead.
Given this more hawkish turn coupled with the economic outlook, I am instead inclined to look to use this latest bounce to trim stock allocations on the margins by either exiting or ideally taking profits on selected names. I continue to favor companies in the energy, pharmaceuticals, food, financials, and defense industries and will likely maintain an overweight to these segments, but I am not likely to add further to these existing allocations with the proceeds from any upcoming sales. Nor will I likely look to initiate allocations to new market segments in the near term. Instead, I am inclined to hold any near-term sale proceeds in cash at least for now.
Beyond stocks, I continue to favor allocations to long-term Treasuries (TLT), TIPS (TIP), and gold (PHYS) among other allocations along with a currently sizeable cash equivalent allocation held in ultra short-term bonds (JPST) as part of a broad asset allocation strategy.


Be the first to comment