enot-poloskun/E+ via Getty Images
By Anu Ganti
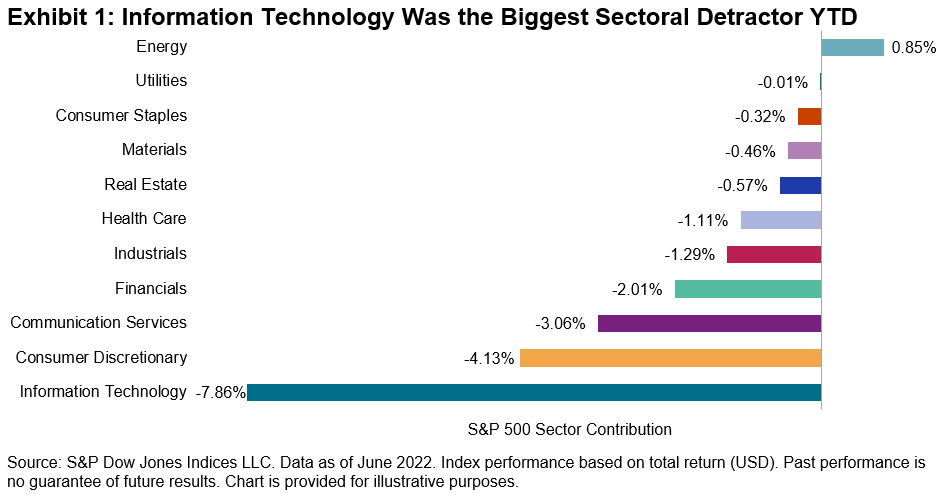
The S&P 500® posted its worst first-half performance since 1970,1 as inflation concerns, Fed rate hikes and slowing economic growth have weighed on markets. Mega caps were hit particularly hard, with the S&P 500 Top 50 posting a loss of 22%, underperforming the S&P 500 by 2%. Exhibit 1 shows that Information Technology was the biggest sectoral detractor from the S&P 500’s performance, followed by Consumer Discretionary and Communication Services. Energy was the sole positive contributor and the only sector to post a gain YTD, up 32%.
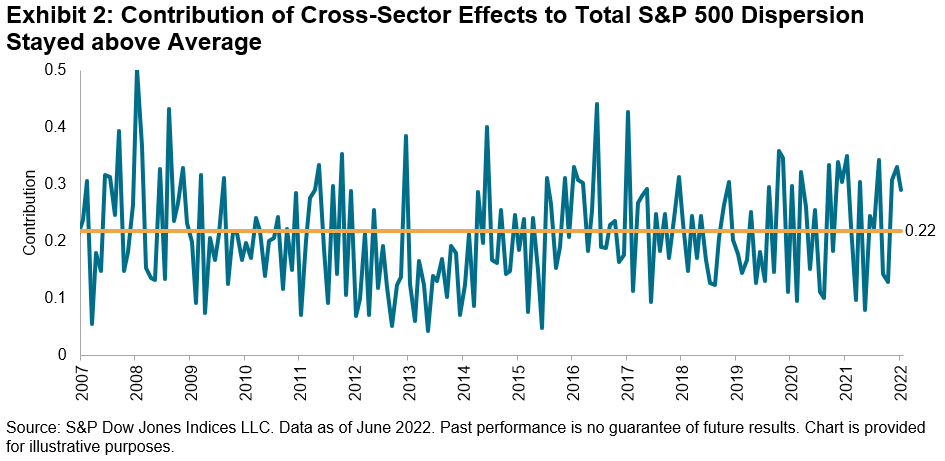
This market environment, characterized by higher volatility and wide disparity among sectoral performance, has positive implications for skillful sector allocators. To understand why, it is important to remember that volatility is linked to dispersion, which measures the spread among returns of an index’s components. When volatility goes up, dispersion also tends to rise, as the gap between the winners and losers widens. The greater the spread, the greater the opportunity to add value. Dispersion can be measured at various levels of granularity, such as among stocks or sectors.
Total market dispersion can be decomposed into the average dispersion within each sector and the dispersion across sectors. The ratio of cross-sector effects to total S&P 500 dispersion has remained above average, which implies that the rewards for skillful sector picks have been increasing (see Exhibit 2).
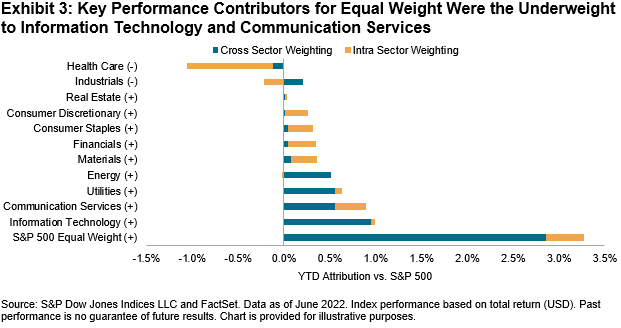
A natural consequence of the weakness among mega caps was a tailwind for Equal Weight because of its small-cap bias, with the index outperforming the S&P 500 by 3% so far this year. Exhibit 3’s YTD performance attribution of the S&P 500 Equal Weight Index illustrates that the underweight to IT and Communication Services were key contributors to Equal Weight’s outperformance.
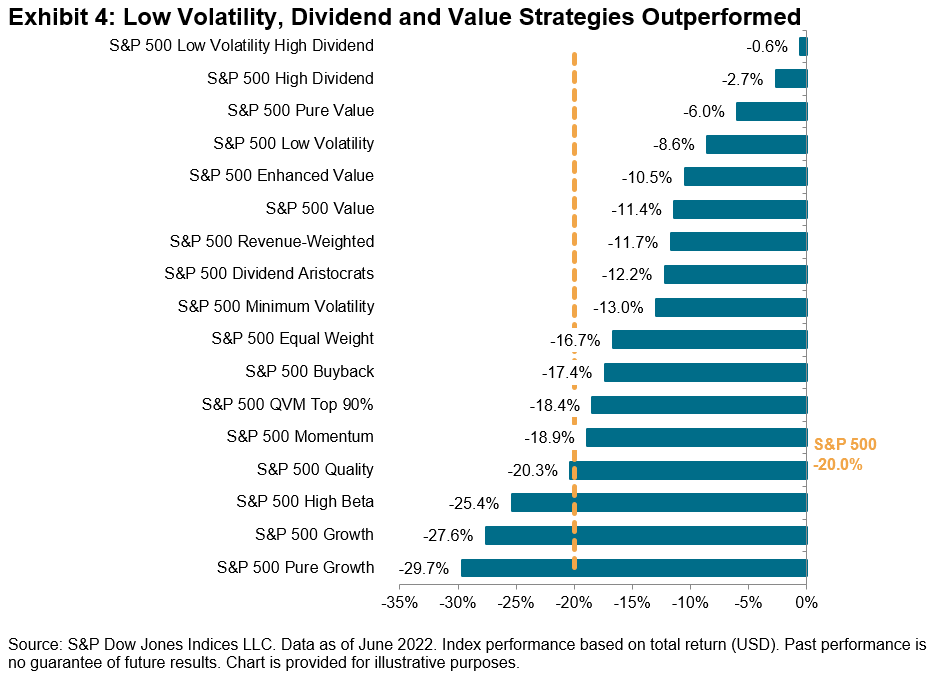
Another consequence of the outperformance of smaller caps is that most factor indices, which generally have a small-cap tilt, outperformed the S&P 500 (see Exhibit 4). Low Volatility and Dividend strategies took the lead, as factor performance was importantly influenced by the extraordinary outperformance of Value versus Growth.
The comeback of smaller caps and Equal Weight might have positive implications for active managers, as their portfolios are often closer to equal than cap weighted. Exhibit 5 plots the underperformance of large-cap funds compared to the relative performance of the S&P 500 Equal Weight Index versus the S&P 500, as a proxy measure for smaller-cap outperformance. We notice that two out of the three years when most active large-cap managers outperformed (2005, 2007 and 2009) coincided with Equal Weight’s outperformance.
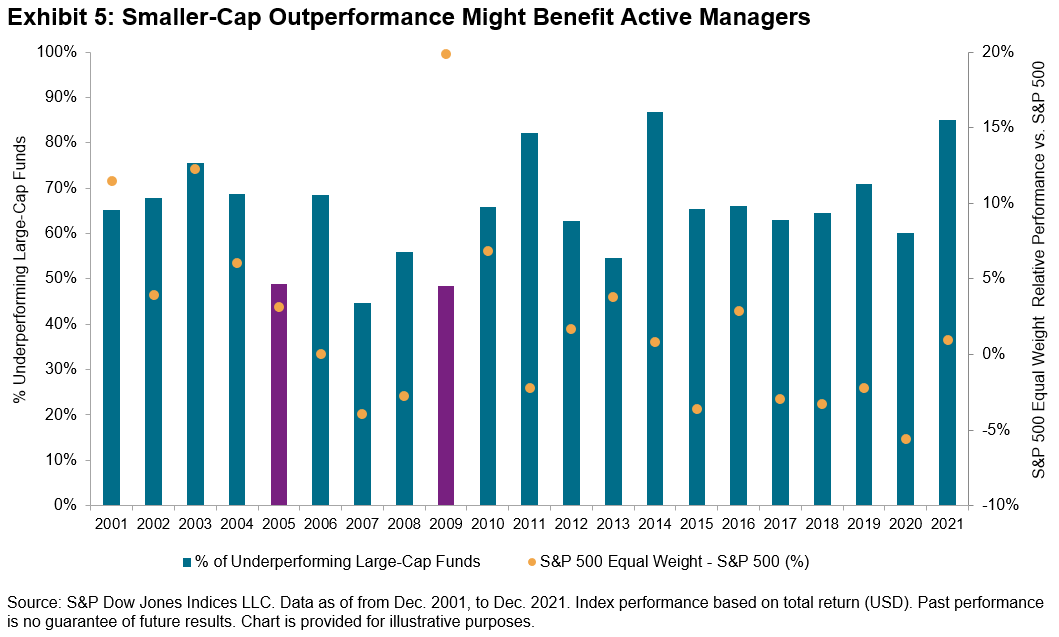
The current challenging environment, characterized by high inflation, concerns about potential Fed rate hikes and weak economic fundamentals, is reminiscent of 1970. That was the last time we experienced this level of underperformance for the first half of the year, which was subsequently followed by a strong turnaround in the second half of the year—an ultimate indicator that past performance is not indicative of future results.
1 Based on S&P 500 Price Return.
Disclosure: Copyright © 2022 S&P Dow Jones Indices LLC, a division of S&P Global. All rights reserved. This material is reproduced with the prior written consent of S&P DJI. For more information on S&P DJI please visit www.spdji.com. For full terms of use and disclosures please visit Terms of Use.
Editor’s Note: The summary bullets for this article were chosen by Seeking Alpha editors.


Be the first to comment