

valiantsin suprunovich/iStock via Getty Images
Today, we will be discussing yet another cash flow-focused investment vehicle with a note on the FCF US Quality ETF (BATS:TTAC), an actively managed fund with a basket of scrupulously selected stocks exhibiting quality characteristics.
The current iteration of the portfolio is tilted towards the mega-cap echelon, with the expensive IT being the primary sector. Exposure to mid-caps and value stocks is minimal. With an expense ratio of 59 bps, which, in fairness, does not look too elevated for an actively-managed ETF, the fund has a D Expense grade, principally because most index-tracking peers have much more comfortable cost structures.
I am of the opinion that TTAC is a Hold. Its performance has made a mixed impression, although alpha was achieved at times (i.e., over a one-year period). The quality of the portfolio (addressed below) is impeccable, but some cheaper passively managed FCF-focused funds like the Distillate Fundamental Stability & Value ETF (DSTL) have similar characteristics. Another issue is apparent overvaluation, with most holdings scoring poorly against the Quant Value grade metrics. This adds to risks amid a more hawkish stance of the Fed. In sum, its FCF-centered strategy is powerful, though not invincible.
Please take notice that FCF Advisors is the new name for TrimTabs Asset Management; the press release from 9 March 2022 contains more details on the change.
Investment strategy. Holdings. Factor exposure
According to the summary prospectus, its maximalist goal is to construct a portfolio of U.S. equities that would be capable of outperforming the Russell 3000 index while also not compromising on volatility.
The fund harnesses the power of its proprietary FCF model filtering out companies with lackluster profitability while also reducing exposure to those with poor ESG scores, as well as players that have concerning increases in share count and leverage.
Focus on proprietary measures of FCF has tilted the fund’s portfolio towards the tech sector, the one where lighter, less capital-intensive business models supportive of surfeit cash flows are omnipresent. Over 33% of its net assets, or 36 stocks out of 128, were allocated to IT as of March 30. We see the $1 trillion club members Apple (AAPL) and Microsoft (MSFT) occupying first and second positions, respectively, with a combined weight of around 9.6%.
The chart below demonstrates sector exposures of TTAC and IWV.
Created by the author using data from TTAC, IWV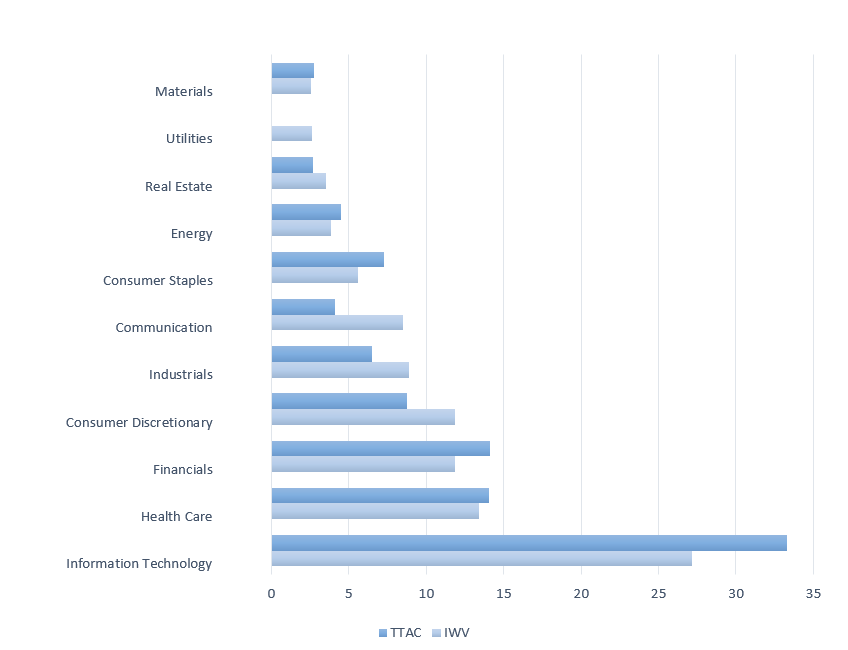
We see that compared to the Russell 3000 ETF, TTAC overweights the IT and financials, with exposure to consumer discretionary, industrials, and communication services reduced substantially. It is worth noting that traditionally asset-heavy business models of industrials that hamper most players from delivering stable FCF margins are likely the culprit of the sector being underrepresented. Besides, as of writing this article, the fund had no utilities in the portfolio.
It is not a mere coincidence that with such a substantial allocation to high-quality IT, TTAC has just ~12.6% invested in stocks with attractive multiples as measured using the Quant Valuation grade (B- or higher). Meanwhile, it is heavy in overpriced companies, with close to 59% of the net assets allocated to those with a D+ grade or worse. One of the examples is Visa (V), with a 0.6% weight.
Though I have become more optimistic about the richly priced growth names after the rough start to the year (the growth premia have become much slimmer across the board, promising upside in the absence of a harsh bearish catalyst), the overall expensiveness of the TTAC portfolio is still a risk not to be ignored.
Anyway, since I do not see large exposure to the growth factor, with just ~20% of the holdings sporting Growth grades above or equal to B- and over 55% deployed to those that have their revenues or earnings stagnating or contracting, I should conclude that the premium valuation of the portfolio is likely principally influenced by exceptional profitability.
There is no doubt that TTAC has grossly succeeded in its effort to whittle the investment universe down to the most resilient, remarkably profitable players. It should not go unnoticed that close to 96% of the portfolio has a Profitability grade of B- or better, with the A club accounting for ~89%. The fund favors mega-caps and trims mid-caps (~7% weight), and I believe this is one of the reasons for its portfolio having such impressive quality.
Delving deeper, I used the profitability data downloaded from the stock screener to check if there were any loss-making or cash-burning companies in the mix that somehow qualified for the basket. The results appeared to be overall encouraging. More specifically, the fund has only ~2.7% allocation to loss-making firms, namely Atlassian (TEAM), Palo Alto Networks (PANW), CrowdStrike (CRWD), and Box (BOX).
Though disappointing a bit, that is certainly not an issue at all since none of them are burning cash; contrarily, they have FCF margins ranging from 26% to 34%, as of my calculations. For example, thanks to diminutive capex, TEAM converts almost all of its net CFFO into FCF to Equity.
The scatter plot below is supposed to add more color to the quality analysis. The FCF margin was calculated by the author by multiplying revenues by the Capex/Sales ratio and then deducting the resulting figure from the net operating cash flow.
REITs and financials are removed. (Created by the author using data from Seeking Alpha, the fund, and companies’ filings)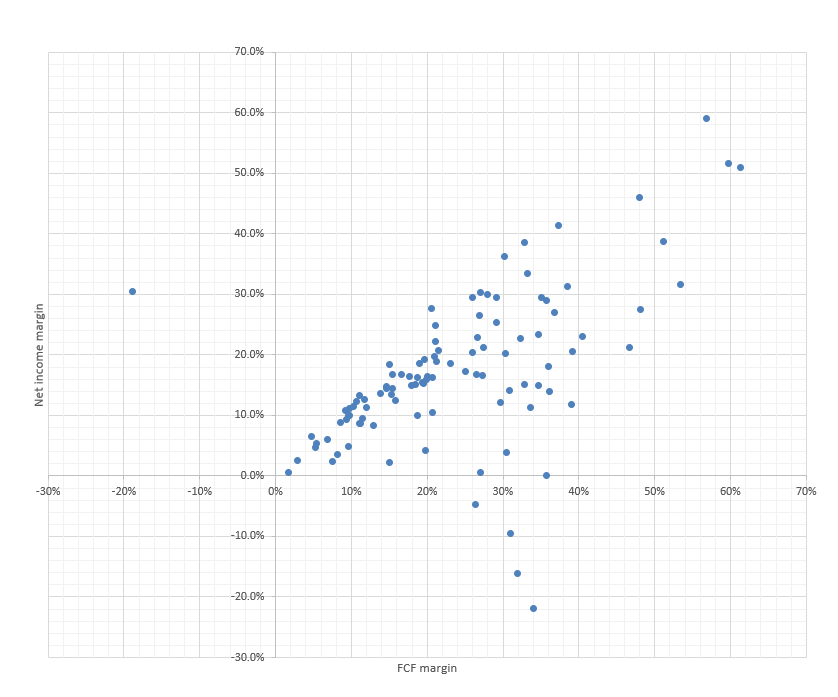
Close to 54% sports FCF margins in excess of or equal to 20%, which is nothing short of exemplary. Next, outside the financial sector and REITs, I found just one FCF-negative company, Continental Resources (CLR), an oil & gas company with a 0.5% weight in the portfolio.
Despite positive earnings, CLR’s free cash flow tumbled to below $(1) billion in 2021 as it increased its investment program steeply. More likely, CLR remains amongst TTAC’s investments since, with a forecast Forward EBITDA growth rate of ~52%, there is a high chance it will deliver a massive cash surplus this year on the back of surging oil prices.
Returns the strategy has been capable of delivering
This year, TTAC has delivered a total return in line with IWV, significantly lagging value-oriented peers Pacer US Cash Cows 100 ETF (COWZ) and AAM S&P 500 High Dividend Value ETF (SPDV); both incorporate measures of FCF into their strategies. DSTL has also been doing better.
Seeking Alpha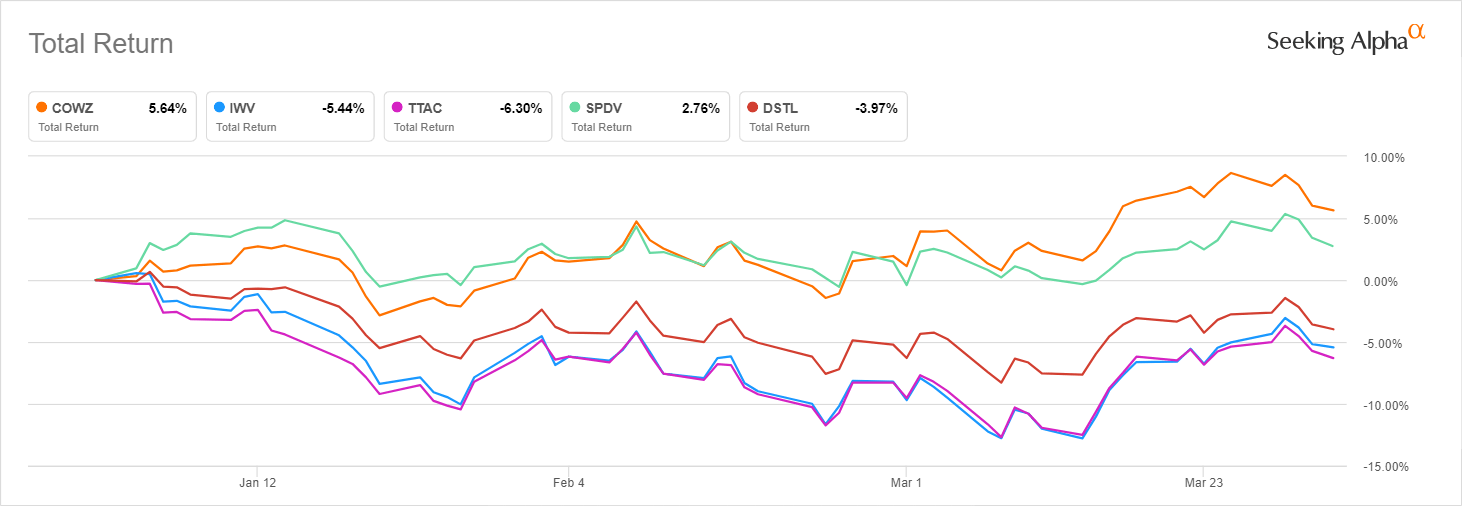
The one-year period is in favor of TTAC as it slightly outperformed the broad-market ETF. However, COWZ has outshined it.
Seeking Alpha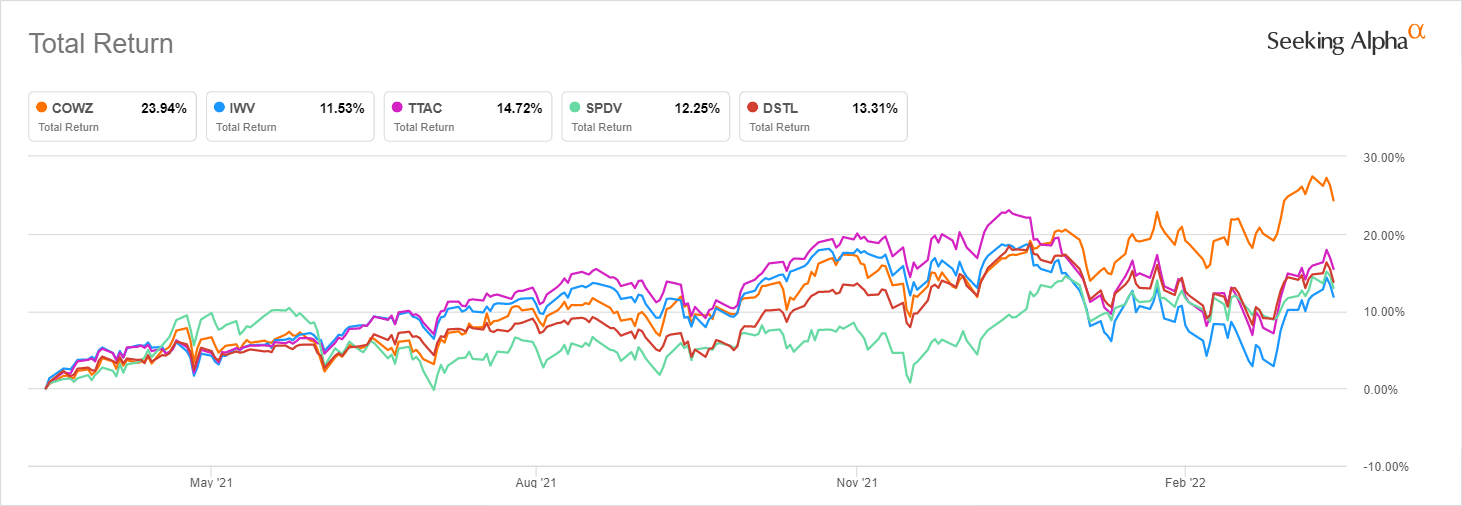
The 3-year period was a bit softer, with the fund lagging IWV marginally, though being well ahead of SPDV. COWZ’s total return was unrivaled once again.
Seeking Alpha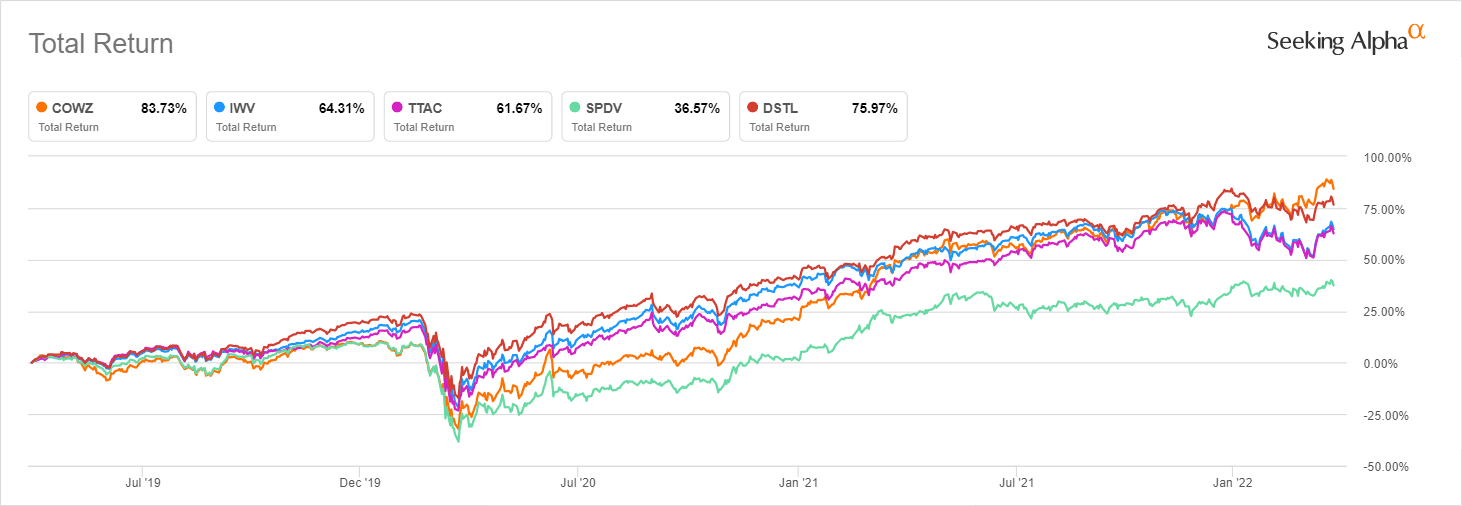
One of the factors that influenced SPDV’s weaker returns was the record stimulus provided to alleviate the economic effects of the coronavirus crisis; the rock-bottom interest rates supercharged 2020 IT/overpriced stocks rally while cheaper cyclicals failed to keep pace.
Conclusion
TTAC’s scrupulous stock selection based on the FCF model and ESG considerations delivered robust returns in the past, though alpha was achieved only at times. Its quality is close to perfect, but peers like DSTL and COWZ have similar amounts of the net assets allocated to grossly profitable companies, so TTAC is clearly not unique.
In sum, despite its advantages, TTAC is a Hold.
Be the first to comment