Brett_Hondow/iStock Editorial via Getty Images
Truist Financial (NYSE:TFC), the 6th largest U.S. bank by assets, is down by 12.7% over the past 12 months (not including dividends) and 22.4% below the 12-month high closing price of $67.41 on January 14th. TFC has a total 12-month return of -9.3%, as compared to -5% for the SPDR S&P Bank ETF (KBE) and -2.6% for the Invesco KBW Bank ETF (KBWB). TFC will report Q1 earnings on April 19, 2022.
Seeking Alpha
12-Month price history and basic statistics for TFC (Source: Seeking Alpha)
Even though rising interest rates tend to be good for banks by increasing interest income, the consensus earnings outlook for TFC is for lower earnings in 2022 than in 2021. Two sources of drag on expected earnings (see slide 27) in 2022 are reductions in mortgage-related income and in wealth management fees. The longer-term outlook is better, with a consensus that annualized EPS growth will be 10% per year over the next 3 to 5 years.
ETrade
Historical and estimated future quarterly EPS for TFC. Green (red) values are amounts by which EPS exceeded (lagged) the consensus estimated value (Source: ETrade)
TFC has a dividend yield of 3.64% and a 3-year dividend growth rate of 5.93% per year. For 2021, however, the dividend increased by only 3.3%.
A challenge in estimating outlooks for banks is interpreting soaring inflation and rising bond yield vs. the flattening (and even partially inverting) yield curve. Inverted yield curves have historically signaled a high probability of recession. Recessions correspond to falling inflation and, subsequently, reduced bond yields.
I last wrote about TFC on February 2, 2021 at which time I assigned a buy rating. The Wall Street consensus rating on TFC was bullish, with a 12-month price target that was 16.4% above the share price at that time. TFC looked fairly cheap, with a forward P/E of 12.1. In addition to looking at fundamentals and the Wall Street consensus outlook, I analyzed the prices of options on TFC to calculate the market-implied outlook, a probabilistic price return forecast that represents the consensus view among buyers and sellers of options. The market-implied outlook was bullish for the next couple of months, becoming neutral by the middle of 2022, and somewhat bearish to early 2022. I considered the strong bullish view from the Wall Street consensus and the cheap valuation to outweigh the moderately negative view to early 2023 from the options market in my final assessment. In the period since my post, TFC has returned a total of 9% vs. 17% for the S&P 500.
Seeking Alpha
Performance of TFC vs. the S&P 500 since my last analysis, on February 2, 2021 (Source: Seeking Alpha)
With slightly more than a year since my previous analysis, I have the market-implied outlook to early 2023 and I compare this with the current Wall Street consensus outlook, as in my previous analysis.
Wall Street Consensus Outlook for TFC
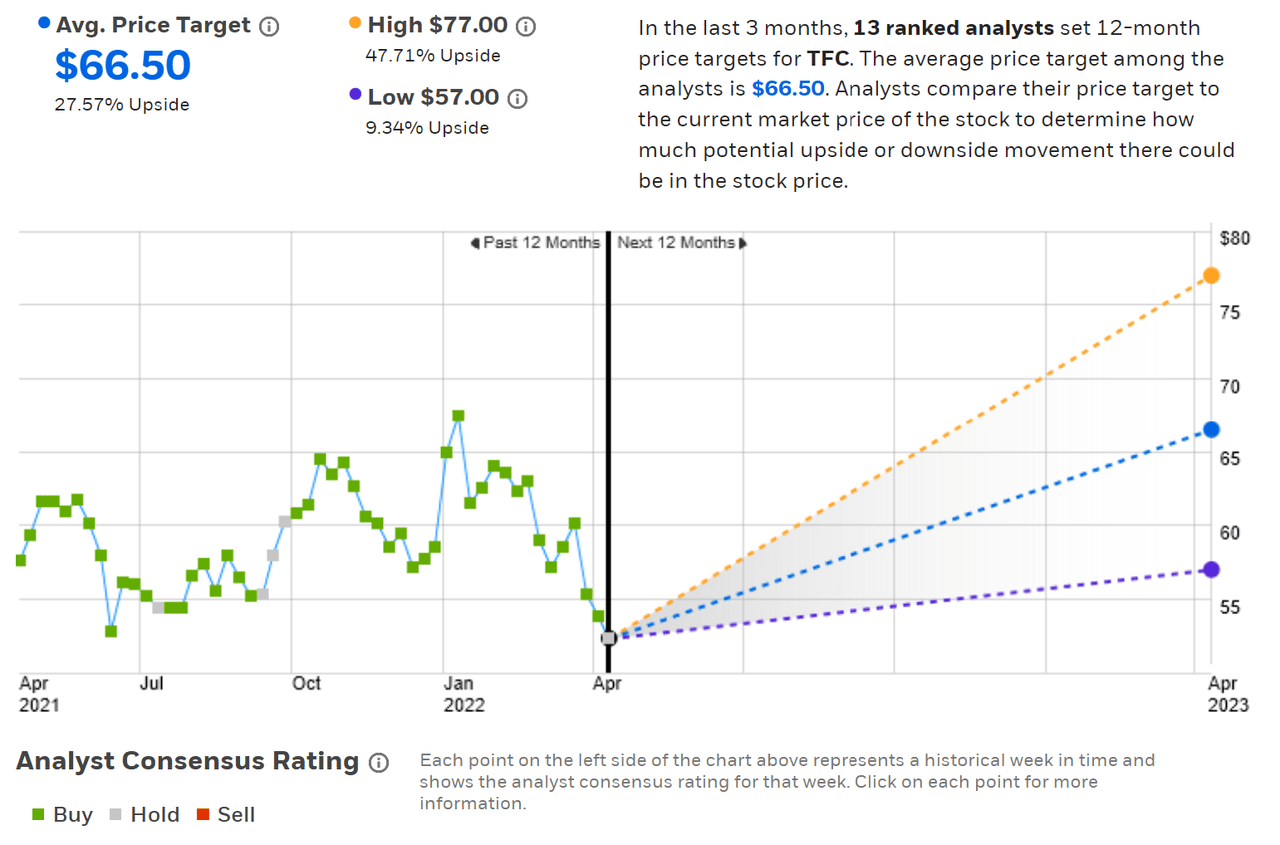
ETrade calculates the Wall Street consensus outlook for TFC by combining the views of 13 ranked analysts who have published ratings and price targets over the past 3 months. The consensus rating is neutral / hold, after having been bullish since the start of October of 2021. The consensus 12-month price target is 27.6% above the current share price. Even the lowest of the individual price targets is 10% above the current share price. It is somewhat hard to interpret the consensus when the rating is neutral but the 12-month price target implies such high returns.
ETrade
Wall Street consensus rating and 12-month price target for TFC (Source:ETrade)
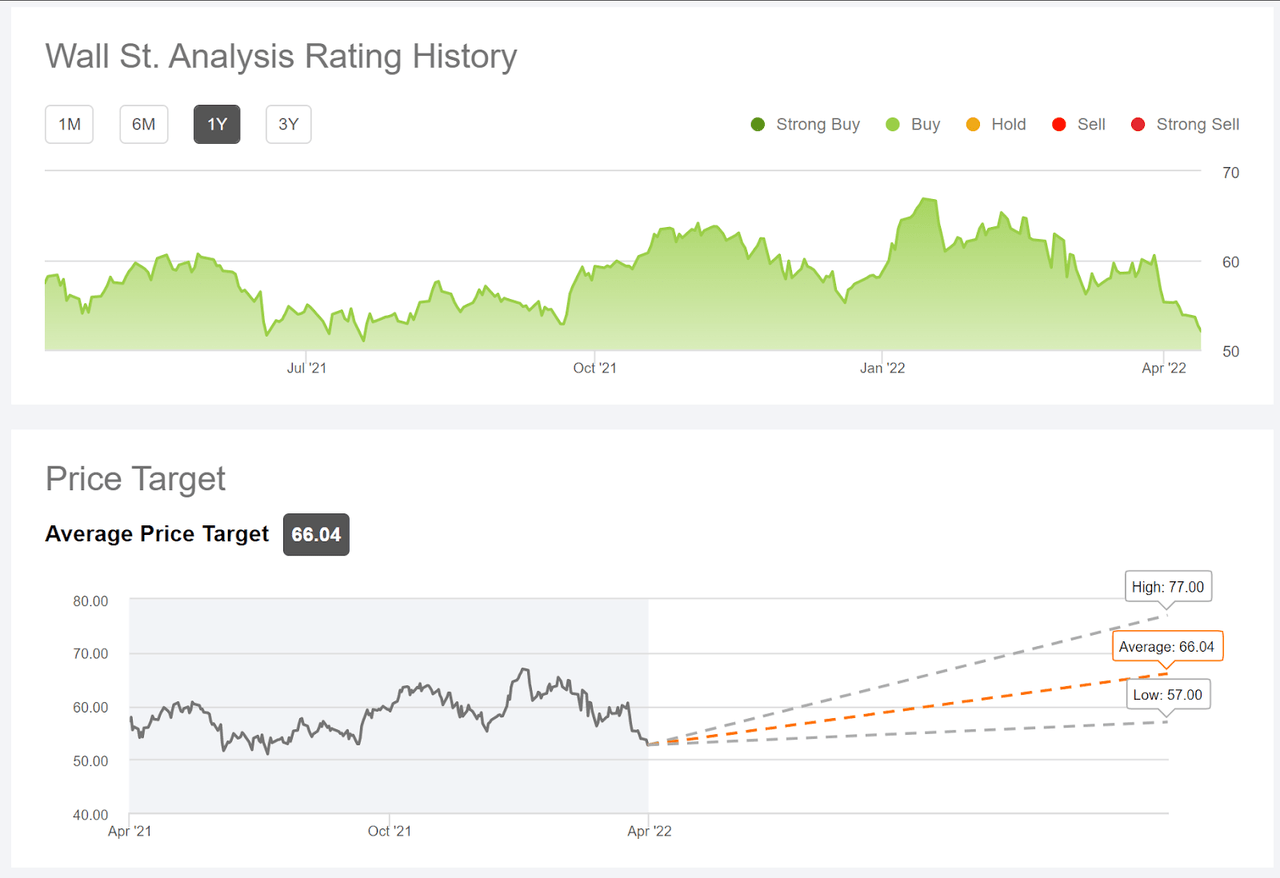
The Seeking Alpha version of the Wall Street consensus outlook is calculated using ratings and price targets from 24 analysts who have published their views over the past 90 days. The consensus rating is bullish and the consensus 12-month price target is 26.7% above the current share price. The lowest analyst price target is the same as in ETrade’s results.
Seeking Alpha
Wall Street consensus rating and 12-month price target for TFC (Source: Seeking Alpha)
These two versions of the consensus outlook have very similar 12-month price targets, but the ETrade rating has tilted neutral, while the Seeking Alpha consensus rating continues to be bullish. With the dividend, the expected total return from the consensus price target is 30.8% (averaging the ETrade and Seeking Alpha results).
Market-Implied Outlook for TFC
I have calculated the market-implied outlook for TFC for the 9.2-month period from now until January 20, 2023, using the prices of options that expire on this date. I selected this expiration date to provide a view through 2022 and the January expiration date was the closest to the end of the year. The options trading on TFC is fairly thin, which reduces confidence in the overall representativeness of the market-implied outlook.
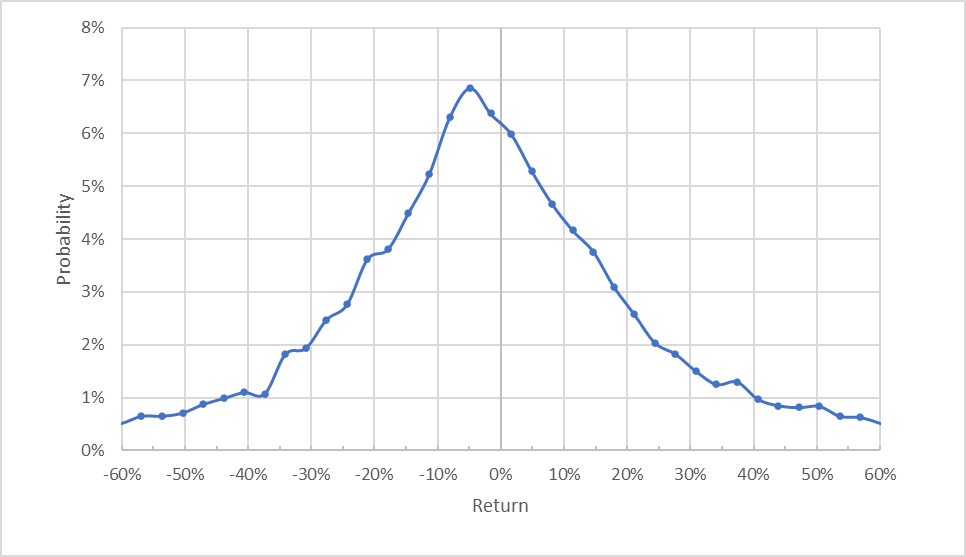
The standard presentation of the market-implied outlook is a probability distribution of price return, with probability on the vertical axis and return on the horizontal.
Geoff Considine
Market-implied price return probabilities for TFC for the 9.2-month period from now until January 20, 2023 (Source: Author’s calculations using options quotes from ETrade)
The market-implied outlook to January 20, 2023 is tilted to favor negative returns. The maximum probability corresponds to a price return of -4.9%. The median return is -2.6%. The expected volatility calculated from this distribution is 33% (annualized). For comparison, the expected volatility from the market-implied outlook calculated in February of 2021 was 37%.
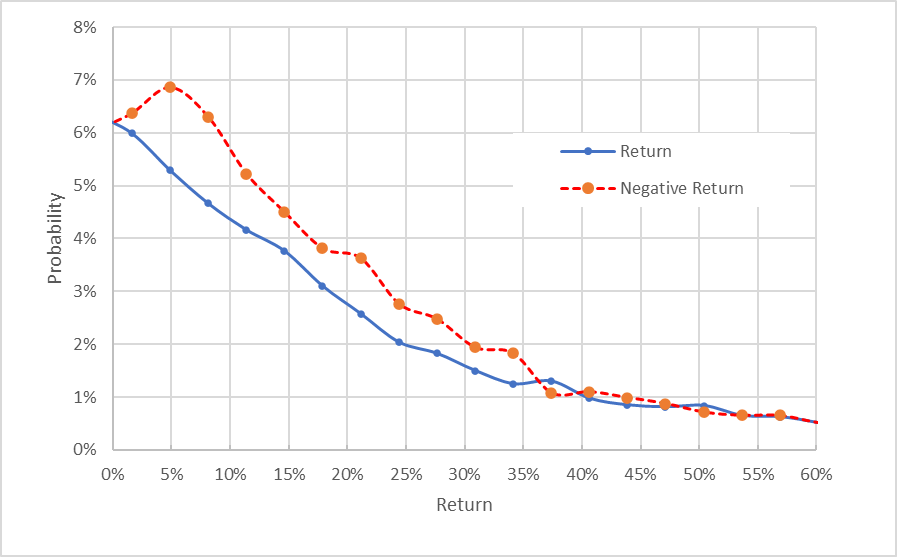
To make it easier to directly compare the probabilities of positive and negative returns, I rotate the negative return side of the distribution about the vertical axis (see chart below).
Geoff Considine
Market-implied price return probabilities for TFC for the 9.2-month period from now until January 20, 2023 (Source: Author’s calculations using options quotes from ETrade)
This view shows that the probabilities of negative returns are consistently higher than for positive returns across a wide range of the most probable outcomes (the dashed red line is above the solid blue line over the left ⅔ of the chart). This is a moderately bearish outlook for TFC to early 2023.
Theory suggests that the market-implied outlook will tend to be negatively biased because risk-averse investors tend to overpay for downside protection (e.g. put options). There is no way to determine if this bias is, in fact, present. With the expectation of a negative bias, the market-implied outlook is best interpreted as neutral to slightly bearish.
Summary
TFC has suffered a substantial decline in 2022, as the market has grappled with soaring inflation, a flattening yield curve, and geopolitical uncertainty. The Wall Street consensus outlook suggests that TFC is significantly oversold and that the market has overreacted to downward pressure on earnings. The Wall Street consensus rating is either bullish or neutral, depending on the source. The consensus 12-month price targets imply a total return of 30.8% over the next year. As a rule of thumb for a buy rating, I want to see an expected 12-month return that is at least ½ the expected volatility (33%). Taking the consensus 12-month price target at face value, TFC far exceeds this threshold. The market-implied outlook for TFC to early 2023 is neutral to slightly bearish, sounding a note of caution. With the substantial discount on the shares since the start of 2022, however, TFC looks like a decent bet even though banks face higher-than-normal uncertainties over the next year. I am maintaining my bullish rating on TFC.


Be the first to comment