

i_frontier/iStock via Getty Images
TransUnion (NYSE:TRU) is one of the big three credit reporting agencies in the world. It has an oligopoly status along with its main competitors, Equifax (EFX) and Experian (OTCQX:EXPGF). They have 31.8% market share right now. Their segments break down into US Markets, International, and Consumer Interactive. The biggest benefit of being in the credit reporting industry is the vast amounts of data it collects. The market for credit scores, credit reports, and credit check services is estimated to grow at 19.5% CAGR.
The company was founded in 1968 and went public in 2015. Below is the share price performance since IPO:
dividend channel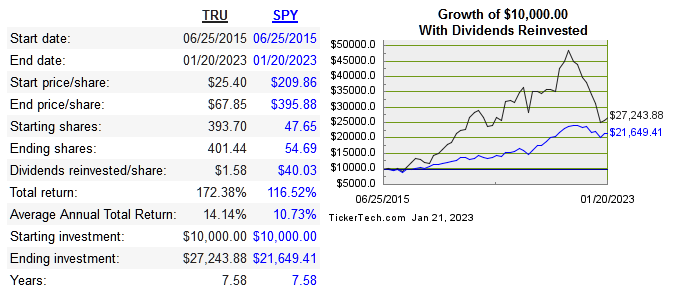
TRU is definitely part of an oligopoly, and this comes with pros and cons. The good part is more predictable earnings. The bad part is growth will have an inherent limit assuming one of the companies in the oligopoly tried to acquire or merge with one of their fellow competitors. In spite of the bad, holding a position like TRU does is very important for investors who are truly looking to hold stocks for more than a decade.
Below are the return metrics:
|
Company |
Revenue 10-Year CAGR |
Median 10-Year ROE |
Median 10-Year ROIC |
EPS 10-Year CAGR |
FCF/Share 10-Year CAGR |
|
TRU |
11.7% |
13.8 |
5.2 |
137.5* |
n/a |
|
10% |
17.1% |
9.2% |
12.3% |
n/a |
|
|
3.4% |
28.5% |
11.6 |
6.9% |
4.4% |
*6 year Source
Net income is temporarily high due to significant asset sales in 2021 and 2022.
Capital Allocation
Let’s take a look at the past decade’s operating profit, FCF, and where capital was allocated, in millions:
|
Year |
2013 |
2014 |
2015 |
2016 |
2017 |
2018 |
2019 |
2020 |
2021 |
2022 |
|
Operating Profit |
169 |
128 |
197 |
301 |
465 |
513 |
542 |
500 |
648 |
547 |
|
FCF |
62 |
-1 |
177 |
266 |
333 |
376 |
578 |
573 |
584 |
-44 |
|
Net Income |
-12 |
-35 |
-16 |
6 |
121 |
441 |
277 |
347 |
1,387 |
1.241 |
|
Acquisitions |
292 |
116 |
61 |
363 |
363 |
1,828 |
46 |
72 |
3,672 |
515 |
|
Dividends |
0 |
0 |
0 |
0 |
0 |
42 |
57 |
58 |
70 |
74 |
|
Repurchases |
0 |
3 |
0 |
0 |
1 |
134 |
0 |
0 |
0 |
0 |
|
Debt Repayment |
1,000 |
1,820 |
3,004 |
194 |
163 |
324 |
4,148 |
209 |
781 |
They grow largely through acquisition and have made 20 so far. Their biggest was the 2021 purchase of NueStar for $3.1 billion USD. This will continue as they grow, as well as the dividend. I always have a general preference for repurchases over dividends, so I don’t love the fact that dividends are the only form of capital being returned to shareholders.
Risk
At this point the biggest concern for me is the debt levels plus slower growth due to macro forces. Long term debt is currently $5.8 billion with $596 million in cash as well. This could come to haunt them if the economy starts to contract. They’ve been able to deleverage before and can do it again, but the addition of further debt is what would cause me the most concern.
Valuation
Shares are down 43% from their peak in 2021, but this doesn’t necessarily mean they have reached a price that can be considered a discount.
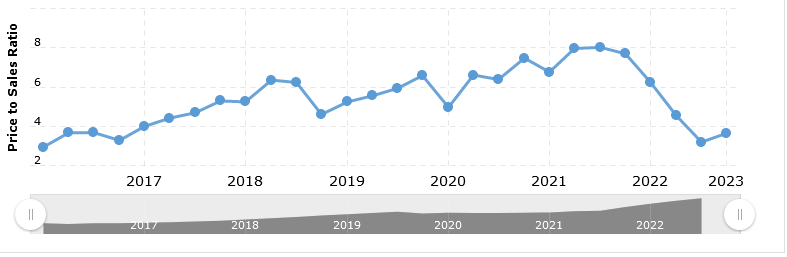
First we’ll compare the multiples, followed by historical multiples:
|
Company |
EV/Sales |
EV/EBITDA |
EV/FCF |
P/B |
Div Yield |
|
TRU |
5.2 |
17 |
-418 |
3.2 |
0.6% |
|
EFX |
6.1 |
18.8 |
149.5 |
7.2 |
0.7% |
|
EXPGF |
5.2 |
16.1 |
19.1 |
9.4 |
1.4% |
macrotrends macrotrends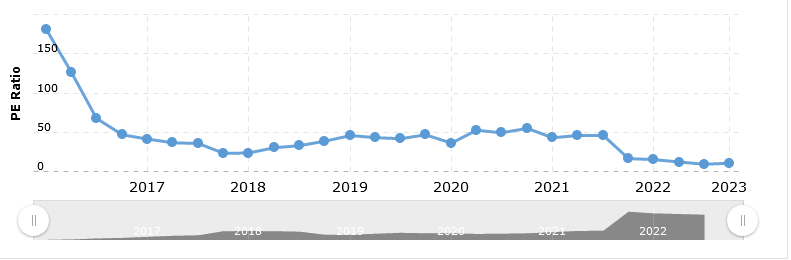
Next is the dcf model using 2020 earnings per share, as the recent asset sales have given earnings a temporary boost.
moneychimp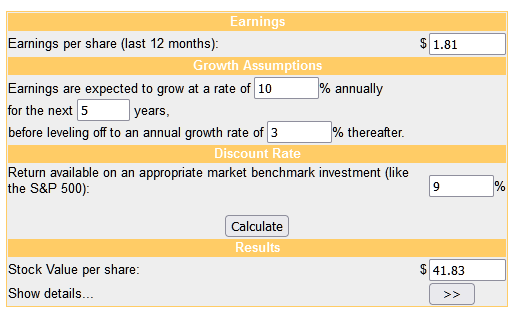
I expect revenue to continue growing at a double digit rate, but EPS probably won’t keep up at that rate much longer.
Conclusion
Fundamentally TRU has the makings of a very good long term investment. It holds oligopoly status in an above average growing industry. Prices did come down like so many others but that doesn’t guarantee that it is actually discounted. While it may appear cheap on a multiple basis, intrinsically I don’t think now is the right time to buy. The upside versus the risk that comes in the form of macro uncertainty and large debt levels is just not worth it right now.
Be the first to comment