

We Are
Operating Earnings calculated by S&P Global (SPGI), Street Earnings[1], and GAAP Earnings overstate the true profitability of S&P 500 (SPY) companies. Entering earnings season for calendar 2Q22 our proprietary Core Earnings[2] measure continues to provide a more accurate measurement of profitability for the S&P 500. Using overstated earnings metrics leads investors to understate risk, a fact that has been on grotesque display in equity markets recently.
Traditional Earnings Overstate the True Profits of the Market
In the trailing-twelve-months (TTM) ended 1Q22:
- Operating Earnings are 5% higher than Core Earnings,
- Street Earnings are 10% higher than Core Earnings, and
- GAAP Earnings are 4% higher than Core Earnings.
Economic Earnings, which account for the cost of capital and changes to company balance sheets, are 46% below Core Earnings. However, this gap is the smallest difference dating back to 2012.
Figure 1: Operating vs. Street vs. GAAP vs. Core vs. Economic Earnings: S&P 500 Since 2017
Core Earnings vs. Traditional Earnings Measures (New Constructs, LLC)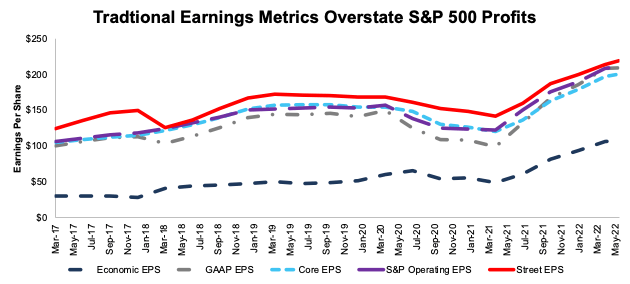
Sources: New Constructs, LLC, company filings, and S&P Global. Note: the most recent period’s data for SPGI’s Operating Earnings is based on consensus estimates for companies with a non-standard fiscal year.
Below we highlight the disconnect between traditional earnings measures and our Core Earnings, and specifically examine the changes in each metric over the past few years. Core Earnings account for unusual gains/losses buried in footnotes that legacy datasets fail to capture.
Street Earnings Overstate S&P 500 Profits
Street Earnings undersold the drop in profits in 2020 and made the rebound in profitability in 2021 look less robust than it actually was. In 2020, Street Earnings fell 16% year-over-year (YoY) while Core Earnings fell 22% YoY.
For 2021 versus 2020:
- Street Earnings improved from $141.70/share to $213.99/share, or 51%
- Core Earnings improved from $120.05/share to $197.10/share, or 64%.
In the TTM ended 1Q22, Street Earnings are 10% higher than Core Earnings, though Core Earnings improved at a faster pace, rising 47% YoY, compared to Street Earnings, which rose 37% YoY.
Figure 2: Trailing Twelve Month Earnings: Core Earnings vs. Street Earnings: 4Q19 –1Q22
Core Earnings Vs. Street Earnings S&P 500 (New Constructs, LLC)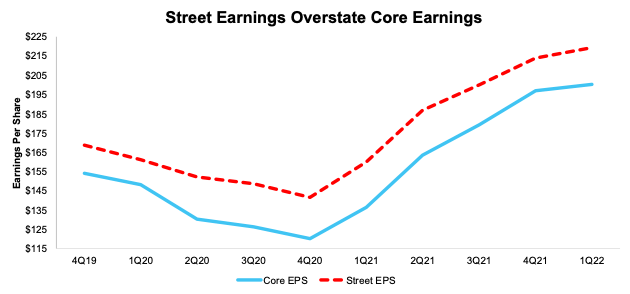
Sources: New Constructs, LLC, company filings, and Zacks Earnings
S&P Global’s Earnings Rebound Is Overstated
In 2021, S&P 500 company profits did not rebound as much as SPGI’s Operating Earnings lead investors to believe. For 2021 versus 2020:
- SPGI’s Operating Earnings improved from $122.37/share to $208.21/share, or 70%
- Core Earnings improved from $120.05/share to $197.10/share, just 64%.
In the TTM ended 1Q22, Operating Earnings are 5% higher than Core Earnings, though Core Earnings improved at a faster pace, rising 47% YoY, compared to Operating Earnings, which rose 40% YoY.
Figure 3: Trailing Twelve Month Earnings: Core Earnings vs. SPGI Operating Earnings: 4Q19 –1Q22
Core Earnings Vs. Operating Earnings S&P 500 (New Constructs, LLC)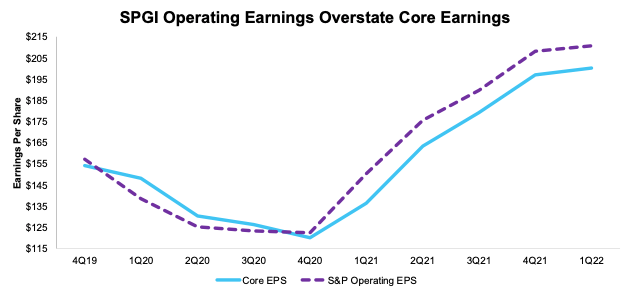
Sources: New Constructs, LLC, company filings, and S&P Global. Note: the most recent period’s data for SPGI’s Operating Earnings is based on consensus estimates for companies with a non-standard fiscal year.
Core Earnings Are More Reliable Than GAAP Earnings
Since 2020, corporate profits did not decline or rebound as much as GAAP earnings indicate. For instance:
- In 2020, GAAP earnings fell 34% YoY compared to a 22% fall for Core Earnings.
- In 2021, GAAP earnings rose 110% YoY compared to a 64% rise for Core Earnings.
- In the TTM ended 1Q22, GAAP earnings rose 58% YoY compared to a 47% rise for Core Earnings.
Figure 4: Trailing Twelve Month Earnings: GAAP Earnings vs. Street Earnings: 4Q19 –1Q22
Core Earnings Vs. GAAP Earnings S&P 500 (New Constructs, LLC)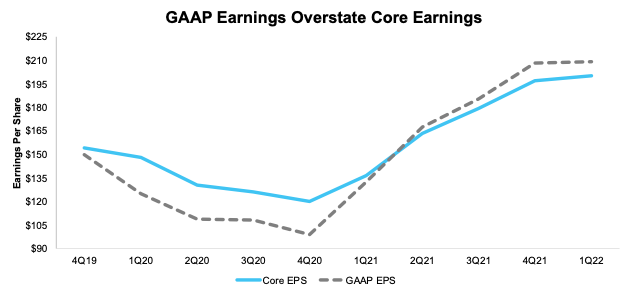
Sources: New Constructs, LLC and company filings
Diligence Matters – Superior Fundamental Analysis Provides Insights
As traditional earnings measures continue to overstate the S&P 500’s Core Earnings, the index requires growing investor optimism about future profits just to maintain valuations and stop price declines. Based on warnings from companies willing to face reality, and the disconnect between Core Earnings, Operating Earnings, and Street Earnings, investors can expect more companies warning about slowing earnings growth or even outright decline in coming quarters.
This article originally published on July 25, 2022.
Disclosure: David Trainer, Kyle Guske II, Matt Shuler, and Brian Pellegrini receive no compensation to write about any specific stock, style, or theme.
Appendix I: Core Earnings Methodology
In the Figures above, we use the following to calculate Core Earnings:
- aggregated quarterly data for constituents in the S&P 500 for each measurement period post 6/30/13 to the present
[1] Street Earnings refer to Zacks Earnings, which are adjusted to remove non-recurring items using standardized sell-side assumptions.
[2] Our Core Earnings research is based on the latest audited financial data, which is the calendar 1Q22 10-Q in most cases.
Be the first to comment