Joe Raedle
FedEx (NYSE:FDX) reported awful results for Q1 of FY 2023 on September 22, 2022, with EPS of $3.44 vs. the consensus expected value of $5.14. On September 15th, prior to the official earnings, the company reported preliminary results and the shares dropped by 21%. Management emphasized ongoing cost-cutting measures and a focus on increasing overall efficiency of operations and withdrew FY 2023 earnings guidance. Management also reaffirmed the plan to repurchase $1.5 Billion in shares for FY 2023, however. In early October, in a memo sent to independent contractors who manage deliveries, the company reduced its forecast for holiday shipping volumes (also see here). When media outlets reported the contents of this memo, the shares dropped by 2.7% in response. The overall sense is that the company is focusing on costs and efficiency because management sees very limited potential for revenue growth.
FDX has returned a total (including dividends) of -36.9% for the YTD, as compared to -24.6% for the freight and logistics industry group as a whole (as defined and tracked by Morningstar). It is worth noting that the FDX has substantially underperformed the industry and the U.S. equity market over the past 3-, 5-, 10-, and 15-year periods.
Seeking Alpha
12-Month price history and basic statistics for FDX (Source: Seeking Alpha)
With the Fed focused on slowing down inflation by raising interest rates, and consequent concerns about slowing growth or even a recession, the potential for further reductions in shipping volume is quite clear. This is reflected in the consensus outlook for earnings in the coming quarters, with Q2, Q3, and Q4 of FY 2023 expected EPS values substantially below the results from last year. It is worth noting, however, that the estimated EPS growth over the next 3 to 5 years is 8% per year (annualized).
ETrade
Historical (3 years) and estimated future quarterly EPS for FDX. Green (red) values are amounts by which EPS beat (missed) the consensus expected value (Source: ETrade)
At the current levels, the question is whether the current share price fully reflects the downside potential from an economic slowdown. While the P/E is low compared to recent years, the expectations for growth are also low. With management not providing earnings guidance for FY 2023, what are reasonable ways to form an opinion? I look at two forms of consensus outlooks. The first is the well-known Wall Street analyst consensus. The second is the market-implied outlook, a probabilistic price forecast that represents the consensus view among buyers and sellers of options.
For readers who are unfamiliar with the market-implied outlook, a brief explanation is needed. The price of an option on a stock is largely determined by the market’s consensus estimate of the probability that the stock price will rise above (call option) or fall below (put option) a specific level (the option strike price) between now and when the option expires. By analyzing the prices of call and put options at a range of strike prices, all with the same expiration date, it is possible to calculate a probabilistic price forecast that reconciles the options prices. This is the market-implied outlook. For a deeper explanation and background, I recommend this monograph published by the CFA Institute.
Wall Street Consensus Outlook for FDX
Etrade calculates the Wall Street consensus outlook for FDX by aggregating the views of 20 ranked analysts who have published ratings and price targets over the past 3 months. The consensus rating is a buy and the consensus 12-month price target is 25% above the current share price. There are two reasons to be skeptical with regard to this outlook. First, the consensus rating has been a buy for all of the past 12 months, indicating that the analysts may be missing something important in their outlooks. Second, the dispersion in the individual analyst price targets is very high. Research has found that the consensus price target has predictive value only when the spread in the individual price targets is fairly low. The authors find a negative correlation between the consensus price target and subsequent returns when the dispersion among individual price targets is high. In other words, a high implied return from the consensus with high dispersion in individual analyst opinions is actually a bearish indicator. As a rule of thumb for discounting the predictive value of the consensus, I look at the ratio of the lowest and highest price targets. When this ratio exceeds 2, I strongly discount the meaningfulness of the consensus. For FDX, this ratio is 2.6 ($325/$125).
ETrade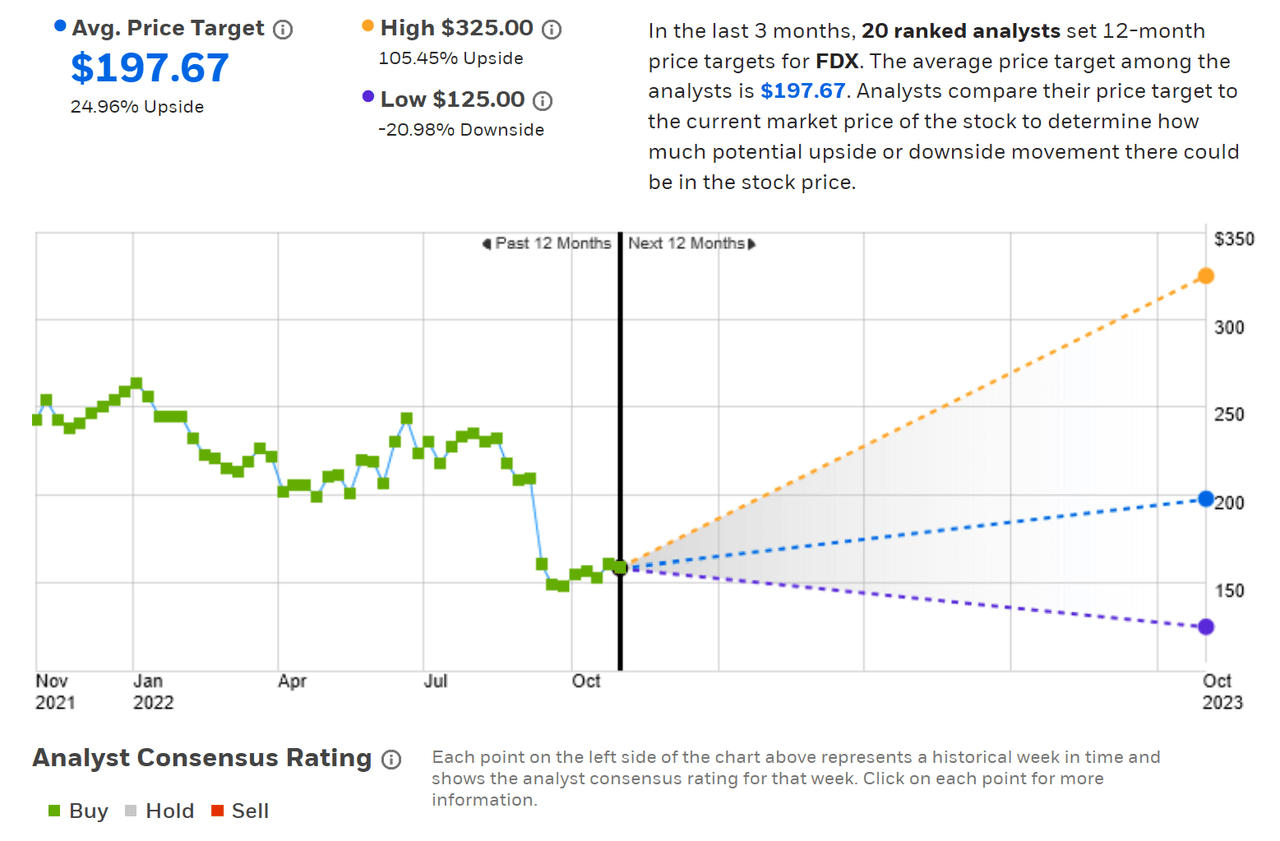
Wall Street analyst consensus rating and 12-month price target for FDX (Source: ETrade)
Seeking Alpha’s version of the Wall Street consensus outlook is calculated using ratings and price targets from 31 analysts who have published their views in the past 90 days. The consensus rating is a buy and the consensus 12-month price target is 23.6% above the current share price. Seeking Alpha shows that the consensus rating for FDX has been a buy for all of the past 3 years. The dispersion among the individual price targets is similar to the result from ETrade, with a ratio of 2.36 between the highest and lowest values.
Seeking Alpha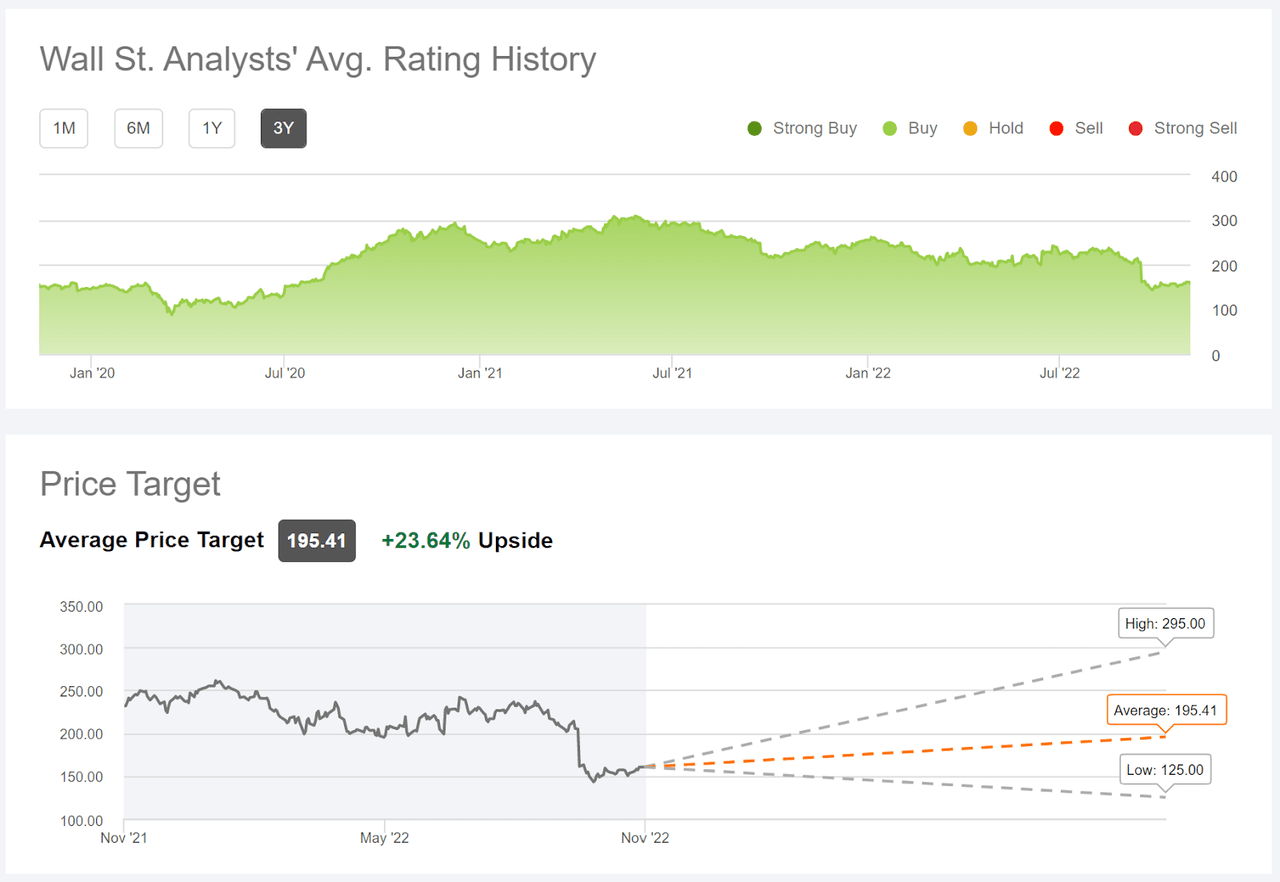
Wall Street analyst consensus rating and 12-month price target for FDX (Source: Seeking Alpha)
There are cases in which the analysts, as a group, appear to be missing some crucial element in forming their opinions. With FDX’s total return over the past 3 years having barely exceeded the dividend and 5-year annualized total return of -5% per year, there appears to be some disconnect between market expectations and the prevailing view among the analysts. In addition, the high level of spread among the individual analysts is a significant concern.
Market-Implied Outlook for FDX
I have calculated the market-implied outlook for FDX for the 2.6-month period from now until January 20, 2023, and for the 7.4-month period from now until June 16, 2023, using the prices of call and put options that expire on these dates. I selected these two expiration dates to provide a view through the end of 2022 and to the middle of 2023.
The standard presentation of the market-implied outlook is a probability distribution of price return, with probability on the vertical axis and return on the horizontal.
Geoff Considine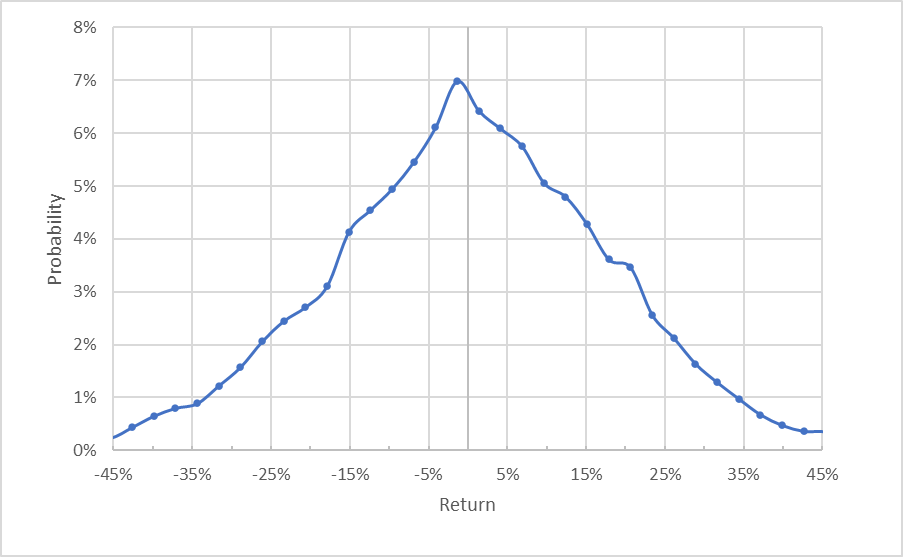
Market-implied price return probabilities for FDX for the 2.6-month period from now until January 20, 2023 (Source: Author’s calculations using options quotes from ETrade)
The market-implied outlook for the next 2.6 months is quite symmetric, with comparable probabilities for positive and negative returns of the same magnitude. The peak in probability is slightly tilted to favor negative returns, with the maximum probability corresponding to a price return of -1.3%. This is not a large enough shift to be considered meaningful. The expected volatility calculated from this distribution is 38.1% (annualized). ETrade calculates 38% implied volatility for the options expiring in January. To make this level of volatility more concrete, the estimated 10th percentile return from the market-implied outlook is -23.6%.
To make it easier to compare the relative probabilities of positive and negative returns, I rotate the negative return side of the distribution about the vertical axis (see chart below).
Geoff Considine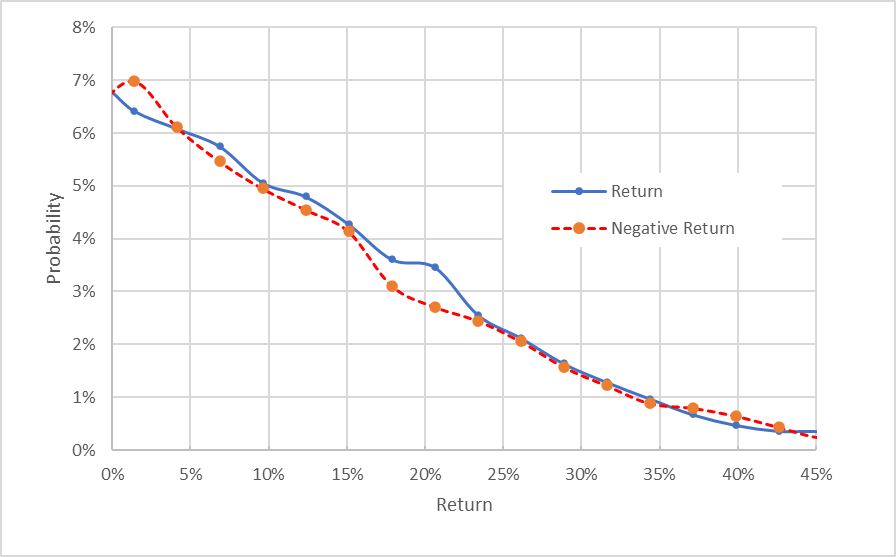
Market-implied price return probabilities for FDX for the 2.6-month period from now until January 20, 2023. The negative return side of the distribution has been rotated about the vertical axis (Source: Author’s calculations using options quotes from ETrade)
This view shows how closely the probabilities of positive and negative returns match (the solid blue line and the dashed red line tend to be on top of one another), although there is a small but persistent tendency for the probability of positive returns to be slightly higher. This would be interpreted as a very slight bullish tilt in the outlook.
Theory indicates that the market-implied outlook is expected to have a negative bias because investors, in aggregate, are risk averse and thus tend to pay more than fair value for downside protection. There is no way to measure the magnitude of this bias, or whether it is even present, however. The expectation of a negative bias reinforces the interpretation of this outlook as very slightly bullish.
The market-implied outlook for the 7.4-month period from now until June 16, 2023, also shows closely-matching probabilities for positive and negative returns. The expected volatility over this longer period is 38% (annualized). Considering the expected negative bias, I interpret this outlook as neutral to very slightly bullish because the difference in probabilities of positive and negative returns is even smaller in this case than for the shorter-term outlook.
Geoff Considine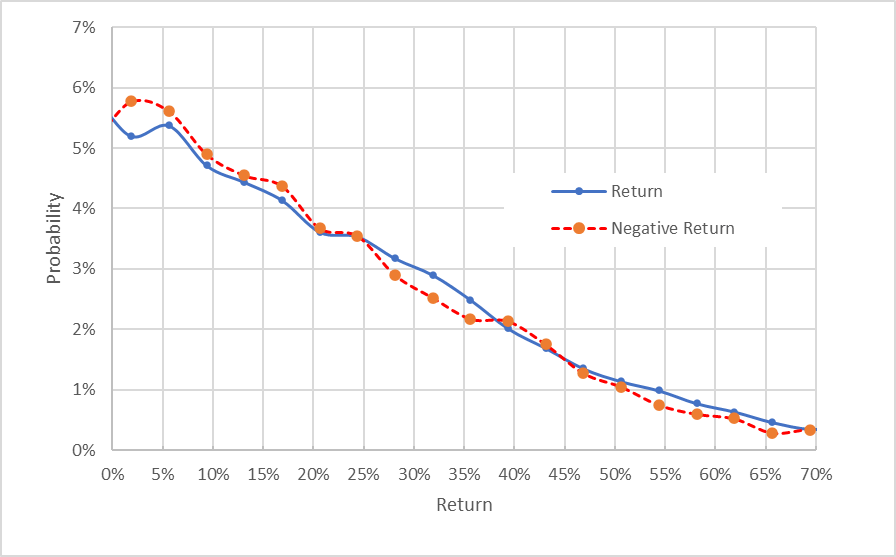
Market-implied price return probabilities for FDX for the 7.4-month period from now until June 16, 2023. The negative return side of the distribution has been rotated about the vertical axis (Source: Author’s calculations using options quotes from ETrade)
Overall, the market-implied outlooks don’t provide much guidance, although it is encouraging that they do not indicate elevated probability of further declines. The outlook is predominantly neutral, although there is a slight bullish tilt, especially in the near-term. This suggests that perhaps FDX is a bit oversold. The expected volatility, in the range of 36% to 38%, is quite high.
Summary
FedEx is looking at a challenging period for at least the next year, with an expected economic slowdown that will reduce demand for the company’s services. The recent earnings shock, which cut about 20% off of the company’s market cap, has the market reconsidering FDX’s valuation. Interestingly, the Wall Street consensus rating continues to be a buy, as it has been for 12+ months, even as the share price has dropped. The consensus 12-month price target is about 24% above the current share price. Given the large dispersion in analyst price targets, however, don’t put much weight on this value. In fact, the high implied return from this consensus price target, combined with the big spread in the individual price targets, may actually be a somewhat bearish signal. The market-implied outlook for FDX is mainly neutral, with a slight bullish tilt in the near-term. The expected volatility is quite high, at 36% to 38%. It is a positive sign that the options market is not indicating elevated probabilities of further declines. I am assigning a hold rating to FDX.


Be the first to comment