

aristotoo/E+ via Getty Images
Following an index (or two) helps investors get a feel for what the market is doing. This is quite obvious, but some investors rely too heavily on an index to understand what their individual holdings are doing. Branching out your market tools can assist in understanding where the market and, at times, individual stocks are headed. You might have heard of it but don’t fully understand it, but the Volatility Index (VIX) can often be used to triangulate several market points and surmise where it’s headed in the near-to-medium-term. Right now, the VIX is signaling the market is readying for a massive rise in volatility with index losses as we exit 2022.
If you’re a longtime reader of mine, you might think I’m branching out from my core competency of tech and tech stocks. However, in my marketplace service, I use many tools every week to arrive at a conclusion – analysis requires more than one or two inputs. For example, I regularly analyze the S&P 500 (SP500)(SPX) and the Nasdaq (COMP.IND), among other tools, to determine where tech and the market are headed. One of which is the VIX. But if this is your first time reading my work, then know there’s more in-depth analysis behind this market-level work.
Important Premises About The VIX
As a quick crash course on the VIX, I want to mention a few basic premises for those unfamiliar with how it works and how what I’ll say below assumes these factors. The first is the VIX is a derivative of the S&P 500’s options and not the index itself. The VIX is based on the out-of-the-money calls and puts of the S&P 500 30 days out. The options market provides insight into the market’s expectations, thus allowing it to be a tool for where the S&P 500 is headed.
The second is the VIX is also a mean reversion instrument and tends to return to its long-term average within weeks. It tends to return to an equilibrium around 25-26 when it is far from it (either to the top side or bottom side).
And lastly, the volatility index mainly rises when the S&P falls quickly, with volatility – hence the name. Therefore, if you look at the VIX and the S&P 500 over the same period, it’s nearly the inverse picture. The below chart illustrates this perfectly.
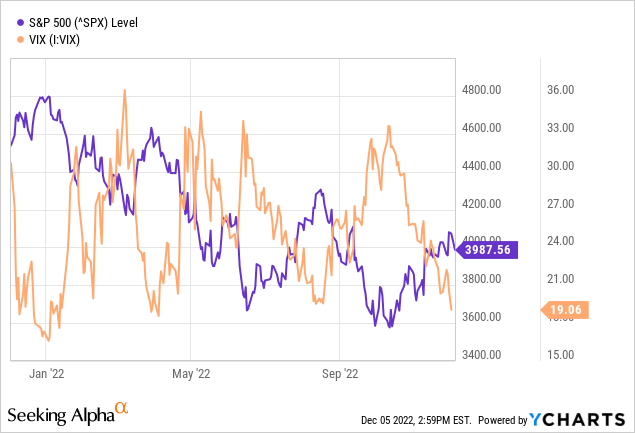
This combination of premises regarding the VIX makes it a great indicator of where the S&P 500 is headed over the next 30 days. This is why I use it as another tool in the toolbox, aside from straight technical chart analysis on the indexes themselves.
Where We’ve Been This Year
The VIX struck near its yearly low last week as it dove below 19 for the first time since August. Including the January lows, this is the fourth time the index has dropped to these levels (light orange horizontal line on the chart below). Each time it has bounced up toward at least the 34 level and has done so within four-to-eight weeks, mainly on the lower side of that range.
stockcharts.com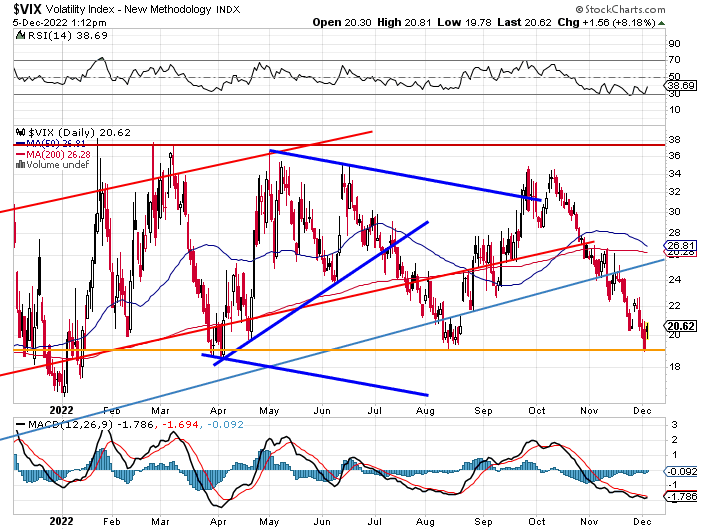
Generally, the VIX likes to overshoot in both directions. So while the average is in the mid-20s, it doesn’t mean it goes from well below it to right to it. Keep this in mind as the S&P 500 falls this week.
Now, the VIX doesn’t need to immediately head to the overshoot or even its typical average of 25-27, but it is built to do that and has this entire year. Additionally, in November, it broke below an upward trendline (baby blue line above) and has not tested or returned above it as it did in August. This adds another reason the VIX will move higher in the coming weeks.
So far, since striking the low last week, the bounce from 18.95 has produced a near-term bottom and, combined with the S&P 500’s action on Monday, bodes well for a continued rise on the volatility index. Unfortunately, this means the S&P 500 will likely meander lower throughout most of December.
I combine the chart movements with indicators like the MACD and RSI (both pictured above) to show the VIX has reached exhausted levels. The RSI has remained near oversold levels while the MACD is flattening out after reaching exhaustion near 1.7 (MACD is best used on a relative scale). These indicators show initial signs there’s a turn ready to happen on the chart itself.
Predictions For The End Of 2022
With the VIX set to head higher, meaning S&P 500 volatility set to increase, the odds of a Santa Claus rally are much lower than historical.
Now, don’t read me wrong; I’m not some kind of perma-bear who is in the business of reigning down fear on my readers. My Tech Cache members know I’m not married to a direction but, instead, analyze what the market is saying. Sometimes it’s up, and I’m bullish; sometimes, it’s down, and I’m bearish. In either case, you need to know December will be bumpy for the equity markets.
Having said this, while most of December may be volatile and bearish for the S&P 500 specifically, the entire month may not be written in red. So there’s still a possibility the closing week or so of the month may see a year-end rally. Whether that comes before Christmas is to be seen, but it looks like December might end the month red instead of deep in the green.
My prediction also has risk to the upside if volatility increases quickly and the S&P 500 moves down proportionally in a hurry. If this move happens in the next two weeks, it may provide the latter half of the month breathing room to make up lost ground. However, even if you haven’t been in the market long, you know it likes to take the elevator down and the stairs up. So even with a strong selloff, the rally may take twice as long.
The bottom line is volatility is set to increase. Because increased volatility correlates to lower S&P 500 levels, it means December looks to cap off 2022 much like how it’s gone: red. Again, the VIX is another tool in the toolbox and isn’t the sole determining factor to where the market is going. But I have a much more encompassing picture this week in my market Week In Review.
Be the first to comment