

MicroStockHub
DISCLAIMER: This note is intended for US recipients only and, in particular, is not directed at, nor intended to be relied upon by any UK recipients. Any information or analysis in this note is not an offer to sell or the solicitation of an offer to buy any securities. Nothing in this note is intended to be investment advice and nor should it be relied upon to make investment decisions. Cestrian Capital Research, Inc., its employees, agents or affiliates, including the author of this note, or related persons, may have a position in any stocks, security, or financial instrument referenced in this note. Any opinions, analyses, or probabilities expressed in this note are those of the author as of the note’s date of publication and are subject to change without notice. Companies referenced in this note or their employees or affiliates may be customers of Cestrian Capital Research, Inc. Cestrian Capital Research, Inc. values both its independence and transparency and does not believe that this presents a material potential conflict of interest or impacts the content of its research or publications.
It Was Good But Not That Good – We’re Not Complaining
The Trade Desk, Inc. (NASDAQ:TTD) is an ad-tech business, as you likely know. Revenue goes up as a function of digital ad spend, and is skewed towards open-internet and connected TV digital spend – in contrast to ad spend within walled gardens such as the Facebook platform. Of late this has been a sector of concern – Meta Platforms (META) itself has flagged weakness in the ad environment as they perceive it, and general recession grumbles have had the market concerned about more bad news to come in the adtech sector at large.
TTD did a very good job this quarter of showing why the stock can trade independently of META and other closed system ad environments. The numbers were strong.
Q2 And Historic Financials
TTD Financials (Company SEC filings, YCharts.com, Cestrian Analysis)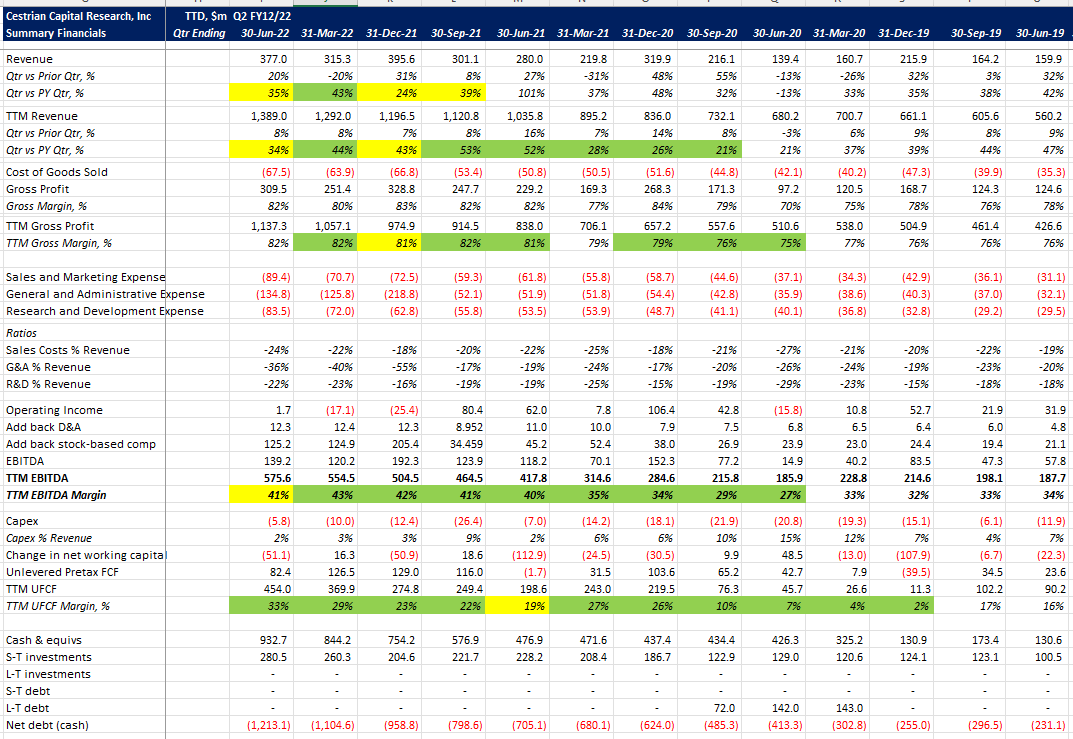
Year-on-year growth this quarter fell from +43% in Q1 to +35% in Q2 but in fairness the company was lapping a blowout +101% growth quarter in Q2 2021 (itself a function of negative Covid-hindered growth in Q2 2020) so some sequential slowing was to be expected. TTM revenue growth came in at +34%. EBITDA margins remained strong at +41% on a TTM basis but the real shining light here was unlevered pretax FCF margins of 33% on a TTM basis. There are relatively few companies in the world that can grow revenue at +34% whilst delivering +33% cashflow margins and which have $1.2bn of cash sat on the balance sheet unencumbered by debt of any kind.
Let’s look briefly at fundamental valuation multiples before we turn to the stock outlook.
Fundamental Valuation
TTD Valuation (Company SEC filings, YCharts.com, Cestrian Analysis)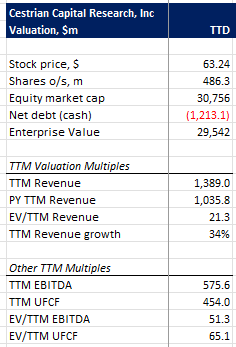
In the context of growth stock valuations, this doesn’t look too bad to us, even after the post-earnings pop. 65x cashflow for that blend of growth and margins isn’t in our opinion unreasonable. You’ll pay around half that multiple for an ex-growth defense contractor like Raytheon (RTX), so, is it worth 2x Raytheon’s cashflow multiple to give yourself the opportunity of the upside that TTD may bring, vs. the steady-state that RTX likely offers? Only you can decide, but our view in the present environment is, yes.
TTD Stock Price History And Outlook
TTD sold off along with other growth names in 2022. It started to bottom out in May through July, and on August 1st in our Growth Investor Pro service here on Seeking Alpha we moved to an ‘Accumulate’ rating – we thought the bottom was likely in, and we saw the stock sell off every time a weaker ad-tech company reported (poor Snap Inc. (SNAP) earnings have hit TTD stock these last couple quarters, for instance – even though SNAP is a walled garden and TTD does not at all serve the same segment). That proved to be a righteous call – we said Accumulate with the stock in the $45 zip code, and after the earnings print the stock is currently sitting in pre-market at $63, so a 40% gain in a little over a week. Nice when it happens.
To walk you through the story of the stock price, here’s a Crayola-fest chart which we’ll take step by step. You can open a full-page version, here.
TTD Stock Chart (TradingView, Cestrian Analysis)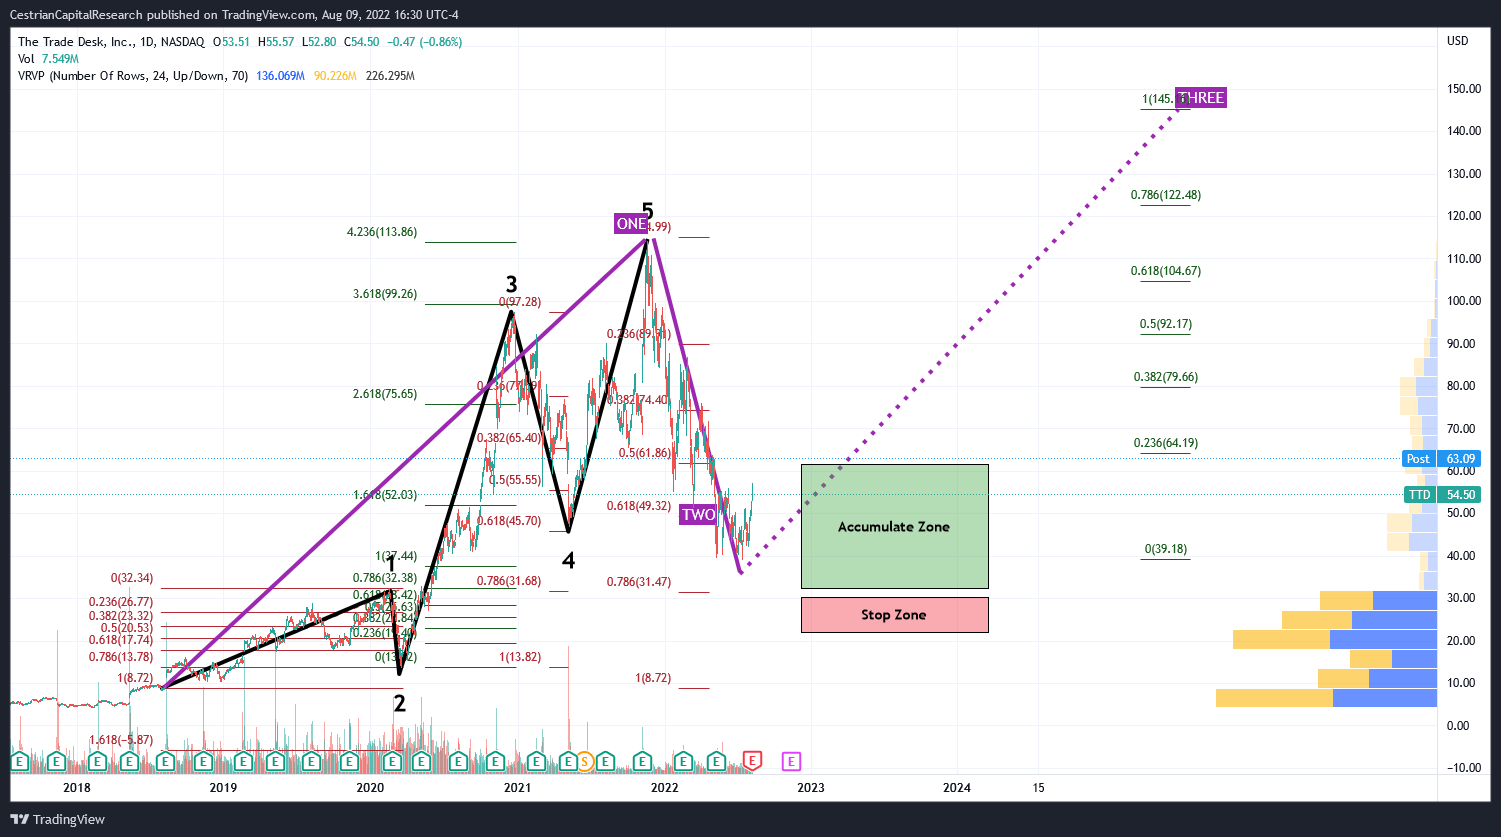
From the 2018 lows, the stock put in a 5-wave up sequence which followed standard Fibonacci extensions and retracements quite well. Wave 1 up peaking just before the Covid crisis; Wave 2 down troughing at the 78.6% retracement of that Wave 1, in the depths of the crisis; then, a huge Wave 3 up peaking almost to the dollar at the 3.618 extension of Wave 1; a Wave 4 down bottoming at a textbook 61.8% retracement of the Wave 3 up; and then a final Wave 5 higher which completed a little above that Wave 3 and in fact hit the 4.236 extension of Wave 1 almost to the dollar. Amongst folks who never leave the screen, like us? That’s a beauty, a classical set of extensions and retracements and what it means is that the stock trades with sentiment – extreme sentiment in fact, hence those large extensions.
Taken together you can treat that 5-wave-up sequence as a larger-degree Wave One which ran from around $9 in August 2018 to around $115 in November 2021. (That’s a close to 120% IRR by the way, which is why growth stocks hold such great appeal even – especially – in times of trouble).
After a larger degree Wave One you can expect a larger degree Wave Two, and that’s what we got starting with the Great Growth Dump of Q4 2021. Thus far that Wave Two has found support between the 61.8% and 78.6% retracement of the Wave One up which is again a fairly common Wave Two down. It is possible that the stock is now in a larger-degree Wave Three up and if it is, then a price outlook of at least $145 is on the cards – that’s the 100% extension of the larger degree Wave One up.
So a screaming buy then? It depends on your investing or trading style. If you favor momentum then for sure this name offers opportunity here. In our own personal account investing – and in our Growth Investor Pro service – we aim to play the Wyckoff Cycle to our advantage. As you know, this is a theoretical construct but approximations to it crop up often enough in the real world for it to offer appeal as a strategy. If you want to refresh your memory, you can read the Investopedia version of it here.
Or allow us to walk you through our own take on the Wyckoff Cycle, as follows (we’ll include a couple real-life examples).
The Idealized Wyckoff Cycle
We like this method because we see it as a way to invest more like Big Money, and less like Chad, which is a mantra of ours. Whilst you can’t know what Big Money is doing right this moment, the advent of free stock charts and data mean you can tag along with only a modest delay if you know what you are looking for. So, here goes with a few words on how you might use the Wyckoff Cycle to grab a few crumbs from the table of Big Money, LP.
1 – Accumulation
When a security is in the doldrums, scoop up little chunks of it quietly whilst nobody is looking. If it runs up too much, take some gains. If it craters, buy a little more. All slowly-slowly, no emotion. Your model here is a boring portfolio manager who looks like s/he worked for IBM in the 1950s, takes the same sliced-bread sandwich to work every day, drives a modest sedan, owns a nice but still modest home in a good suburb, takes nice vacations but they don’t involve yachts. And has a 401k that could buy a small town outright. Your model here is not Chad And The Crypto Bros, no matter how many Lambos they may have leased in the last couple years. If you find yourself getting Chad FOMO? Just repeat the mantra. “Only leased”, you say to yourself. “The Lambos are only leased”.
2 – Markup
When you see a raft of talking heads on TV, grownups who ought to and in fact do know better than to be talking Grandpa and Grandma into buying Acme McDoodle Inc, the latest stock to wow the Street, you know you’re in the markup phase for ACME. This is when two kinds of investors are buying. One, momentum funds. They are smart and know what they are doing. They buy high and sell higher. That sounds dumb but works if you know how to do it. These kinds of investors are helping you if you already accumulated in the doldrums. Two, Chad. Chad is not smart and does not know what he (most always he) is doing.
3 – Distribution
As the security reaches a local high and you see it plateau, you can assume some distribution is likely taking place. At this point Big Money is selling the stock – and only one kind of investor is buying, and that’s Chad. Because BTD. It’s gonna rip next week, etc. Institutional selling here is either rapid – that’s the momentum folks dumping to realize quick gains, kudos to them – or measured and slow – that’s your IBMers once more. Stock moves down too fast? They may buy a little to support the price. Moves up again? Sell a little. Calm. Careful. No yachts. Think Lexus not Lambo. You see?
4 – Markdown
Talking heads again. It’s all going to hell – RUN! By now your momentum funds and your institutional IBMers are out of the name, Chad is still buying dips, long/short funds are shorting the name, it’s carnage out there. You don’t care, because if you followed the Wyckoff Cycle, you’re long gone too. You’re not buying dips because you know the downcycle will take longer than everyone expects. You’re looking around for the next doldrum-dwelling security to start quietly accumulating. YOLO does not feature anywhere in your mindset.
If you think the above is just idealized fairytale gumbo, it isn’t. Here’s IWM, the Russell 2000 index ETF. (Full page version, here).
IWM Chart (TradingView, Cestrian Analysis)
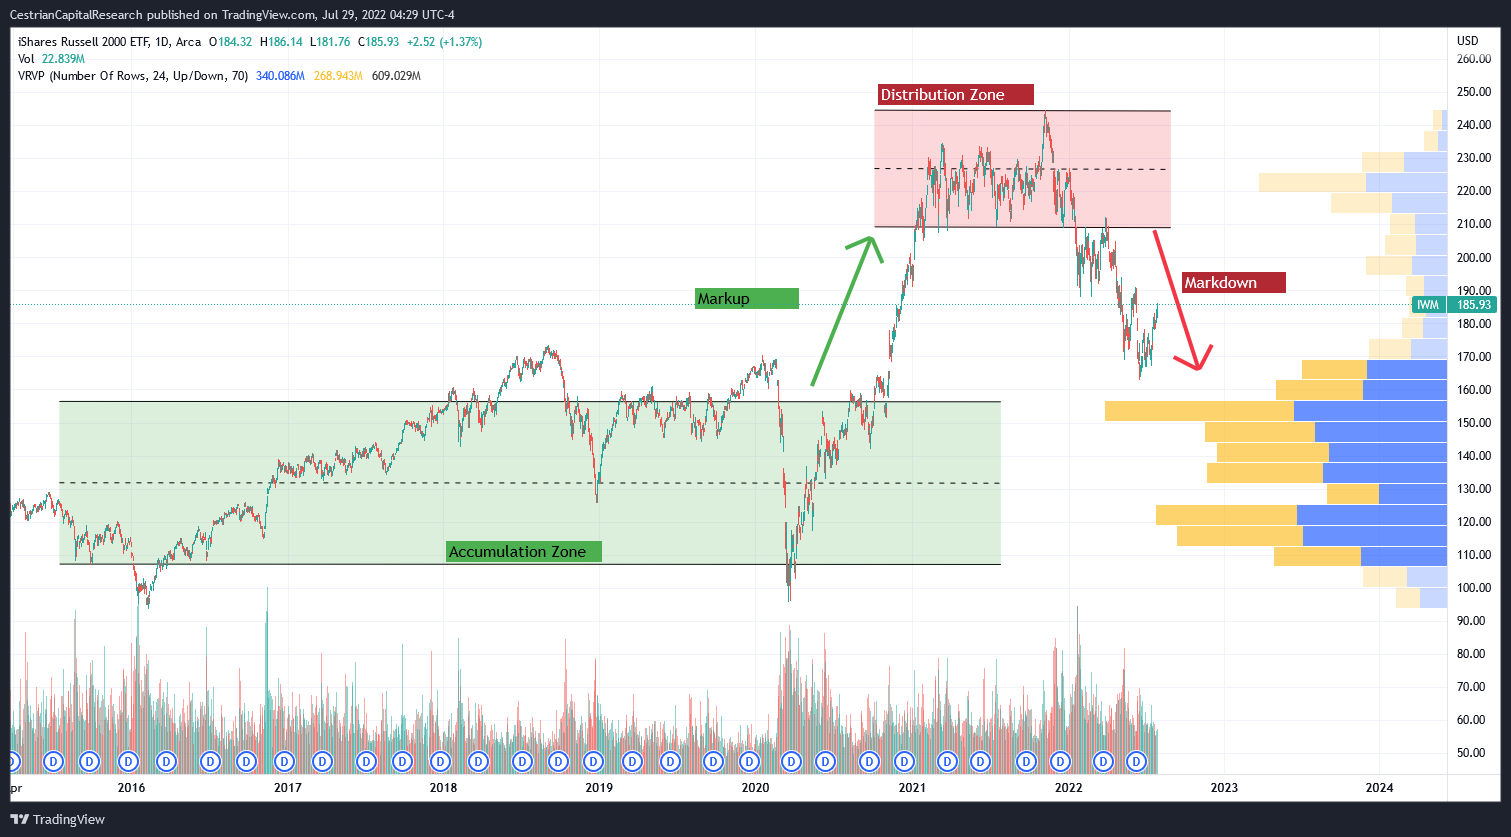
When you start looking, you can see this pattern in many other places too.
Back To TTD
To borrow a phrase we read recently, “the bull phase is never cancelled – not until the end of the world; it is merely delayed.” A move up may return to the market today after the CPI print, or it may be next month, or next year. But markets move up with time, as populations rise, as incomes rise, as wealth increases. So our timing may be off; the stock may fall before it rises; anything can happen short term. But do we think that digital advertising is on the up; we think that since markets favor entropy over order, we believe open-internet spend will grow faster than walled-garden spend, further favoring TTD vs. META, SNAP or other closed players; and we think that TTD’s superb execution to date will continue.
With that, the fundamentals and technicals in mind, we have a long term price target $145 or better. We think the stock can be accumulated between say $30 on the low end and $60 on the high end; and we believe it is best simply held above $61 in anticipation of a potential markup cycle taking the stock up towards our target. In your own work, should you be interested in this name, you will of course choose different downside protection methods – a simple stop-loss, trailing stops or whatnot – along the way, to suit your own approach.
Cestrian Capital Research, Inc – 10 August 2022.
Be the first to comment