

Alistair Berg/DigitalVision via Getty Images
GAAP earnings ended 2021 highly overstated. Over the past two years, corporate profits did not decline as much, nor has the rebound been as robust, as GAAP earnings would lead investors to believe.[1]
This report is an abridged version of S&P 500 & Sectors: Core Earnings Vs. GAAP Earnings Thru 2021, one of our quarterly series of reports on fundamental market and sector trends.
Generally Accepted Accounting Distortions
Figure 1 shows Core Earnings, which adjust for unusual gains/losses, are less volatile than GAAP earnings. For instance:
- In 2021, GAAP earnings rose 106% YoY compared to a 61% rise for Core Earnings.
- In 2020, GAAP earnings fell 30% YoY compared to an 18% fall for Core Earnings.
At the end of 2020, Core Earnings of $1.1 trillion were 21% higher than GAAP earnings of $877 billion. Now, at the end of 2021, Core Earnings of $1.7 trillion are 5% less than GAAP earnings of $1.8 trillion.
Figure 1: S&P 500 Core Earnings Vs. GAAP Earnings YoY Percent Change: 1Q20 – 4Q21
Change in Core Vs GAAP Earnings: 1Q20-4Q21 (New Constructs, LLC)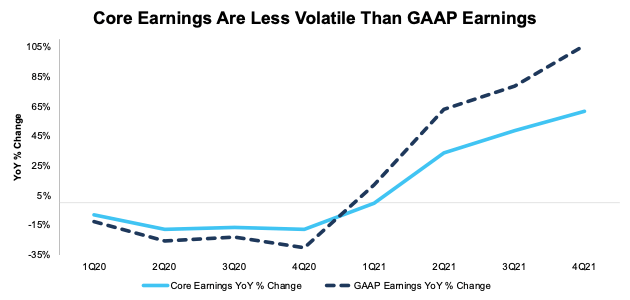
Our Core Earnings analysis is based on aggregated TTM data for the sector constituents in each measurement period. The March 11, 2022 measurement period incorporates the financial data from calendar 2021 10-K, as this is the earliest date for which all the calendar 2021 10-Ks for the S&P 500 constituents were available.
2021 GAAP Earnings Widely Overstated[2]
For 219 companies in the S&P 500, forty-four percent, GAAP Earnings overstate Core Earnings for calendar year 2021. When GAAP Earnings overstate Core Earnings, they do so by an average of 34%, per Figure 2. The overstatement was more than ten percent of GAAP Earnings for nineteen percent of companies.
The 219 companies with overstated GAAP earnings make up 56% of the market cap of the S&P 500, which is the second highest percent since 2012 (earliest data available). See Figure 3.
Figure 2: S&P 500 GAAP Earnings Overstated by 34% On Average
GAAP Earnings Overstated in S&P 500 (New Constructs, LLC)
Sources: New Constructs, LLC and company filings. We use Funds from Operations (FFO) for Real Estate companies rather than GAAP Earnings.
Figure 3: Overstated Earnings as % of Market Cap: 2012 through 3/11/22
Overstated Earnings as % of Market Cap Since 2012 (New Constructs, LLC)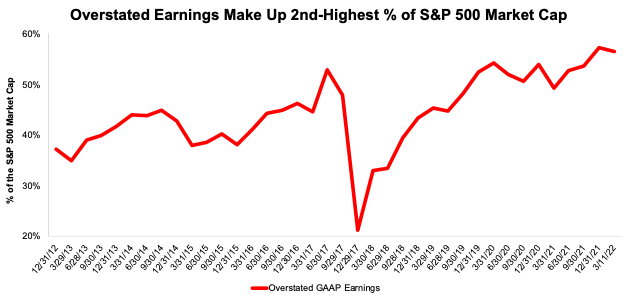
Key Details on Select S&P 500 Sectors
All eleven sectors of the S&P 500 benefited from a year-over-year (YoY) rise in Core Earnings in 2021, equal to the number of sectors with YoY improvement in the TTM ended 3Q21.
The Energy sector saw the largest YoY improvement in Core Earnings, which rose from -$1.1 billion in 2020 to $84.3 billion in 2021.
The Technology sector generates the most Core Earnings of any sector and grew Core Earnings by 42% YoY in 2021. On the flip side, the Real Estate sector has the lowest Core Earnings, and the Consumer Non-cyclicals sector had the weakest YoY growth in 2021.
Below we highlight the Technology sector and a stock with some of the most Earnings Distortion (i.e. overstated GAAP earnings) in the sector.
Sample Sector Analysis: Technology Sector
Figure 4 shows Core Earnings for the Technology sector, at $466.9 billion, rose 42% YoY in 2021, while GAAP earnings, at $503.0 billion, rose 46% over the same time. Earnings power within the Technology sector is unevenly distributed. In 2021, five of the seventy-nine companies in the Technology sector – Apple (AAPL), Alphabet (GOOGL), Microsoft (MSFT), Facebook (FB), and Intel Corporation (INTC) – account for 62% of the sector’s total Core Earnings.
Figure 4: Technology Core Earnings Vs. GAAP: 2004 – 2021
Technology Core Vs. GAAP Earnings (New Constructs, LLC)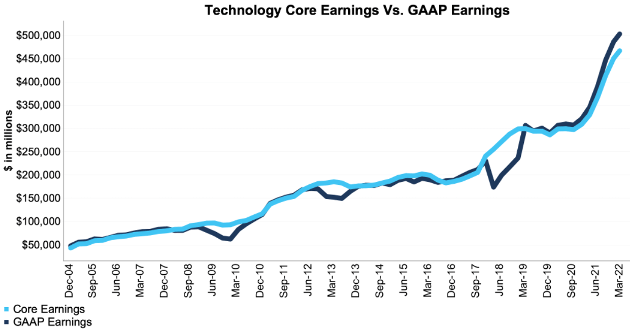
Our Core Earnings analysis is based on aggregated TTM data for the sector constituents in each measurement period. The March 11, 2022 measurement period incorporates the financial data from calendar 2021 10-K, as this is the earliest date for which all the calendar 2021 10-Ks for the S&P 500 constituents were available.
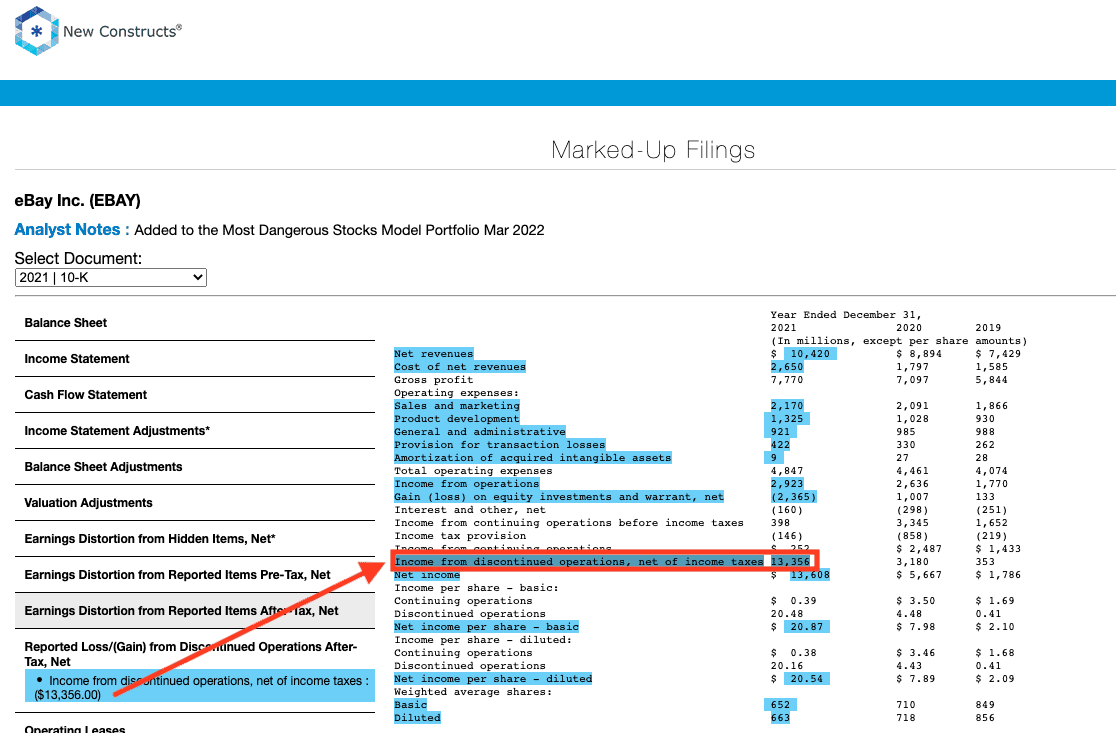
GAAP Earnings Overstatement Details: eBay Inc. (EBAY)
Below, we detail the hidden and reported unusual items that GAAP Earnings misses but that are captured in Core Earnings for eBay Inc. (EBAY). The firm has the ignominious distinction of being the stock with the most Earnings Distortion, and therefore overstated GAAP Earnings in the S&P 500’s Technology sector. After adjusting for unusual items, we find that eBay’s Core Earnings of -$7.8 million, or -$0.01/share are much worse than reported GAAP Earnings of $13.6 billion, or $20.52/share. eBay Inc.’s Earnings Distortion Score is Strong Miss. Our stock rating for EBAY is Unattractive.
Below, we detail the differences between Core Earnings and GAAP Earnings so readers can audit our research.
Figure 5: eBay’s GAAP Earnings to Core Earnings Reconciliation
EBAY Core V. GAAP Earnings Reconciliation (New Construct, LLC)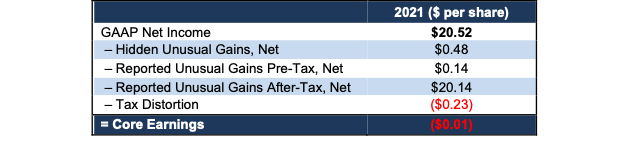
More details:
Total Earnings Distortion of $20.54/share, which equals $13.6 billion, is comprised of the following:
Hidden Unusual Gains, Net = $0.48/per share, which equals $319 million and is comprised of
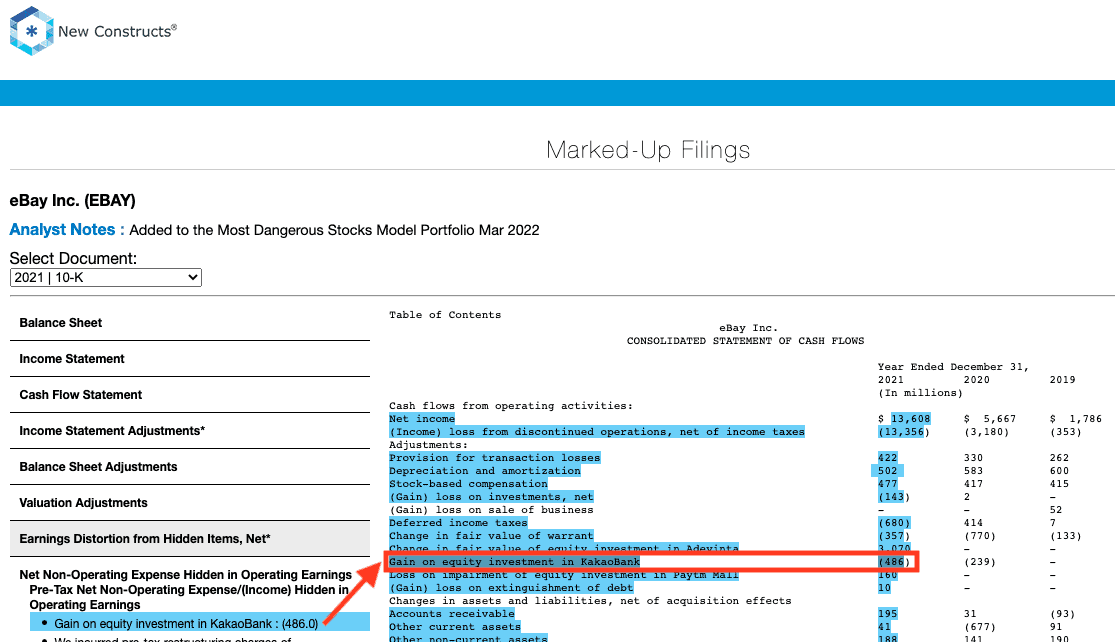
- $486 million in gains on an equity investment in KakaoBank – Page 61
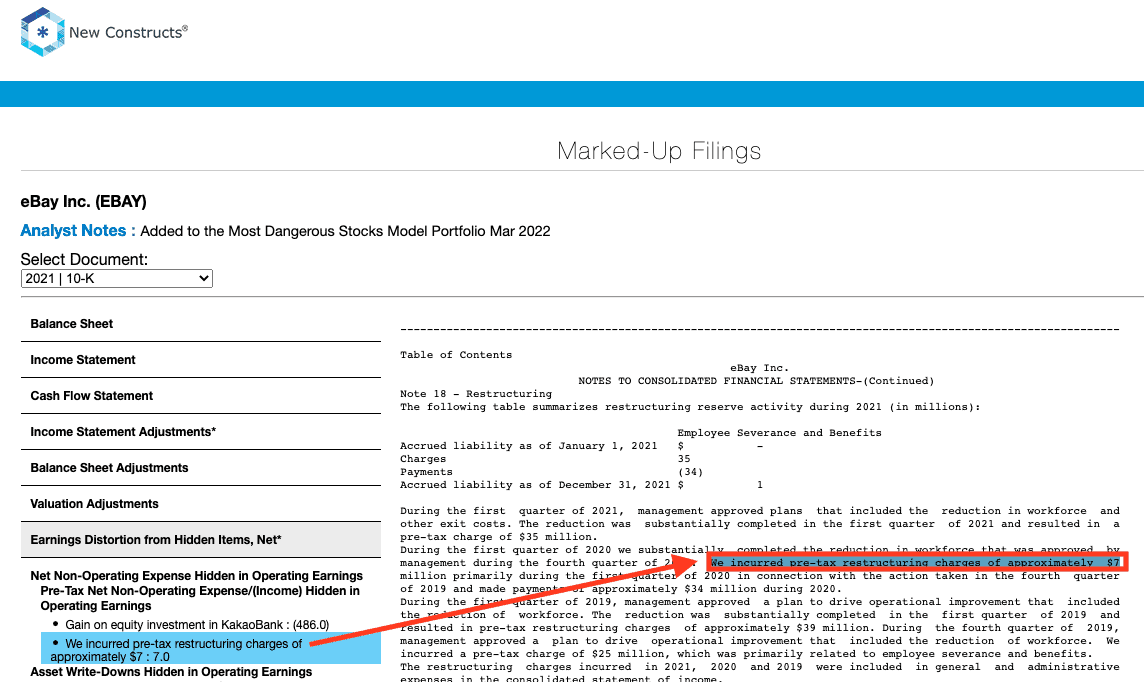
- -$7 million pre-tax restructuring charge – Page 113
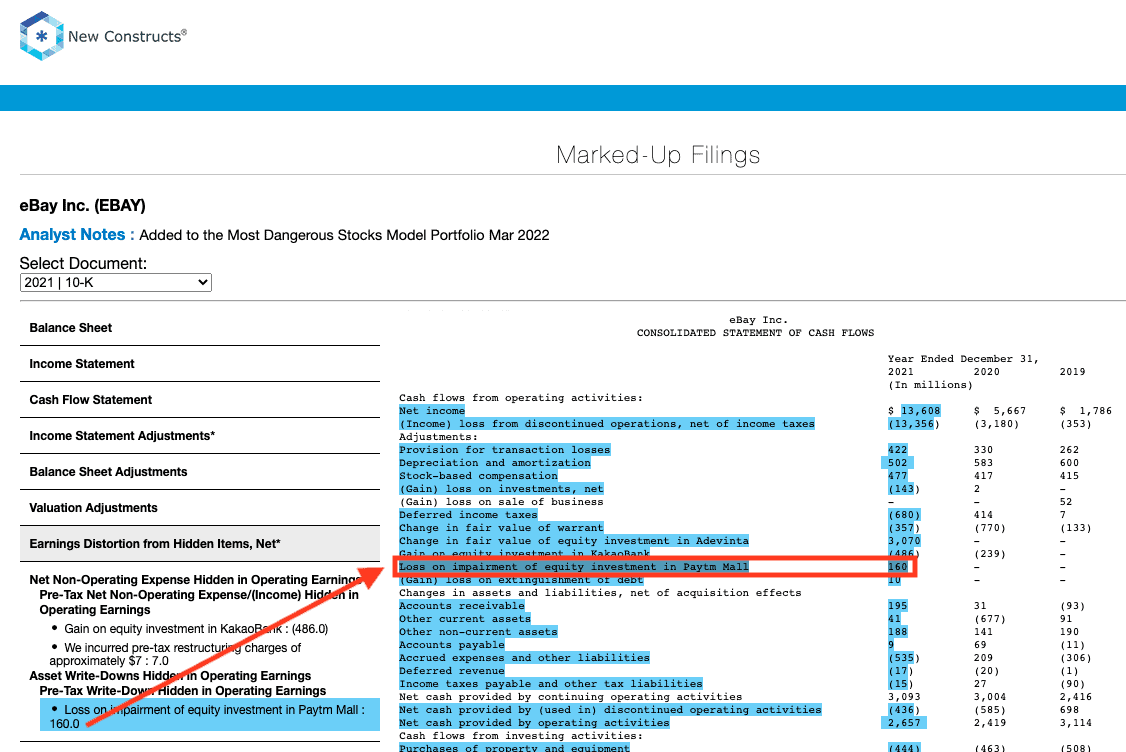
- -$160 million loss on impairment of equity investment in Paytm Mall – Page 61
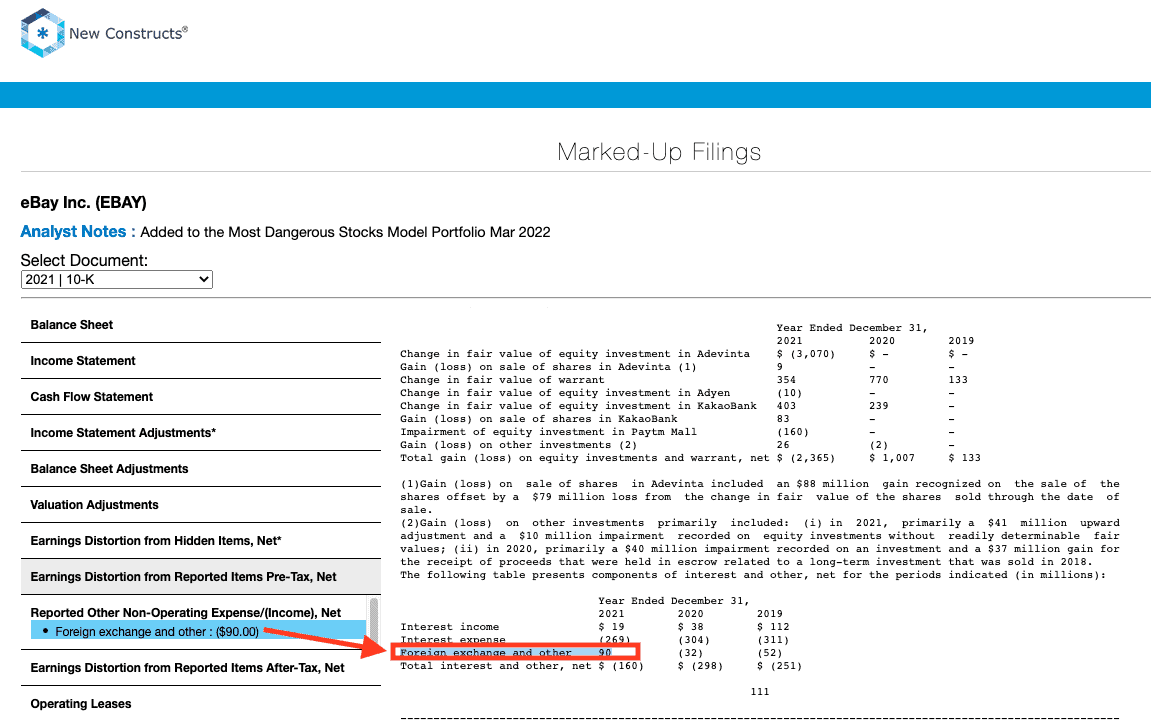
Reported Unusual Gains Pre-Tax, Net = $0.14/per share, which equals $90 million and is comprised of
- $90 million in foreign exchange and other gains
Reported Unusual Gains After-Tax, Net = $20.14/per share, which equals $13.4 billion and is comprised of
- $13.4 billion in income from discontinued operations
Tax Distortion = -$0.23/per share, which equals -$149 million.
Be the first to comment