

Michael Ver Sprill/iStock via Getty Images
Stocks had a solid finish to the week, thanks to options expiration. But if it had not been for the monthly options expiration, last week would have been a disaster. The S&P 500 (SP500) was down more than 4% at its lows on Thursday morning but finished the week lower by around 1%. The end-of-week comeback was aided by the slow melt of the VIX index (VIX).
Options expiration managed to keep the markets afloat and did not allow the S&P 500 to drift too far from the significant open interest levels around the 3,800 and 3,850 levels. As the market drifted lower during the week, the higher strike prices’ gravity helped lift the index higher throughout Thursday and Friday.
CBOE Live Vol/ Trade Alert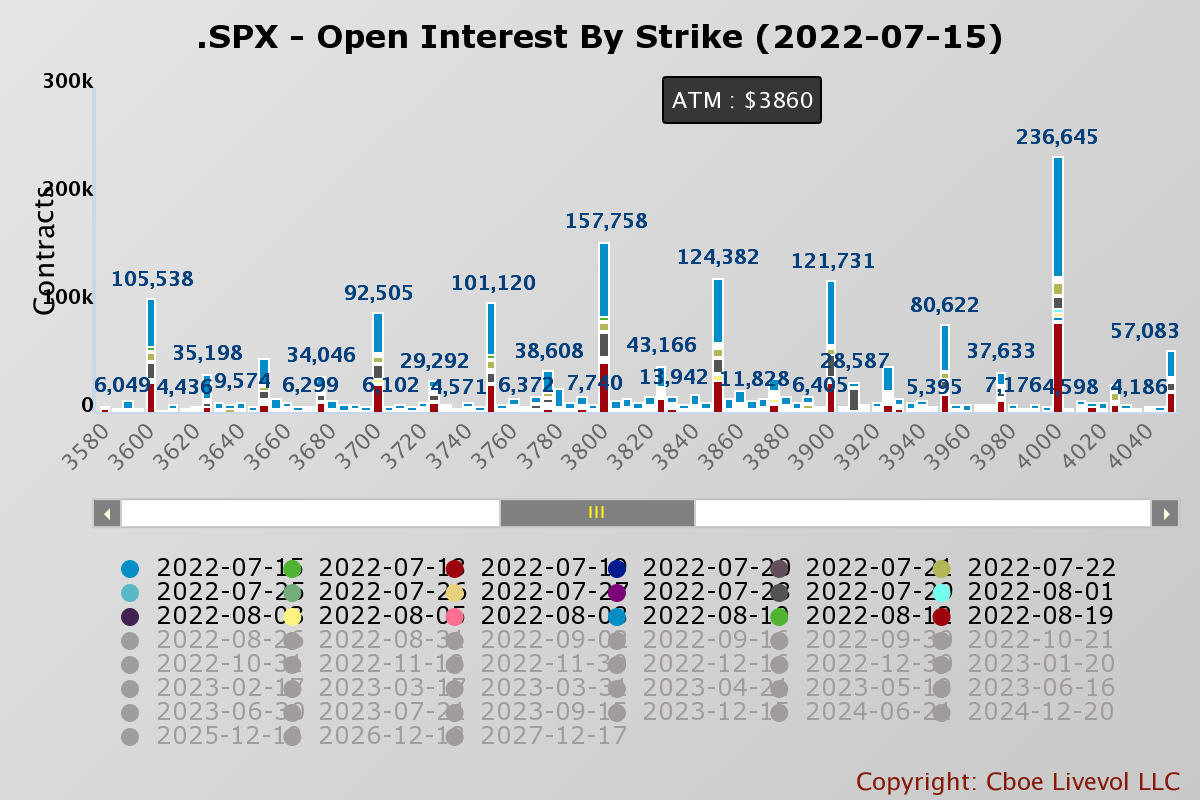
That is primarily why the S&P 500 was stuck between 3,845 and 3,860 on Friday after 11 AM. It only managed to move higher in the final 5 minutes of the trading session and closed just above 3,860.
Trading View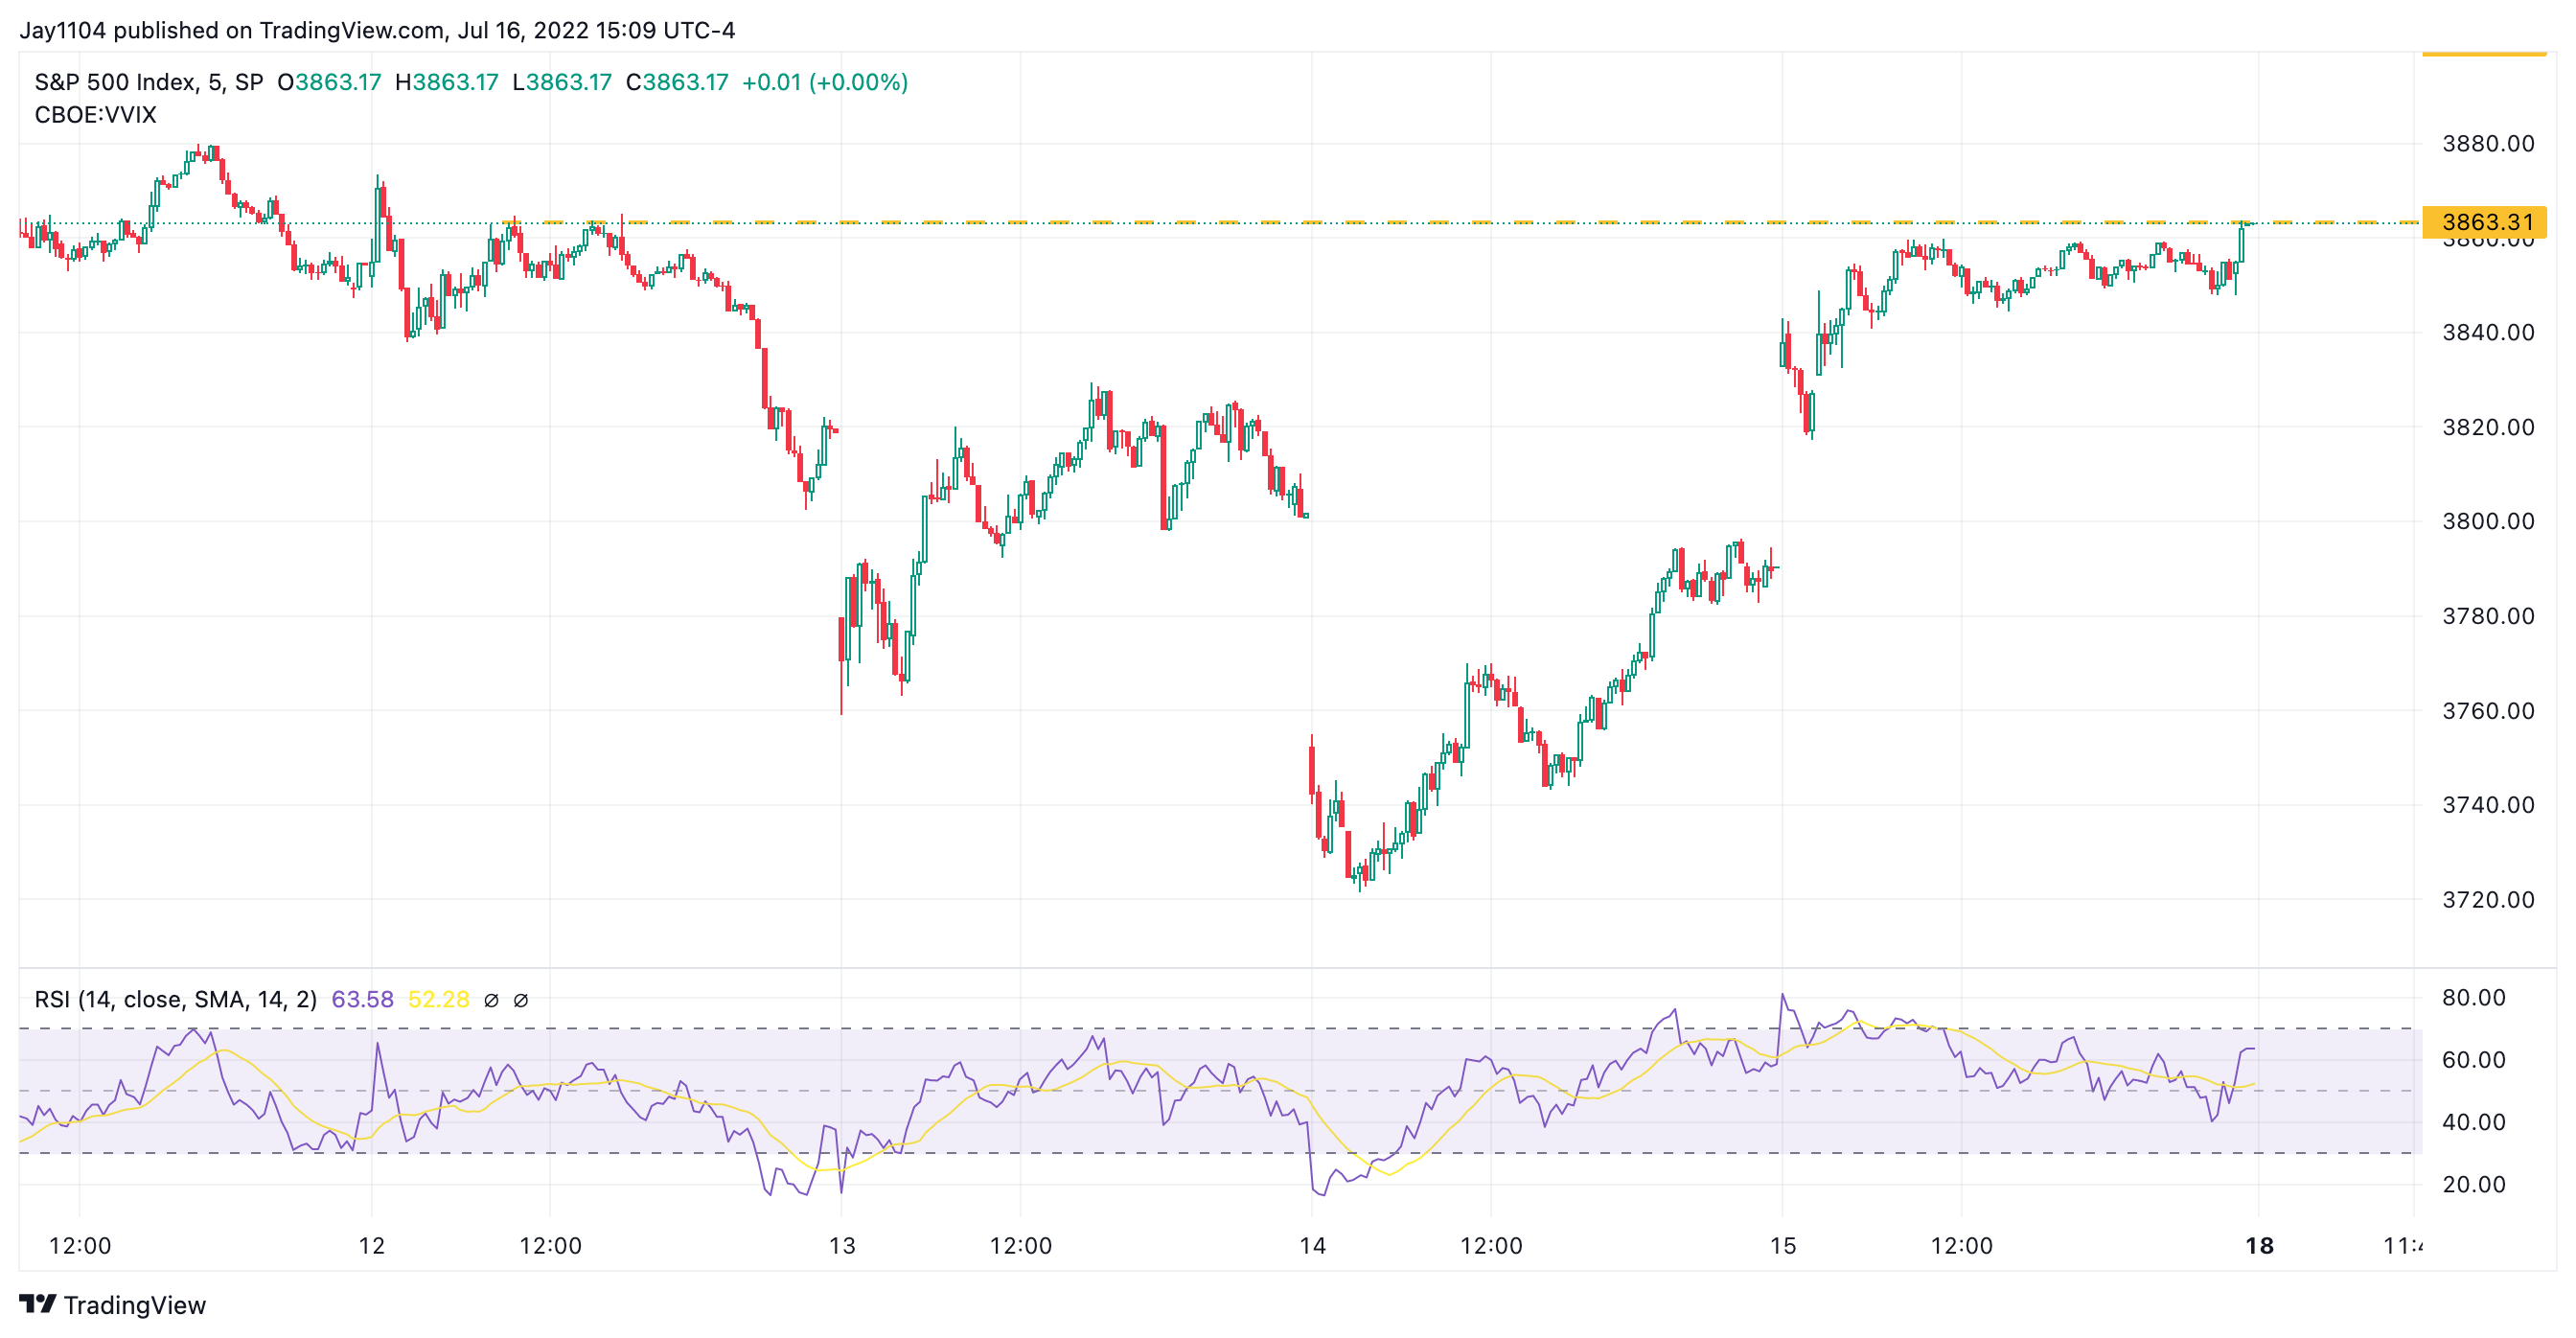
Monday starts a new options cycle, meaning the push and pull of options start over, and the market will be free to move much more easily. Open interest levels for the S&P 500 will be nearly cut in half with the removal of the July 15 trade date.
CBOE Live Vol/ Trade Alert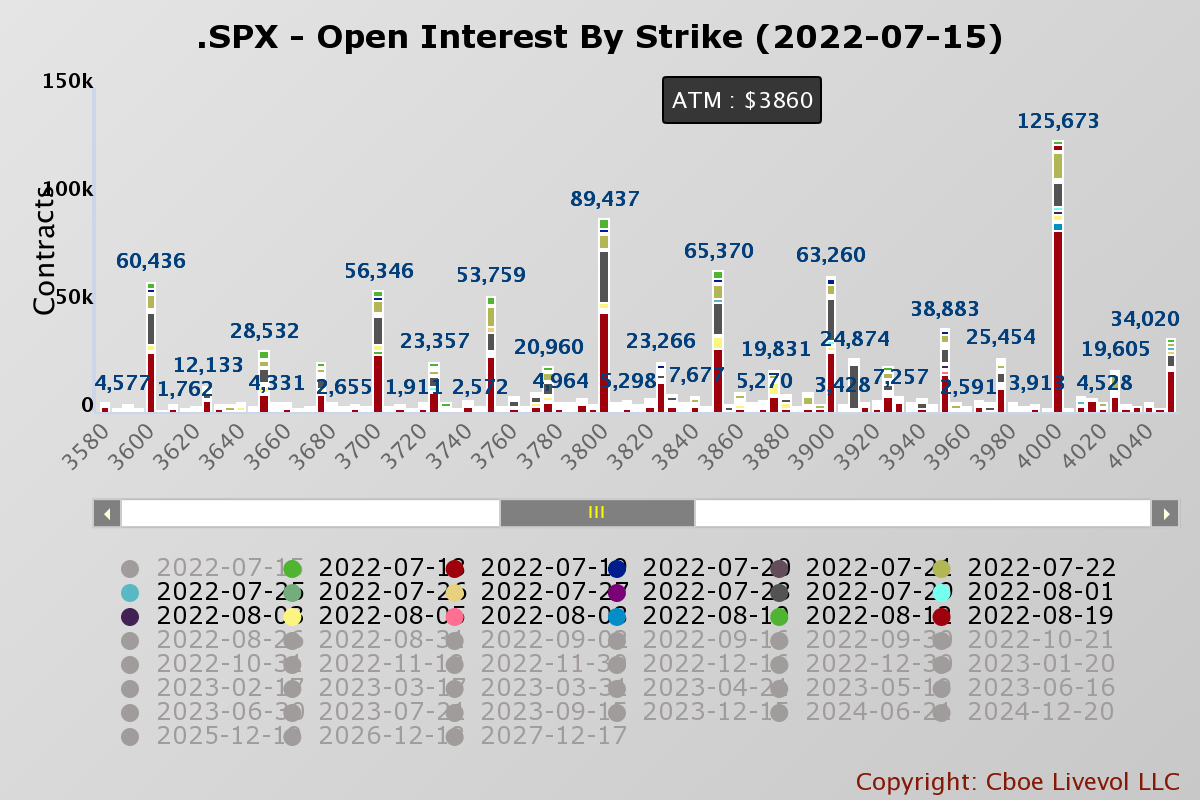
Additionally, there was a consistent decline in implied volatility levels in the S&P 500 throughout the week. The big intraday rebounds witnessed on Wednesday and Thursday were helped by falling implied volatility throughout the day. It would suggest the intraday price action was more mechanical and options related than due to the underlying macro backdrop.
Bloomberg 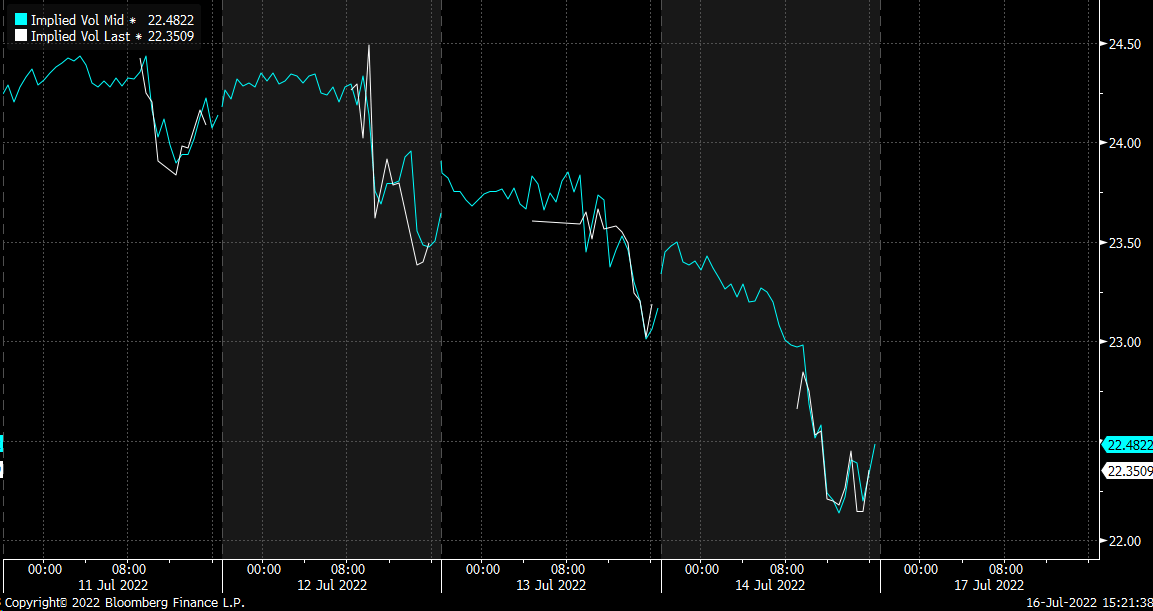
Macro Factors Forgotten For Now
The macro backdrop this past week was very negative. The CPI report came in much hotter than expected. The market is now betting on a 75 and 100 bps rate hike at the end of July. The odds of a 75 bps rate hike now stand around 70%, while a 100 bps rate hike stands around 30%.
CME 
While retail sales were better than expected, rising by 1.0% month-over-month versus estimates of 0.9%, they were still well below the CPI month-over-month gain of 1.3%. That means retail sales were down 0.3% on a month-over-month basis in real terms. Even on a year-over-year basis, retail sales were negative, rising 8.4%, below the 9.1% year-over-year gain in CPI. In real terms, retail sales fell 0.7% year-over-year and were negative for the fourth straight month. While the declines to this point are modest, it is rare for retail sales to be negative year-over-year in real terms. It has only previously happened in recessions.
Bloomberg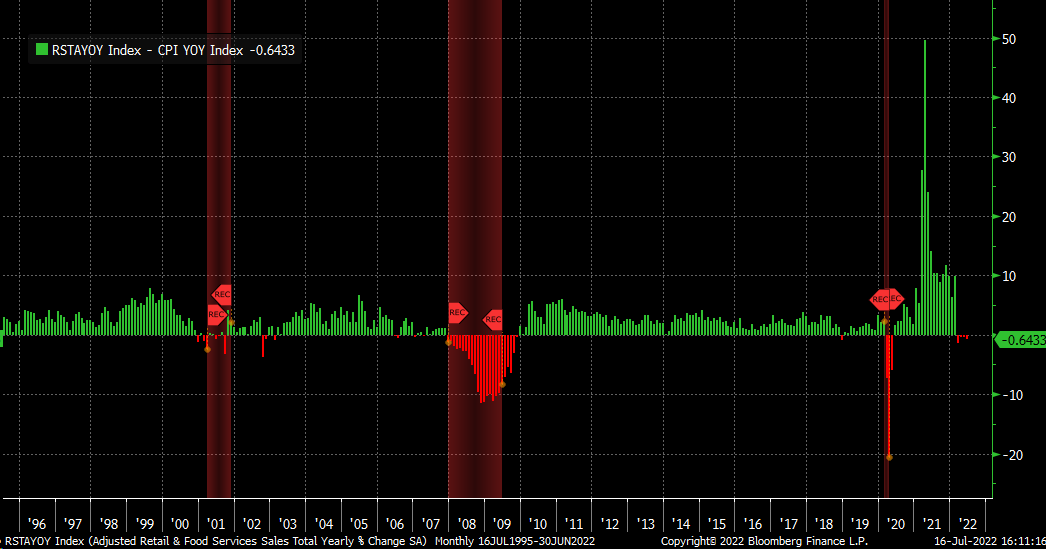
On top of this, the data out of China was just as bad, with second quarter GDP missing consensus estimates by a wide margin, rising by just 0.4%, well short of forecasts for 1.2%. This news was unnoticed by US markets during Friday’s trading session. Still, it didn’t go unnoticed in Asia, with CSI 300 index dropping by around 4% last week and the HK Hang Seng index dropping approximately 6.6%.
Bloomberg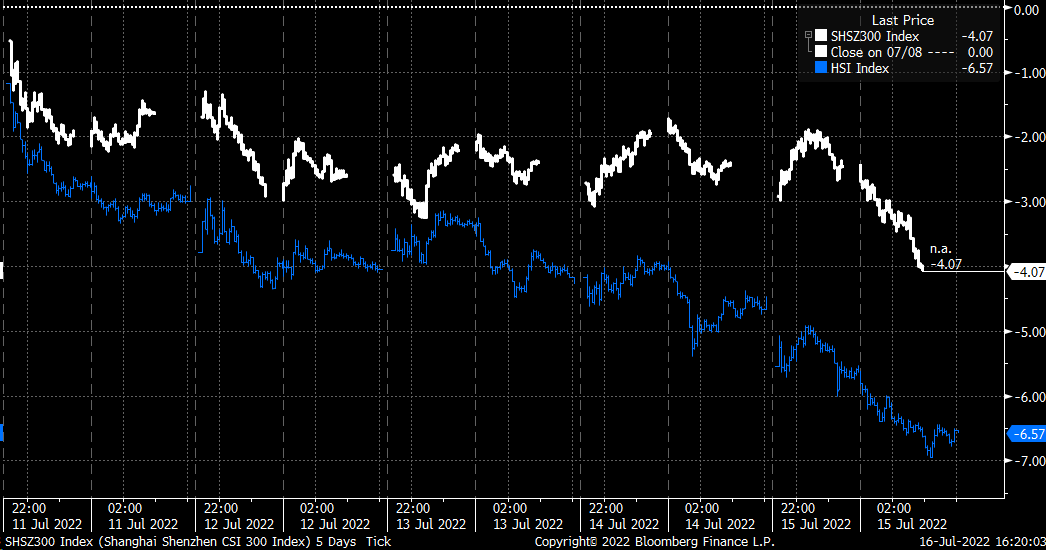
If that weren’t enough, Europe had its problems, with Italian Prime Minister Mario Draghi announcing his intentions to resign. The news caused the Italian 2-year yield to explode higher, which sent the euro sharply lower versus the dollar.
Bloomberg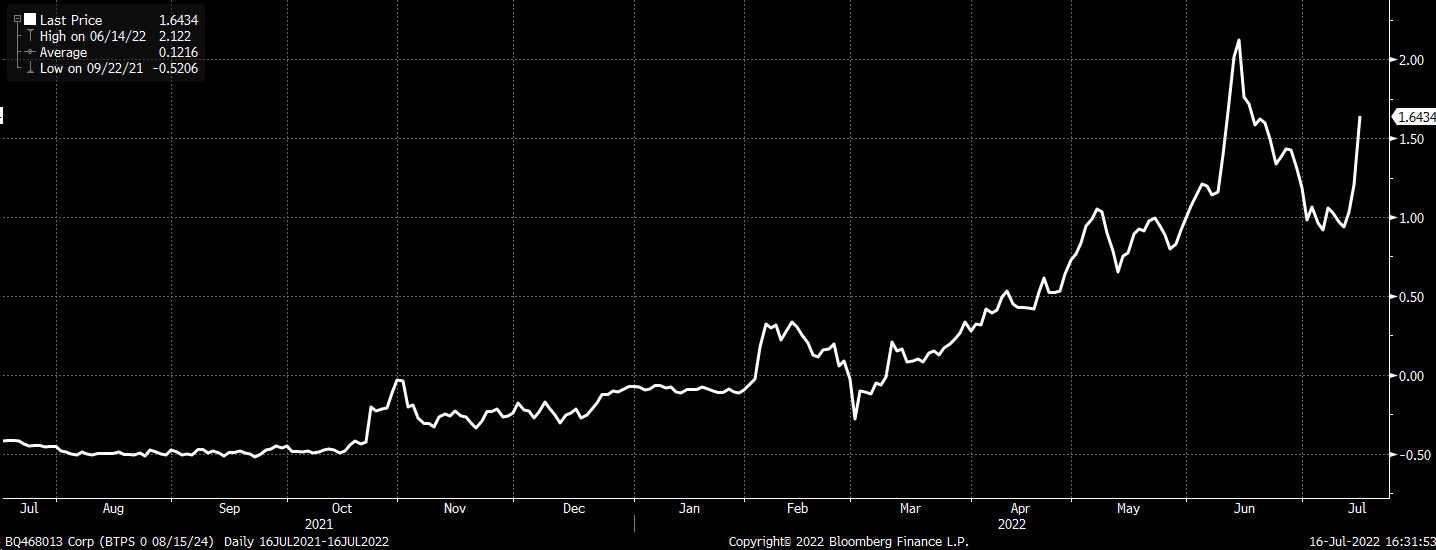
The euro is trading at its lowest point versus the dollar in nearly 20 years and at parity with the dollar. Couple that with China’s weak economic data and Japan’s reluctance to come off its negative interest rate policy and yield curve control, the dollar has strengthened versus the Japanese yen and the Chinese renminbi too.
Bloomberg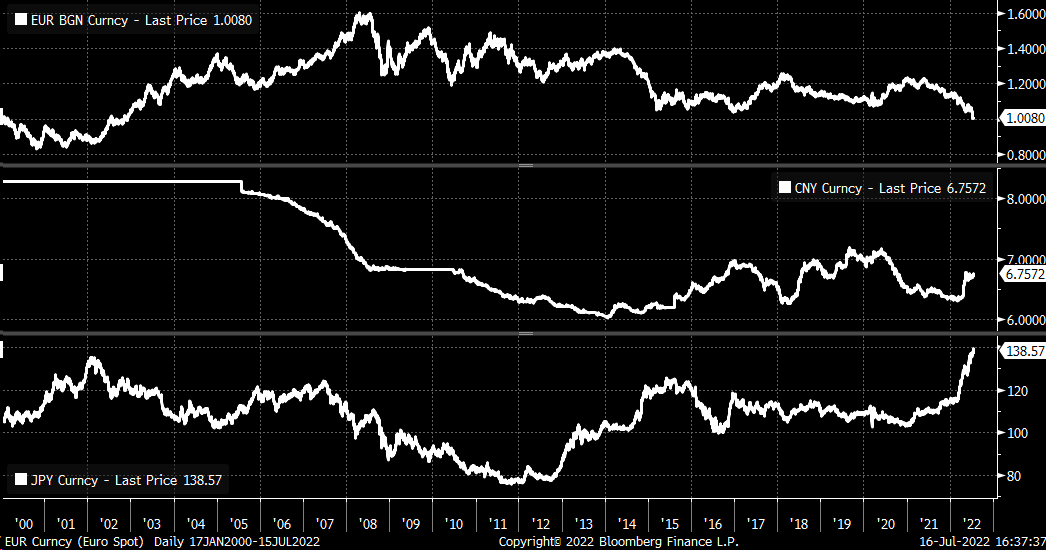
Implied Volatility Saves The Day
The macro backdrop did not support stocks rising and is a big reason markets were down sharply on Wednesday and Thursday morning. But once implied volatility and the VIX index began to melt, stocks got a boost right into Friday’s close.
Bloomberg
Stress Builds
But not all is well beneath the surface. As noted by the spread between the 3-Month USD Libor Rate and the US Effective Fed Funds Rate, a sign of stress may have shown its head in the overnight lending markets. The spread is not high compared to peaks in 2018, 2019, or 2020, but it is at its widest point since Russia invaded Ukraine and needs to be watched closely. The widening spread can signal increased equity market volatility.
Bloomberg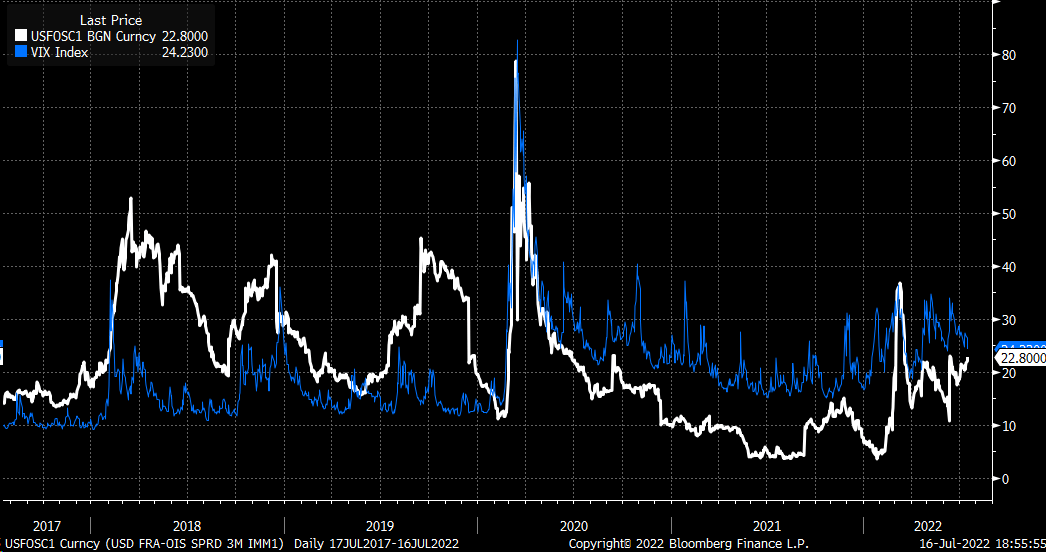
Given this backdrop, the melt of implied volatility is likely to change this week as the market moves past the VIX options expiration and begins to focus on macro issues along with a European Central Bank and Bank of Japan meeting this week, along with the FOMC meeting on July 27.
FOMC Cycle Should Kick In
The period after the FOMC meeting tends to be bullish. The only period that didn’t see a rally post-FOMC came following the May meeting. Otherwise, we have seen relatively big rallies following the FOMC meeting this year. But the period before the FOMC meeting can be very turbulent, especially 6 to 9 days before the meeting.
Trading View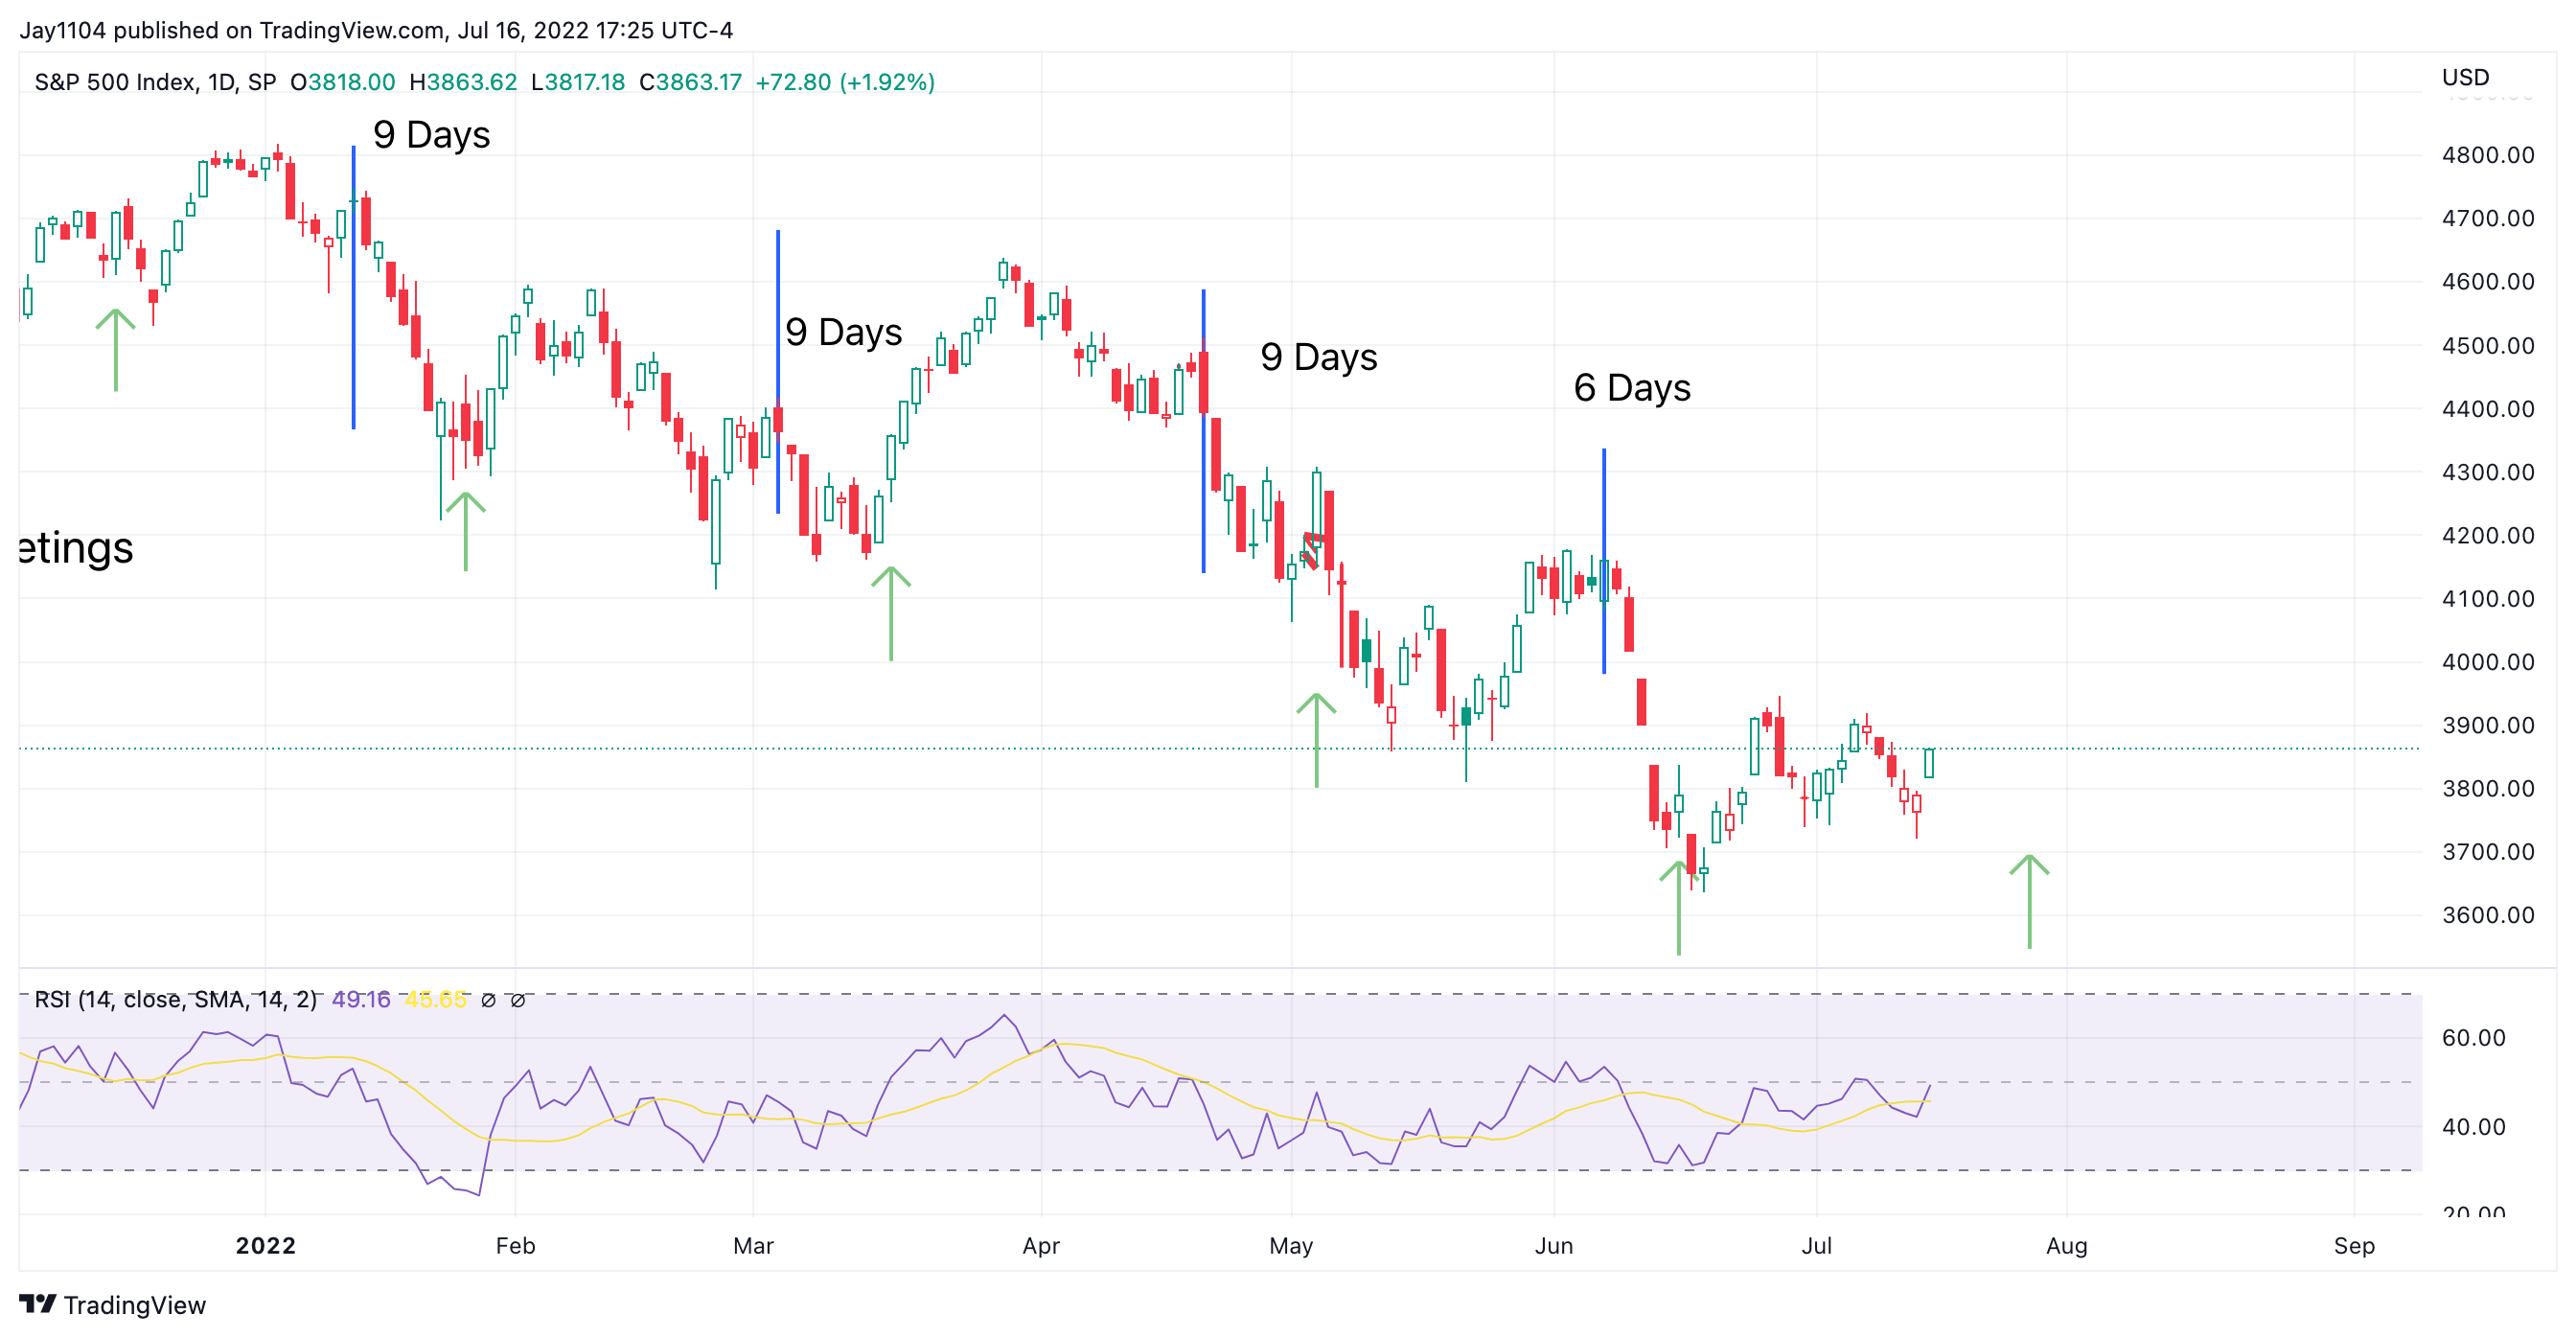
Volatility Rising?
The rallies after the FOMC meeting are usually because the VIX is elevated heading into that meeting. After all, the FOMC meeting creates an event risk. Therefore, traders look to put hedges in place by buying puts, pushing implied volatility up and, as a result, causing the VIX to go higher and stock prices down about 6 to 10 days before the FOMC meeting. Once the event risk passes, there is no reason to have hedges anymore, causing implied volatility to fall and for the market to rally.
The VIX appears to be set up similar to how it was at the June FOMC meeting. With volatility melting lower, there is potential to push significantly higher between now and the FOMC meeting.
Trading View 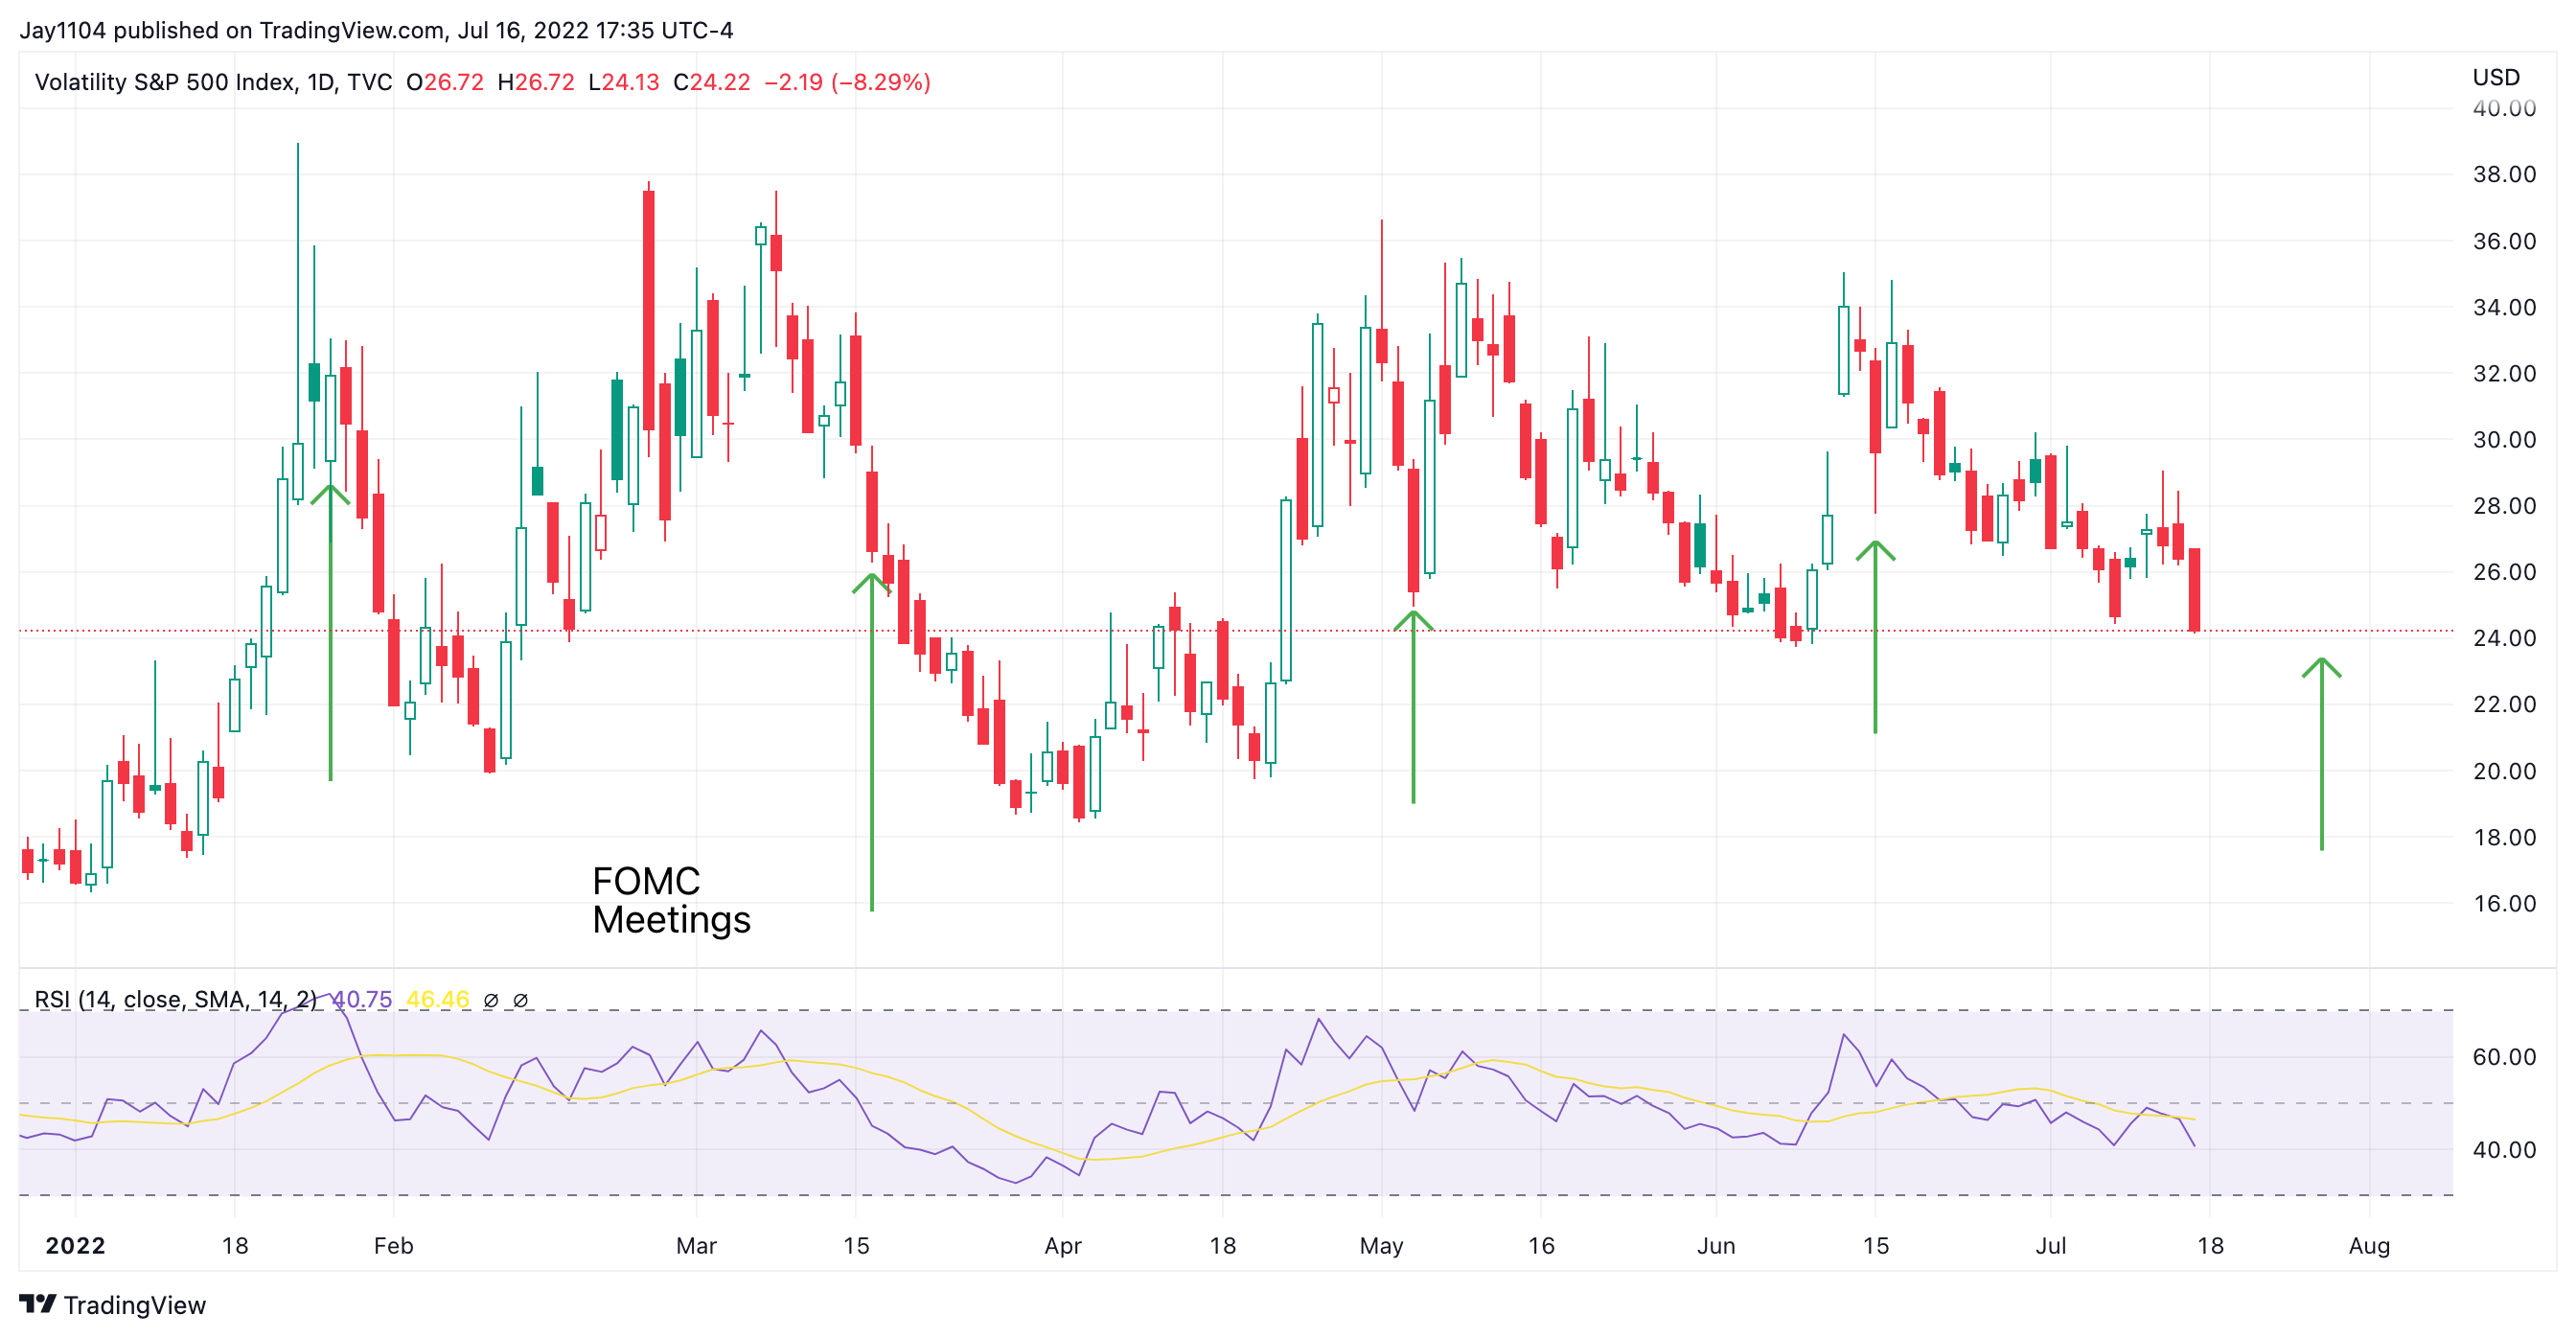
Interestingly, there has been a turn-up in 10-day realized volatility in the S&P 500. When the spread between 10-day realized volatility and S&P 500 30-day implied volatility widens by about 5 percentage points, it tends to push realized volatility higher, pulling implied volatility higher, which is bearish for stocks.

Can the market continue to rally, sure? But there continue to be many more reasons for it not to rally. Given several geopolitical factors, along with an upcoming central bank meeting from the ECB and BOJ this week and the FOMC next week, the risk for further downside pain is not over yet.
Be the first to comment