

peepo
Dear Investor:
The Sound Shore Fund Investor Class (MUTF:SSHFX) and Institutional Class (MUTF:SSHVX) declined 13.45% and 13.41%, respectively, in the second quarter of 2022, trailing the Russell 1000 Value Index (Russell Value) which declined 12.21%. As long-term investors, we highlight that Sound Shore’s 30-year annualized returns of 9.65% and 9.91%, for SSHFX and SSHVX, respectively, as of June 30, 2022, were ahead of the Russell Value at 9.54%.
We are required by FINRA to say that: Performance data quoted represents past performance and is no guarantee of future results. Current performance may be lower or higher than the performance data quoted. Investment return and principal value will fluctuate so that an investor’s shares, when redeemed, may be worth more or less than their original cost. For the most recent month-end performance, please visit the Fund’s website at www.soundshorefund.com.
In a broadly down market, globally, Sound Shore’s second quarter 2022 results were ahead of the S&P 500 Index (“S&P 500”) but behind the Russell Value as noted above. Higher inflation, rising interest rates and a slowing economy pushed the S&P 500 into bear market territory. The S&P 500 closed down 16.1% for 2Q, the worst second quarter performance since 1970 (down 18.0%). Similarly, the technology focused NASDAQ, small cap Russell 2000 and MSCI World indices fell precipitously. Equity investors had plenty of company as within major asset classes, only the US dollar and US Treasuries finished up.
How long this weakness will persist and whether we are headed toward a recession are being debated by economic prognosticators. At Sound Shore, we remain focused on the data we get from our company specific research. Key factors to watch will be how consumers adjust their spending due to inflation (June’s Consumer Confidence level was at a 16-month low) and if the two expected 0.75% Fed interest rate increases (July 27 and Sept. 21, 2022) will help ease the pain of the highest inflation readings in a very long time.
The selloff was broad with all eleven S&P sectors finishing lower. The consumer discretionary and financial services sectors were some of the hardest hit. Despite solid current profits and cash flow, portfolio holdings General Motors (GM, autos) and PVH Corp (PVH, apparel) were lower as the market questioned the consumer’s resiliency. And, as is often the case in a volatile market, financials sold off in response to rising credit concerns.
Morgan Stanley (MS) and SVB Financial (SIVB), both long term holdings, retreated despite having business models that are more resilient, over-capitalized and underappreciated by the market. In June, the Federal Reserve’s stress tests again blessed the health of the overall banking system. Morgan Stanley stood out with an 11% increase in its annual dividend, yielding 4.1% at quarter’s end.
The weakest performer in the quarter among our group of financials was SVB. Given the strength of its loan portfolio, best-in-class deposit growth, and an asset mix that benefits from rising interest rates, we added to the position at below 10 times our estimate for 2023 earnings. We took similar action during the stock’s sell-off in early 2020, and recognize that patience may be required.
Another detractor was homebuilder Lennar (LEN), one of the industry’s largest. We added the name during the fourth quarter of 2018 market selloff when Lennar was trading below normal at 7.5 times earnings and 1.1 times tangible book value. We believed the company had scale-driven advantages over small and mid-size builders, and also less exposure to sluggish premium housing trends versus its competitors.
Since the end of 2018, Lennar’s net debt to capital has declined from 32% to 13% in the most recent quarter. The increased cash flow has also enabled more than $2.1B of stock repurchases over the past four quarters. Lennar plans to simplify its portfolio to focus more as a pure-play builder, with less asset intensity, which will increase returns on capital and cash flow.
After material outperformance in 2020 and 2021, during which we trimmed our exposure, Lennar has been hit hard in 2022 by the sharp increase in interest rates, adding to concerns around home affordability. Given the selloff this year, Lennar’s valuation has fallen to 4 times earnings and price to tangible book value retreated back to 1.1 times at the end of June, despite the company earning an approximate 30% return on tangible equity over the past year.
While the short-term outlook for housing is clouded by a potential pause in activity due to mortgage rate shock, the limited supply of housing has never been more severe, as illustrated in the chart below. Housing is an example of an industry that has entered this point in the cycle in a different position than in the past, as recession scenarios are estimated by the market. Not unlike the auto sector, which has low inventories and has been producing below the normal long-term trend since 2020, the housing market is under-supplied.
Despite the likely short-term slowdown implied by the changing economic outlook, our team is confident in Lennar’s balance sheet, strategy, and management team and we added to the position during the quarter.
HOUSING SUPPLY LIMITED
15 Year Trailing Average Starts (MM)
Source: Census Bureau, ISI Research Note: The term “housing starts” refers to the start of construction on a new residential housing unit.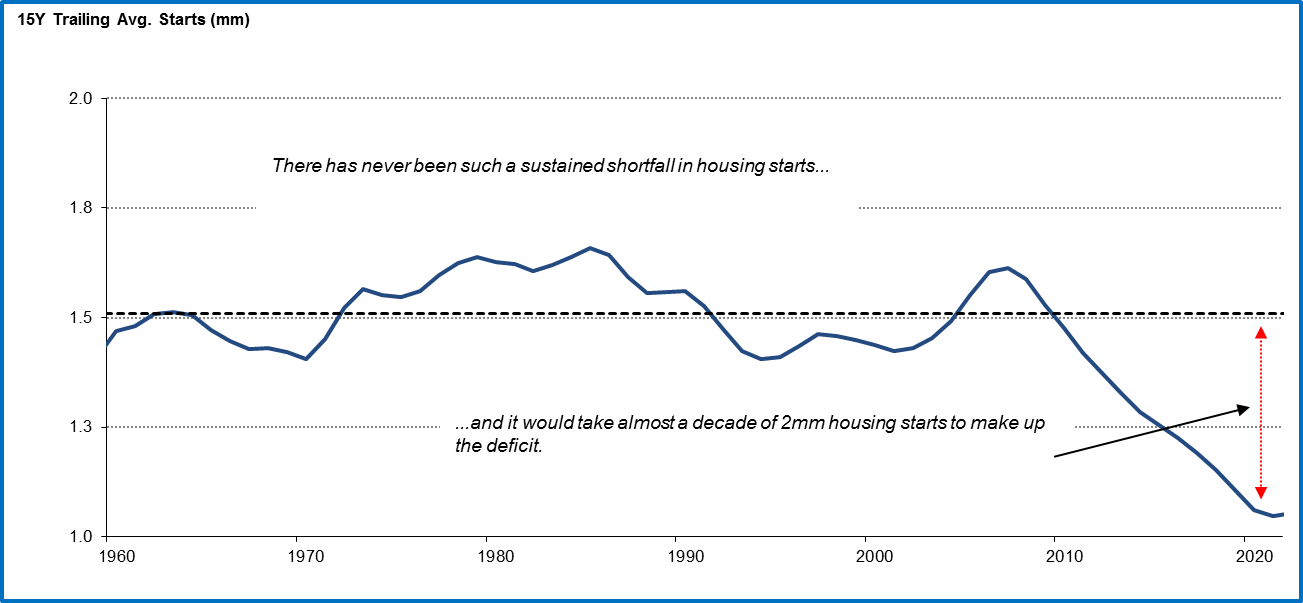
On the positive side, a number of our health care names outperformed, including drug maker Merck & Co. (MRK) and health product supplier Perrigo (PRGO). Benefitting from a best-in-class research and development team, Merck’s progress is being fueled by the impressive growth of its immuno oncology cancer drug, Keytruda.
The stock remains attractive at less than 12 times 2023 earnings. Meanwhile, Perrigo is the leading private label and branded drug manufacturer with a market share of approximately 70%. Consumers may not realize it, but the store brand Tylenol, Allegra, Prilosec, etc. that they purchase is likely produced by Perrigo. Having navigated through supply chain disruptions during the pandemic, management is aimed at growth and margin improvement and we see significant upside potential from here.
With nearly 45 years of experience and having been through numerous market cycles, we remain alert in this volatile environment. Our contrarian investment philosophy has always focused on finding attractively valued companies with internally driven earnings that can drive value for years to come.
Our long-term investment process looks forward to assess where a company’s normal earning power will be. In fact, it is often periods of uncertainty which create the best opportunities for our strategy. This leads us to stocks with management teams employing strategies that are durable and have sustainable businesses we want to partner with in our portfolio. The ability to have a long-term view is increasingly rare, but will likely determine our success.
Although there may not be a quick resolution to the current environment, we believe that stock prices will increasingly begin to discount the complex macro outlook. Patience will be tested and we must rely on our process, our resolve and our conviction. When the market senses uncertainty, equities fall sharply and in unison, without regard to fundamentals or an eye to the future.
As confidence returns, quality at an attractive price will likely outperform. At Sound Shore, we believe our portfolio is well positioned for trends that are liable to emerge, post-crisis. The table below outlines performance following steep market declines. The future may not repeat the past, however the opportunity for patient investors is potentially a good one.
Sound Shore performance results after crisis sell-offs:
|
2000 – 2005* |
2009 – 2014* |
3/31/20 – TBD** |
|
|
S&P 500 Index |
-6.60% |
159.43% |
51.70% |
|
Russell 1000 Value Index |
38.41% |
145.21% |
53.02% |
|
Sound Shore Fund (SSHFX) |
63.60% |
151.45% |
61.38% |
|
Sound Shore Fund (SSHVX) |
65.90% |
154.25% |
62.06% |
* 1/1/2000 – 12/31/2005 and 1/1/2009 – 12/31/2014
** Returns as of 6/30/22, gross of fees
Currently, our portfolio is attractively valued at an average twelve-month forward P/E ratio of 8.8 times versus the S&P 500 of 15.8 times and the Russell Value of 12.5 times. We appreciate your investment alongside ours and encourage you to reach out with any questions or comments.
Sincerely,
Harry Burn, III | John P. DeGulis T. | Gibbs Kane, Jr.
Co-Portfolio Managers, SOUND SHORE FUND
Editor’s Note: The summary bullets for this article were chosen by Seeking Alpha editors.
Be the first to comment