

Pgiam/iStock via Getty Images
In a prior article (here), we covered the long-term results of the 3X ProShares S&P 500 fund (UPRO); now we want to look at the ProShares 2X fund, SSO.
The ProShares Ultra S&P500 (NYSEARCA:NYSEARCA:SSO) is a leveraged ETF designed to earn two times the daily return of the S&P 500. Again, it’s important to clarify exactly what this means. This is ProShares statement concerning it:
This leveraged ProShares ETF seeks a return that is 2x the return of the S&P 500 for a single day, as measured from one NAV calculation to the next.
Due to the compounding of daily returns, holding periods of greater than one day can result in returns that are significantly different than the target return, and ProShares’ returns over periods other than one day will likely differ in amount and possibly direction from the target return for the same period. These effects may be more pronounced in funds with larger or inverse multiples and in funds with volatile benchmarks.
The aim as stated in the prospectus is to return two times the S&P 500’s daily return, compounded daily.
Long-Term Results
Due to this, a lot of short-term traders utilize it to trade the market for three-to-five-day trades in an effort to obtain a return that is three times that of the S&P 500. As long as the holding period of the trade is not more than two or three weeks, getting three times the performance of the S&P 500 is usually achievable.
However, as traders soon learn, many short-term deals that go against the trader end up as long-term investments, since it’s both difficult to accept a loss and hope never dies. So, what has been the long-term performance of this leveraged fund?
To measure results we chose February 6th, 2010 as the starting date since it allows us to compare all ProShares leveraged funds over the same time span. The outcome for SSO is shown in the chart below.
SSO compared to SPY since 2010 (Michael McDonald)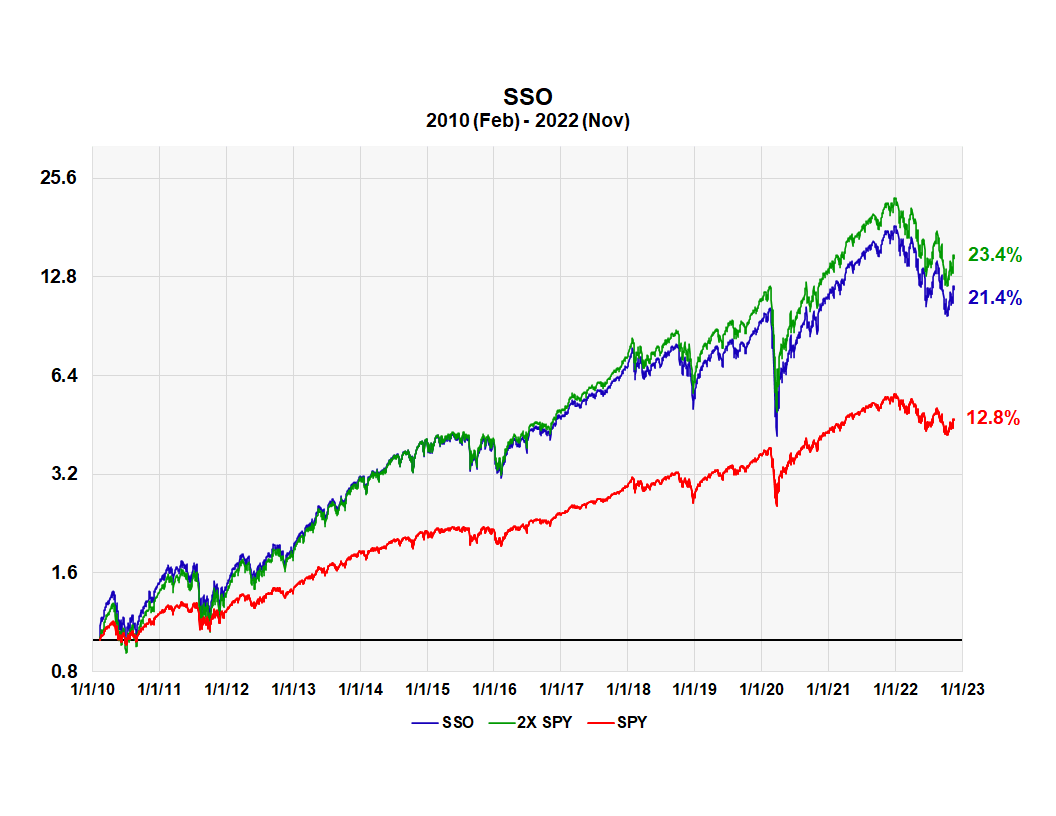
Without dividends the S&P 500 SPDR (SPY) had a total annual return of 12.8%, whereas SSO had a total annual return of 21.4%. This is 1.67 times the annual return on the S&P 500. The green curve is our proxy for doing 2X the daily return of the S&P 500, compounded daily. The annual return was 23.4%.
What does this mean dollar wise? A $1,000 investment in SSO on the start date would have increased to $16,200 by December 31st of last year. But there has been a bear market since that date; the $16,200 had decreased to $11,860 as of November 18th. Even so this is still quite a large return.
Much of this is due to the long bull market that started after the financial crisis of 2007 and 2008. This bull market has been very strong, and the results are fairly remarkable based on the graph. But, as the motto says, never mistake brains for a bull market. So, how has SSO performed with a closer starting date, one that included the COVID and current bear markets?
SSO through two bear markets
To see how SSO did through two bear markets, we set the start date to January 1, 2020, just before the start of the COVID-induced bear market. The results are shown in the following graph.
SSO and Spider over two bear markets (Michael McDonald)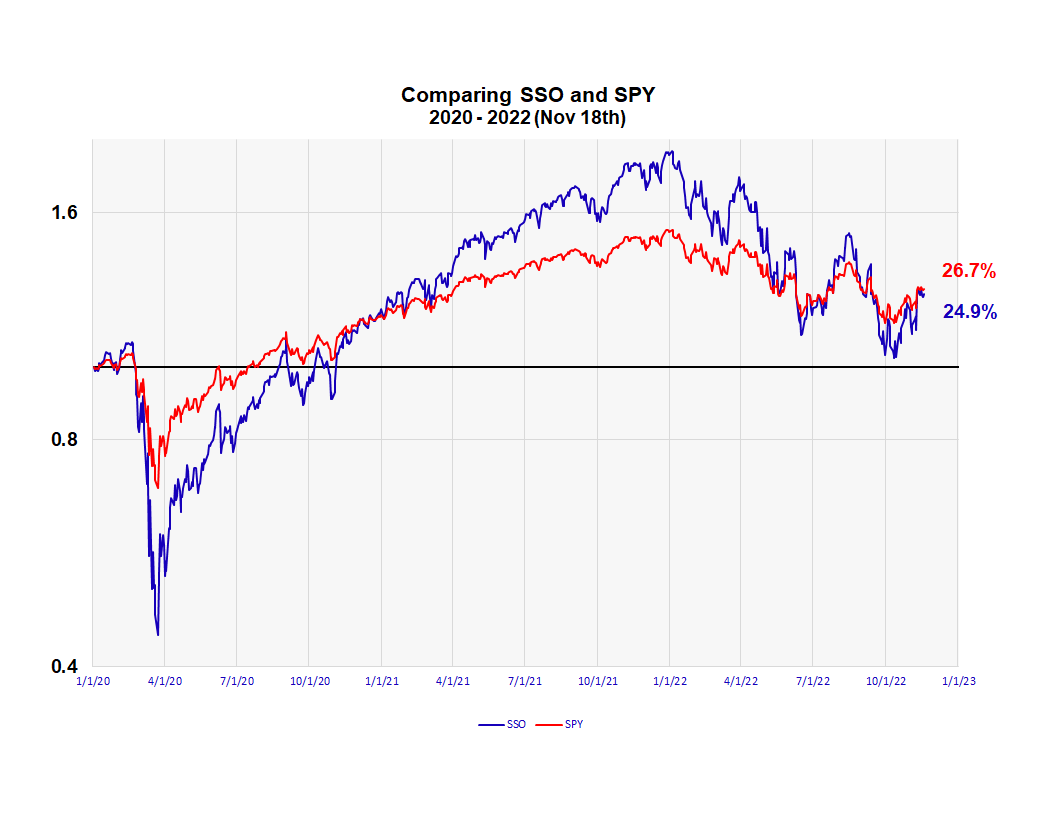
The 2020 COVID-induced bear market was followed by such a robust comeback that the S&P 500 SPDR’s overall return through the almost three-year period is up 26.7%. The highly leveraged SSO earned a corresponding 24.9% return. While it’s a far cry from two times, or even 1.67 times the SPDR’s return, it is still a decent return.
Why we think SSO is currently a long-term buy
We view SSO as a long-term buy as long as investors are able to resist the large, daily, price fluctuations. We currently think it’s a buy because we view the entire market as a long term buy due to the extreme levels of bearish pessimism this bear market has generated through the summer in almost every sentiment indicator. We’ve detailed this and the theory behind it since June in the following articles: (here), (here), (here), (here), (here), (here) and (here).
Sentiment also shows up in a positive way in the tremendous amount of buying the ProShares 3X fund TQQQ, as explained in this article (here). History shows that major market lows seem to occur when the number of shares outstanding in TQQQ rise dramatically as they are doing now.
Summary
Traders in SSO should realistically anticipate achieving 2X the return of the S&P 500 over any short-term trade, barring unusual market conditions. Investors can anticipate about 1.6 times the long-term return of the S&P 500 over an extended time period. But they will face significant dangers and emotional strain nearly every day while traveling that path.
Be the first to comment