

_ultraforma_/iStock via Getty Images
The S&P 500/SPX (SP500) has surged by approximately 18% since cratering to 3,640 in June. Now that the SPX and stocks, in general, have had such a remarkable rise in such a short time frame, many market participants are asking whether this is a new bull market. The short-term returns have been so compelling that investors are chasing their stocks now, fearing missing out on more stellar gains. However, before we go “all-in,” we should consider several critical factors. The first is that the bear market may not be over but could be on hold.
Consequently, we could be looking at a powerful countertrend rally now that may end in the fall. The Fed is still raising interest rates, and inflation remains exceptionally high. Moreover, the economy recently entered an “official recession,” and it isn’t clear how deep the downturn will be or when it will end. Furthermore, many corporate profits have dropped and could continue declining into year-end. Also, we have not witnessed the hallmark signs of a technical bottom. Therefore, we will probably see the SPX and stocks, in general, post further declines in the fall, bringing the stock market down to a W-shaped bottom or possibly to new lows before the “ultimate” bear market bottom materializes.
Technically, Where Is The Bottom?
SPX (StockCharts.com )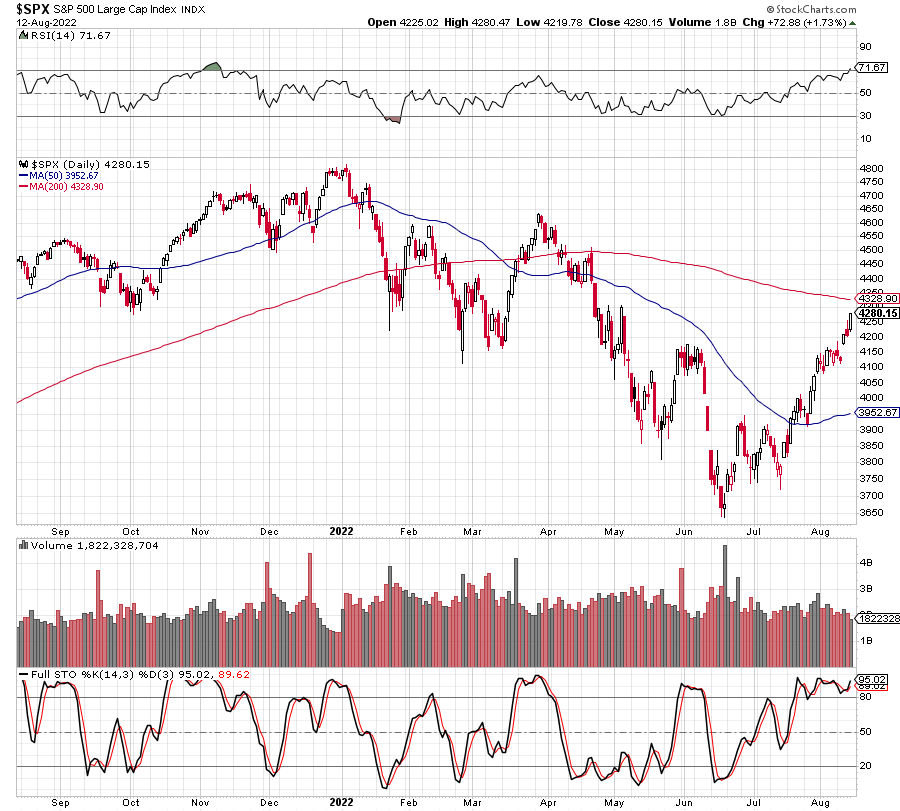
We’ve seen a substantial rally off the lows. This surge is the move we’ve discussed for weeks since the June lows. In a mid-June Prophet Report, I called the recent bottom at the 3,600-3,650 support level. Since then, the stocks I’ve mentioned and the stock market, in general, have done very well. However, the ultimate low probably has not been achieved yet. As my June bottom article discussed, we are likely dealing with a countertrend rally. We can move a bit higher in the near term, but the 4,300 – 4,500 resistance zone may be the current ceiling for the stock market.
We have not seen the hallmark technical signs of a long-term bottom yet. While many tech stocks and other high multiple names experienced substantial declines, the SPX selloff has been orderly, for the most part. Even the steep drop down to the 3,640 low didn’t involve remarkably high sell volume or a deep sense of panic in the marketplace. Instead, we saw the RSI touch down on the 30 level, accompanied by high sell interest but no capitulation or a meaningful sense of panic we would like to see during a long-term bottom. Pessimism didn’t appear to reach a maximum, and it is doubtful that a sustainable long-term bottom has been reached.
We’re seeing SPX approaching critical resistance in the 4,300 – 4,500 zone, and with the RSI above 70, the market is becoming overbought. Additionally, we have the 200-day MA resistance coming up around 4,330. The full stochastic has been above 80 for several weeks, the most extended period since the November top. There are other concerning technical and fundamental factors here. The market is getting substantially overbought, offering limited upside potential in the near term and could reverse, heading lower in the coming weeks.
Why The Market Is Rallying
The Technicals
Markets can’t move in one direction. We saw significant selling from the start of this year to mid-June, with the SPX declining by 25%. The market became moderately oversold, and we received several supporting factors for a near-term move higher.
The Fed
Fed expectations became skewed to one side and were too hawkish. It became evident that the Fed probably can’t raise rates much more with the economy in or near recession. The expectation of fewer rate hikes and a more dovish Fed created a powerful tailwind for stocks in recent weeks.
The Fed (CMEGroup.com)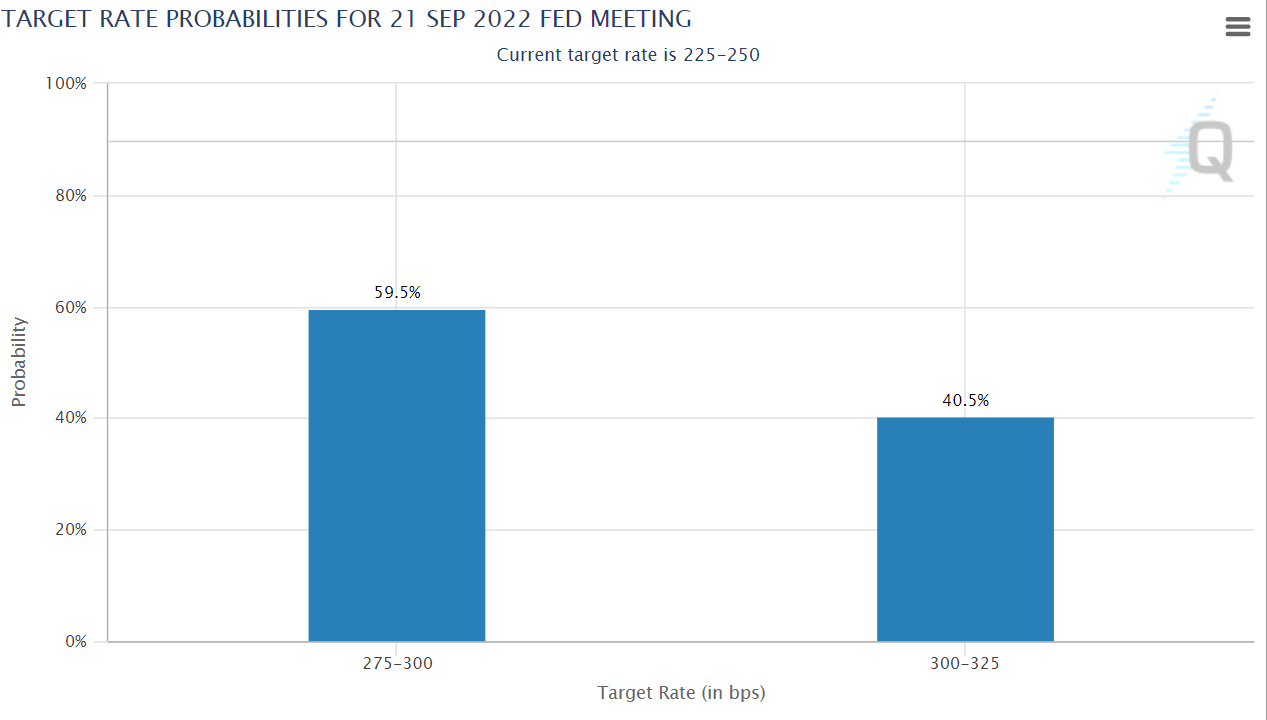
There is a higher probability (60%) for a 50 basis point hike at the September meeting, which is still about 37 days away. This Fed image implies that the rate of interest hikes is decreasing. Therefore, the market is optimistic relative to risk assets in the near term.
Inflation
Inflation may have peaked, for now. We saw a 9.1% inflation print for June, remarkably high. However, last month’s inflation came in at 8.5%, lower than anticipated.
CPI (Tradingeconomics.com)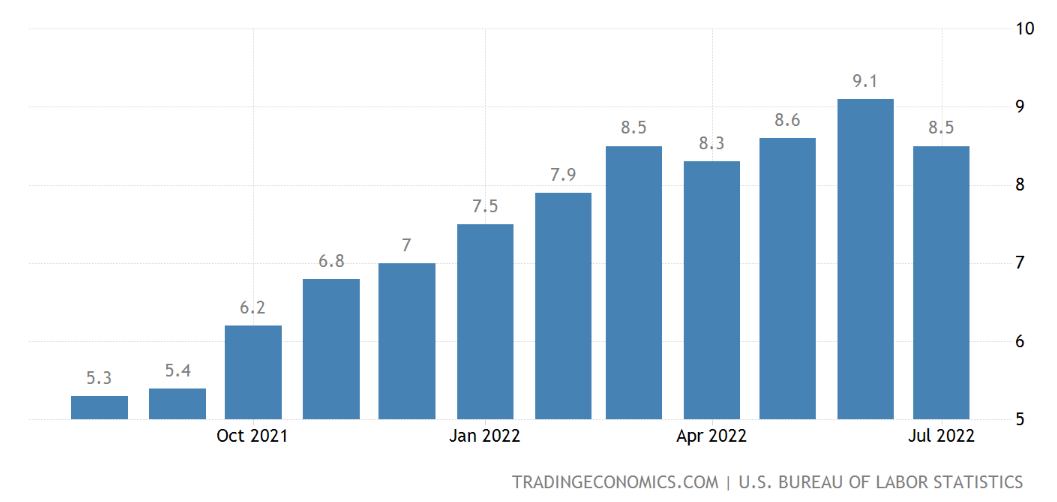
Lower inflation implies that the Fed can afford to be less hawkish, a bullish dynamic for stocks in the near term. While this level of inflation is still abnormally high, a slowdown in inflation growth is an encouraging factor. While it is unclear whether the constructive trend will continue and is sustainable, the market likes it and is reacting well.
Economic Data
We’ve seen encouraging economic data in recent weeks. Despite being in an official recession, much of the economic data remains better than anticipated. We can use the latest nonfarm payroll report as an example.
Employment (Investing.com)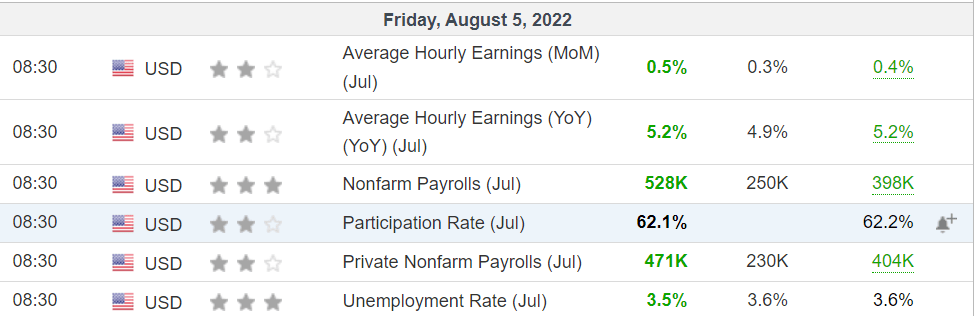
We see the robust data as the nonfarm payrolls number came in more than 100% above estimates. Private nonfarm payrolls also beat estimates by more than 100%. Moreover, we saw higher than anticipated wage growth, and the unemployment rate fell. We see similar data points considering other economic readings also. Therefore, despite the recession, pockets of the economy continue to perform well.
Earnings Season
Additionally, corporate earnings came in better than expected, culminating in a relatively strong earnings season for corporate America. The corporate results reported over the last weeks have been stronger than anticipated. We’ve seen a beat rate of approximately 75-80% throughout recent weeks, illustrating remarkable resilience among big businesses in America. These stronger-than-expected results have enabled stocks to push higher and higher in recent weeks.
The Bottom Line: There’s More Downside Ahead
We have not seen anything resembling a significant reset in valuations yet. Stock valuations remain relatively high in many cases. Furthermore, we continue seeing persistently high valuations while the economy is in a recession, and we may see more earning declines in the coming quarters, further exacerbating the valuation dynamic. Moreover, the Fed is still raising interest rates, and the economy is slowing. Furthermore, it is unclear how deep the downturn will run and how long it will take. While the market looks optimistic that we will see a quick and shallow dip into negative growth territory, I am not so confident. The economy has grown accustomed to ultra-loose money, and the Fed will tighten further as we advance. We’ve seen back-to-back 75 basis point increases, and next month The Fed will likely raise by another 50-75 basis points. With next month’s increase, the benchmark rate will be around 3%, and that’s when the economy should slow more considerably.
Inflation is still exceptionally high (8.5% CPI), and the Fed should continue raising rates until we reach an appropriate inflation target, presumably 2%. Therefore, growth could decelerate quite quickly, and if the economy is in a recession now, the downturn will probably run quite deep. We should feel the next leg of the slowdown this fall. We should see worsening economic readings (including employment) coupled with weakening corporate results during this time frame. The dynamic of rising interest rates, fears of a deepening recession, worsening economic data, and poor earnings announcements should coincide with another down leg in the markets. The coming downturn should lead the SPX back down to the 3,800 – 3,600 and possibly to new lows.
Shiller P/E Ratio
Shiller P/E ratio (multpl.com)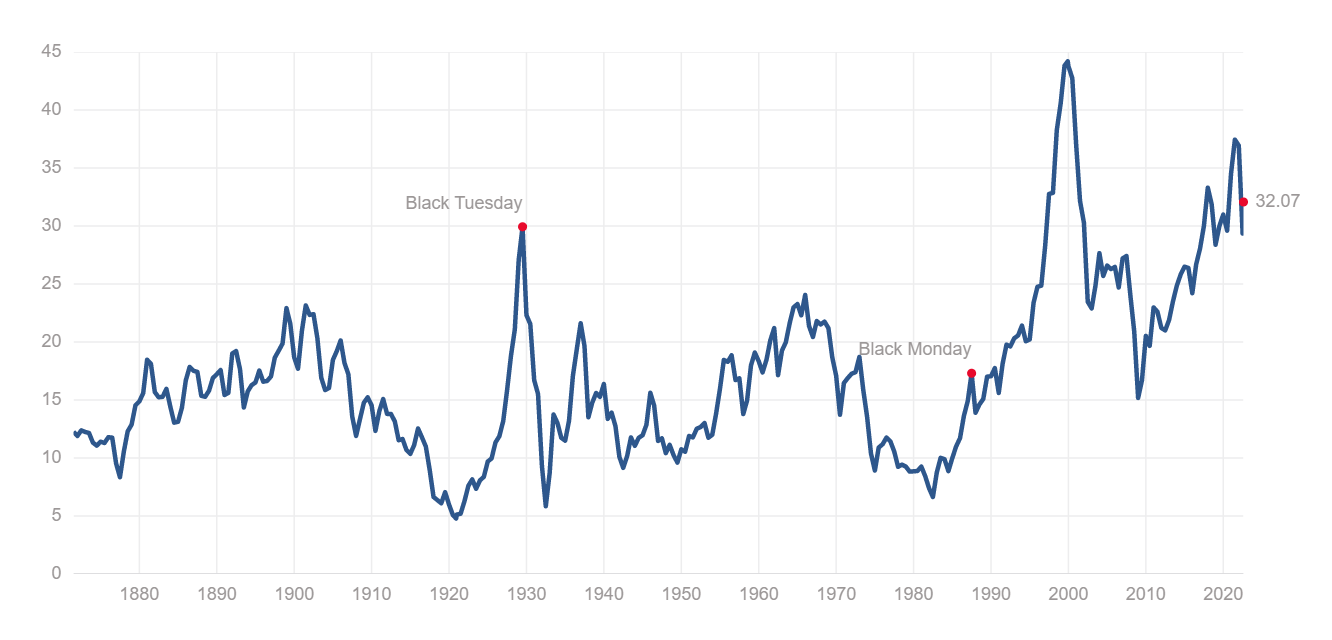
We see that the Shiller P/E ratio recently hit a high eclipsed only by the wild valuation days of the dot-com bubble. While the Shiller P/E ratio has retreated modestly from its recent high, it is still floating around 32. This elevated point is above the days of the 1929 bubble. 32 is also much higher than the valuations we saw in the mid-2000s before the financial crisis of 2008. The CAPE (Shiller P/E) adjusts for a ten-year earnings average and inflation, making it the preferred valuation gauge when looking at longer-term trends in the market.
We’ve seen the Shiller P/E ratio trending higher and higher since 2009. However, provided that the Fed is tightening monetary policy, we should see a more pronounced decline in the Shiller P/E. Also, it will likely take longer than several months for the reset to run its course. The long-term median Shiller P/E ratio is only about 17, and while we may not see it get that low, a 20-25 Shiller P/E ratio on the SPX is plausible. A 20-25 Shiller P/E handle implies that the SPX could decline by another 20-35% from current levels, putting the possible “ultimate bear market bottom” around 3,400 – 2,800 (bearish case outcome).
Be the first to comment