

Up or down, that is the question. shapecharge
I. Probability of a Market Decline
Based on the last 95 years of daily equity market returns, no matter what day you decide to invest in the market, there is an 80%+ probability that you can buy for less within the next month, 90% within the next year, and a 93% probability you can buy for less within the next 5 years, See Figure 1.
Author
Unfortunately, the odds change drastically with time constraints and a minimum decline magnitude. Figure 2 shows the probability of buying for 5% less within the next year falls to 50%, and the probability of getting in for 10% less than today falls to 31%.
Author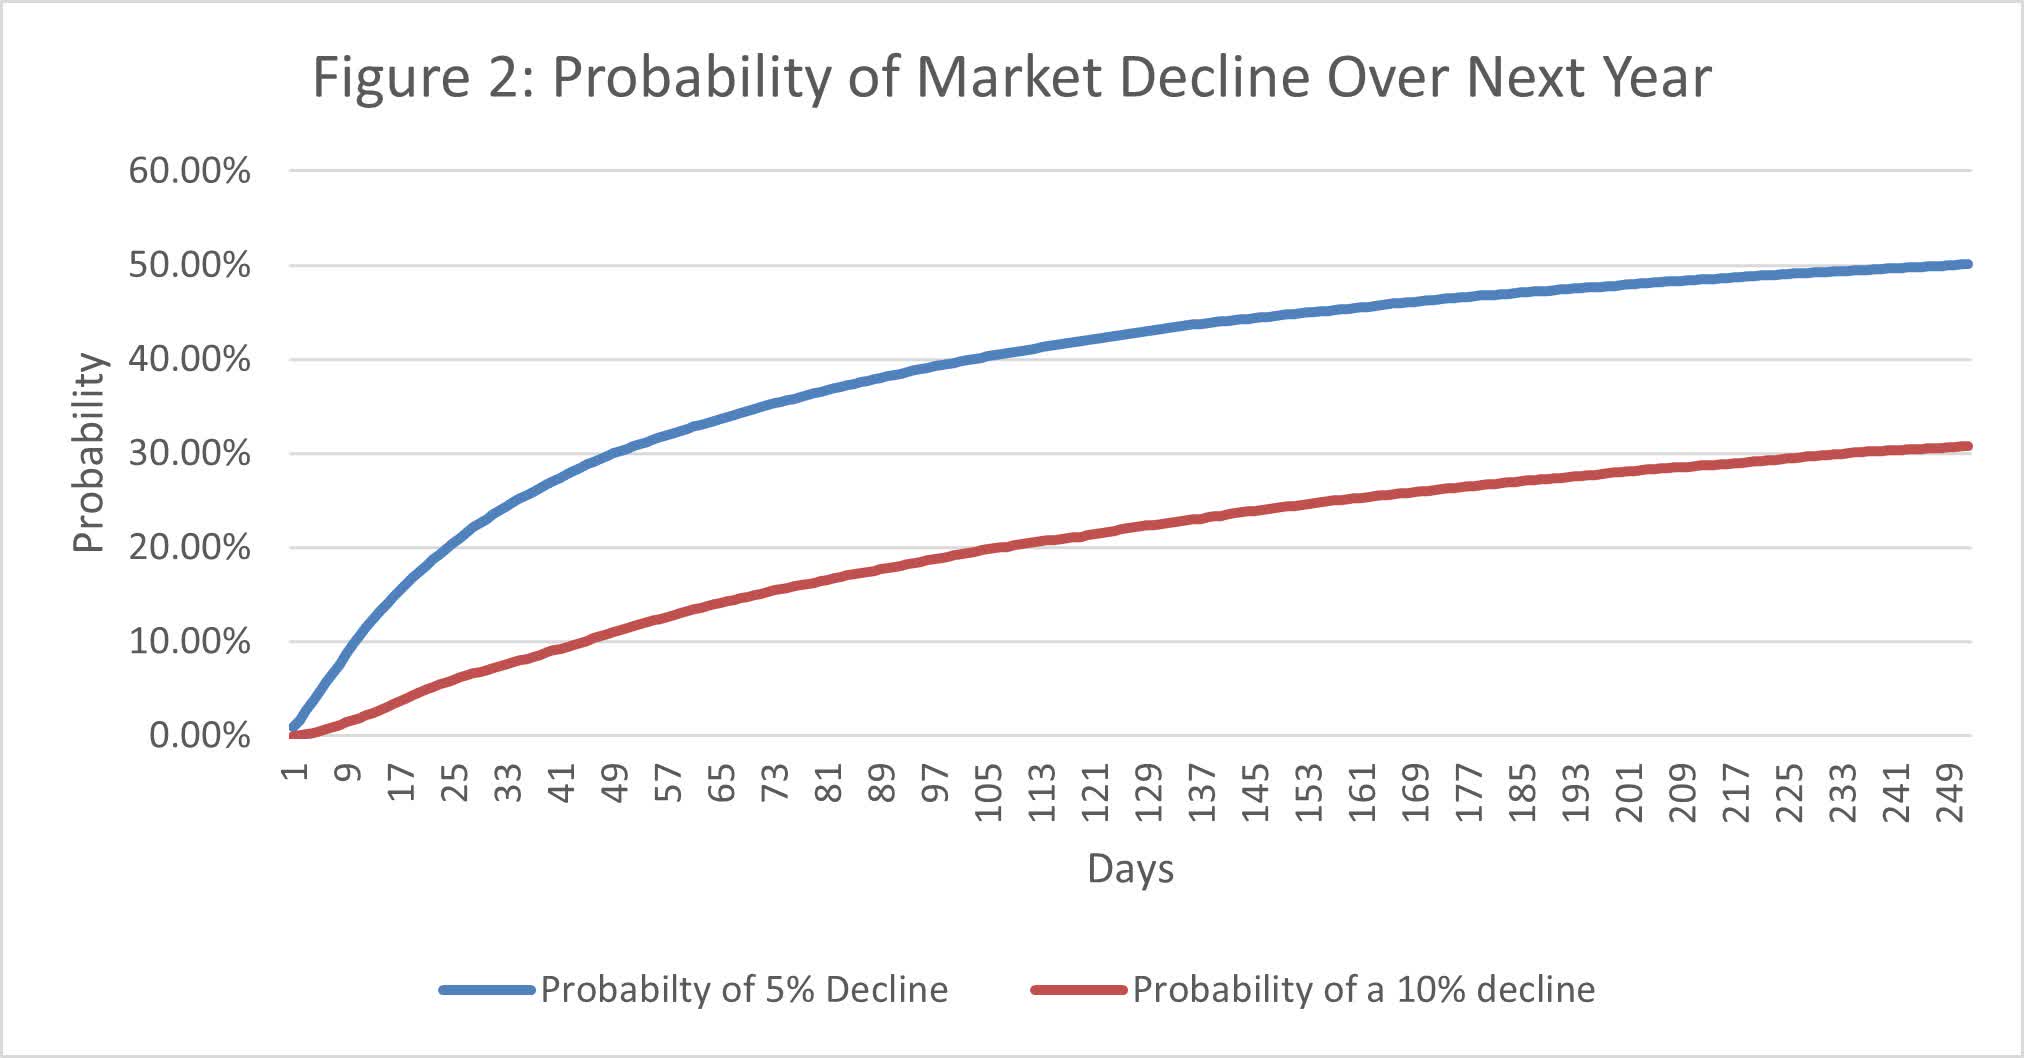
Thus, if there is only a 50% chance of saving 5%, why wait? There must be a reason so many investors are always getting in and out of stocks when they think they are under or overvalued. The answer is simple and alluring. Theoretically, profits from correctly timing the market are virtually limitless.
II. Value of Being Right
To demonstrate, assume over the last 20 years (Jan. 1, 2002 through Dec. 31, 2021) you have perfect foresight and each day you always have your money in either t-bills or the market, whichever does best that day. Starting with $1, by the end of 2022, your investment would have accumulated to $1,126,140,548 compared to a buy-and-hold strategy accumulating to $6.06. That’s over $1 billion versus $6.
Timing outperforms buy-and-hold 183.5% to 9.4% a year. Of course, being right every day is something only “The Gambler” (aka Kenny Rogers 1978/1980 song/movie) or your spouse might be able to do. However, one doesn’t need to be correct every day to see spectacular returns. If you pick one day in 10 and know if you should stay in or get out that day, your accumulated wealth is $41.06 and if you just trade once a month and know for certain whether to stay in or get out that day, you would have accumulated $15.48, See Table 1. These days aren’t “cherry picked,” just a random day.
Table 1: Cumulative value of $1 from Jan. 1, 2002 to Dec. 31, 2021
Author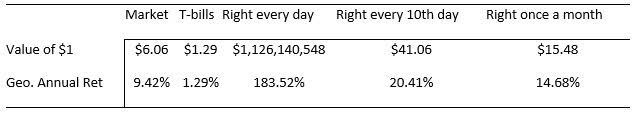
With such spectacular wealth available, correctly timing the market is alluring to say the least. As another example, over the past year ending Oct. 11, 2022, the S&P 500 has lost 16.5%. The worst 10 days is responsible for all that loss and more. Figure 3 shows if you had managed to avoid the 10 worst days, you would be up 19% instead. Of course, if you missed the 10 best days, you would be currently down -36%. Thus, the cost of being wrong can more than offset any joy from being right.
Author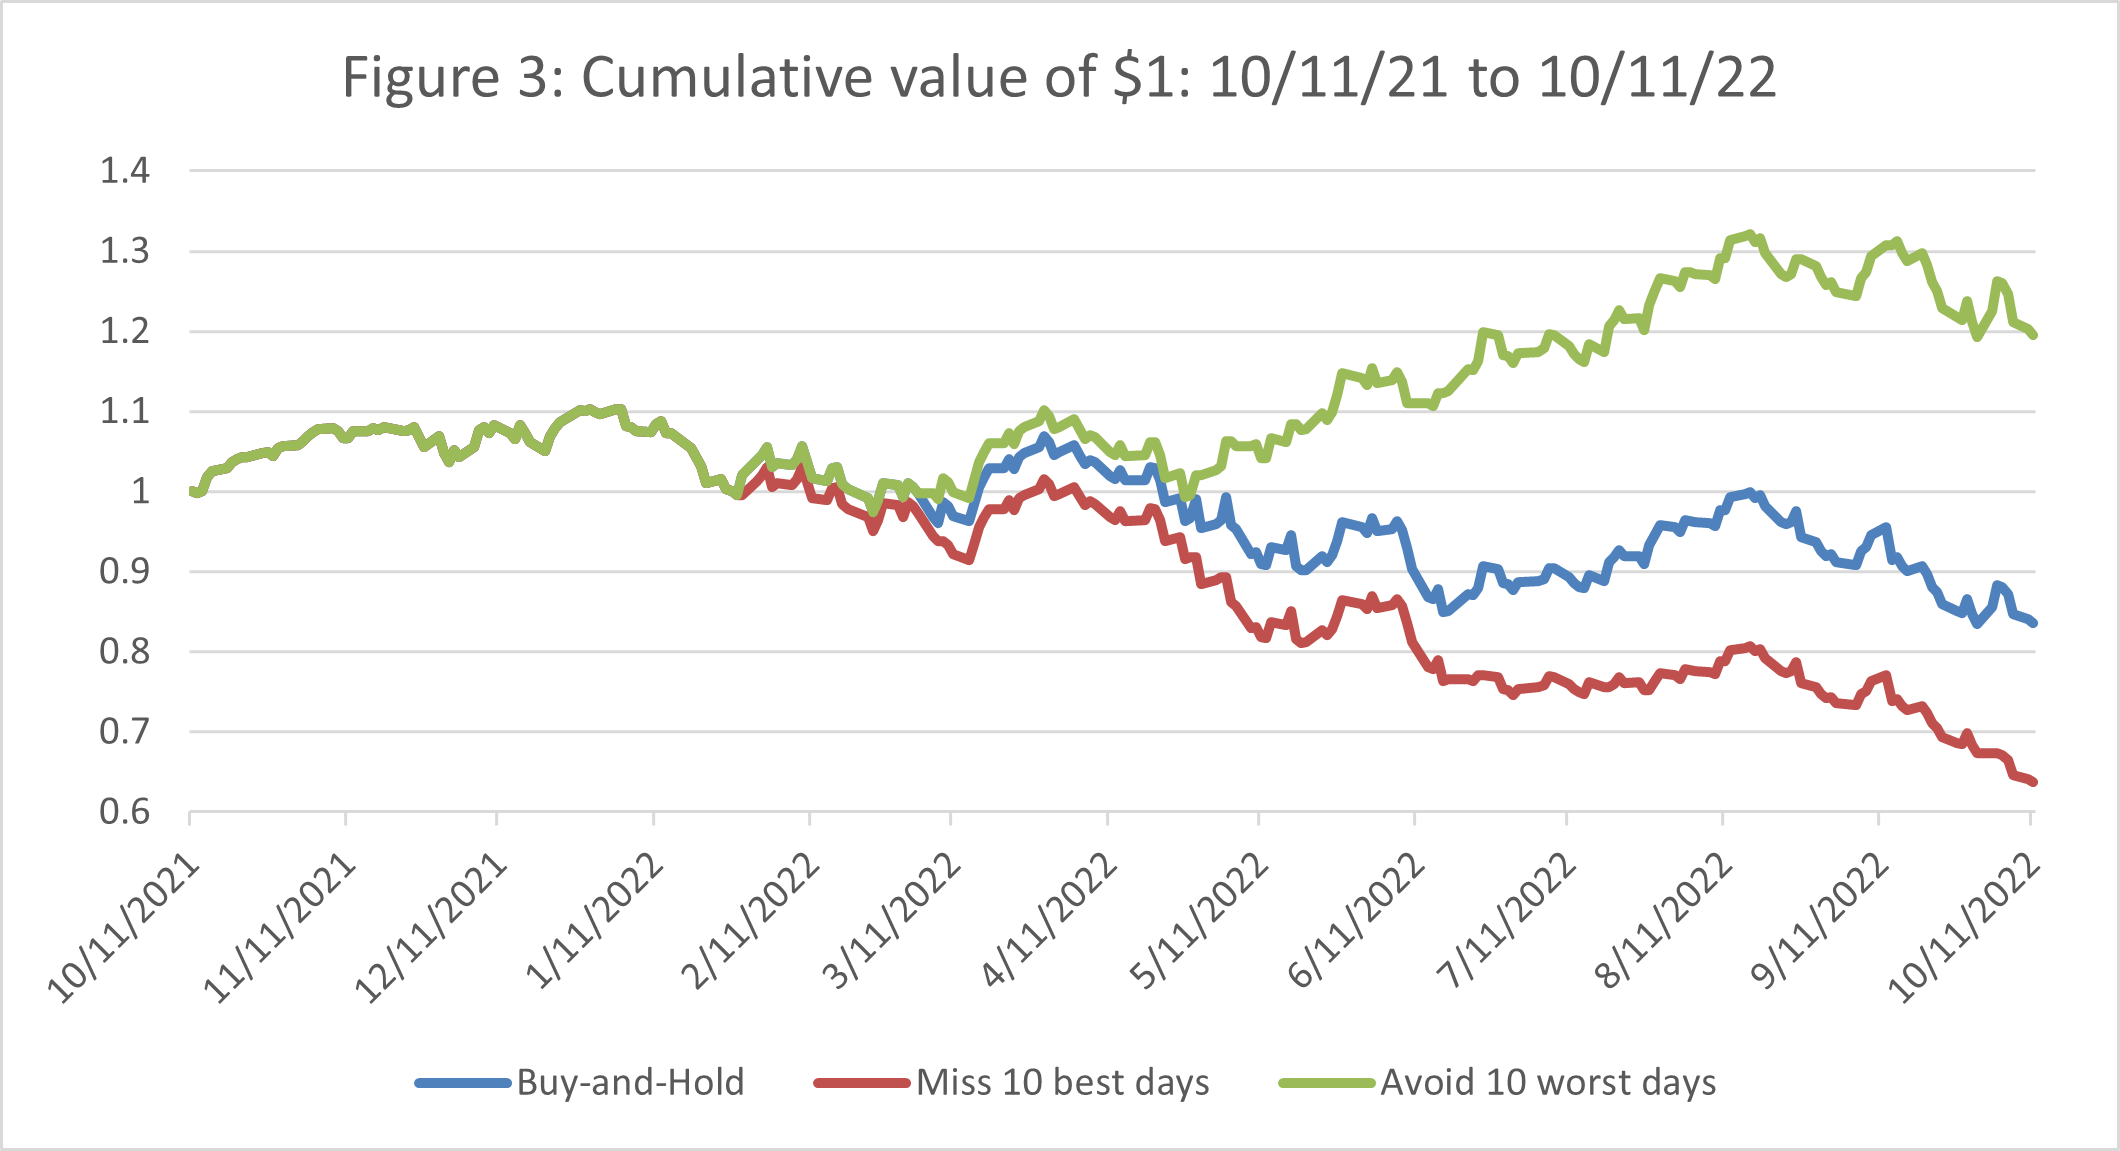
III. Cost of Being Wrong
What happens when an investor decides to wait for the market to decline and it doesn’t? Table 2 shows the returns for when the market doesn’t decline at all, doesn’t decline 5%, or never falls 10% based on daily data from 1926 to 2021. The problem with waiting is if you think it is overvalued 10% for example and it goes up, you are unlikely to admit you are wrong anytime soon and in the interim, you will miss out on gains much greater than the 5 or 10% you were trying to save to begin with.
As an example, there is a 50% chance the market doesn’t decline 5% over the next year. If it doesn’t decline 5%, on average it is up 28% with a maximum possible opportunity loss of 121%. After 3 years, the average gain is 64.5% (not annualized). Thus, an attempt to save approximately 5% can be quite expensive if an investor ends up being wrong.
Table 2: 1, 2, and 3-year return from any given day if market never declines, never declines 5%, or never declines 10% based on 1926 to 2021 data.
Author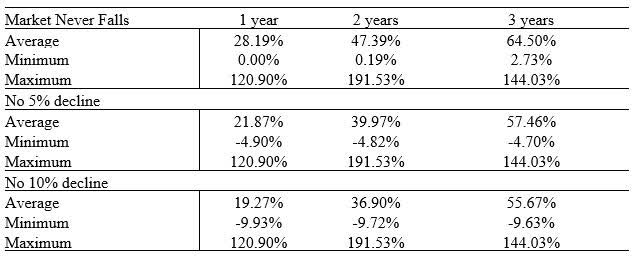
From a strictly mathematical perspective, the expected value is slightly more complicated because if the market does fall 5%, the investor enters the market and not only saves 5% but attains the return going forward for the rest of period. Table 3 gives the expected values for attempting to save 5 or 10%. In general, trying to save 5% is less costly then trying to save 10% while waiting up to 3 years to save 10% can cost up to -18% in expected value. However, some of this cost can now be offset while sitting on the sidelines as T-bills are finally yielding something more than barely above zero.
Table 3: Expected value of trying to time a 5% or 10% decline. Calculation is probability of decline times (percent saved plus return of market after entrance) minus probability of market not declining times return of market if it did not decline.
Author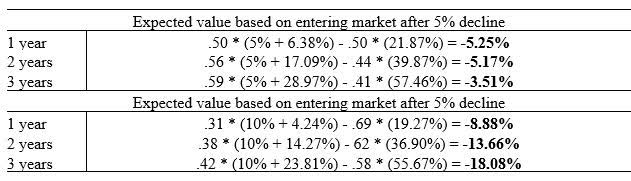
IV. Probability of Timing it right
Although the value of timing the market can be theoretically massively remunerative, failure is also costly so the probability of timing it right also needs to be addressed. Bauer & Dahlquist (2001, 2012) show that a simple buy-and-hold strategy outperforms 99.8% of any possible asset allocation switching strategies between the market and treasuries. They go on to show that an investor would need to be able switch correctly 66% of the time on a monthly basis to outperform a buy-and-hold strategy. Drew (2006) finds a similar high hurdle rate of 70% using Australian data.
The problem is you must time the market twice, getting out and when to get back in. Getting back in can be especially difficult if you are wrong. First, you must admit you are wrong, and now buy in at a price even higher than when you thought it was overvalued to begin with.
In any given year with monthly switching, there are 4,096 permutations. Table 4 shows the percentage of permutations that beat buy-and-hold each year and the average return of strategies that beat buy-and-hold.
Table 4: Probability of outperforming buy-and-hold, 2010 through 2021.
Author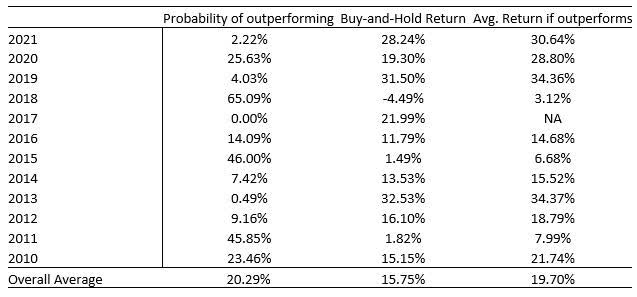
Obviously when the market is down, the probability of outperforming is quite high but on average over the last 12 years, the probability of randomly finding a strategy that works is only 20% with a range between 0% and 65%. This matches up well with the number of large cap equity funds that outperform the S&P 500 which averages approximately 20% in any given year. Furthermore, even if you did happen to find a successful strategy, the outperformance is less than 4%, 19.70% compared to 15.75%. Over the last two years, only 7% of more than 16 million paths outperformed buy-and-hold. The longer the time frame the smaller the probability any particular path will outperform buy-and-hold.
V. Final Thoughts
It’s likely no amount of data, evidence, or persuasion will keep investors from attempting to time the market. The gains from correctly timing the market are just too tempting. However, it is difficult to be successful not only for how often one has to be right, but because one has to make two good decisions, when to get out and when to get back in. If you just can’t resist, I suggest a “play” account (5 to 10% of your portfolio) to satisfy the “I’m smarter than the market” urges. If you really are the next market guru, the 10% will soon become 20%, etc. There is certainly wealth to made by successful timing, but as Peter Lynch of Fidelity Magellan Fund fame once said, “Far more money has been lost by investors trying to anticipate corrections, than lost in the corrections themselves.”
Be the first to comment