

Ratchapon Supprasert
Thesis
This article looks at some signs – both technical and fundamental – that the S&P 500 Index (SP500) is likely to continue its mid-term downtrend and keep reversing to the downside shortly. Accordingly, SPDR S&P 500 Trust ETF (NYSEARCA:SPY) should also follow the core index in this case.
Why do I think so? Some indirect signs of a widespread reversal
I can well understand those who are skeptical of technical analysis – by and large, this is more of an art than a science, and everyone knows it.
Agree – all it takes is to attach a superimposed index chart with support and resistance levels and say something like: “Look, SPY is going to bounce off its long-term [200/100-day period] moving average!” Here is the chart I would show you:
TrendSpider, SPY, author’s notes
If I were a technical analysis analyst – a CMT or something similar – I would describe this chart something like this:
The S&P 500 Futures (SPX) hit the 200-day simple moving average and bounced off it on January 18. A similar rejection was observed in 2022: April 21, August 16, December 1, and 14. Almost always, “the true rejection” – the one that really led to the subsequent meltdown – was accompanied by increased trading volumes. On January 18, we saw exactly the same picture – SPY volumes were about 13.5% above 200-day averages. Focusing on vertical volumes, we see that the next major level for SPY, having recently broken through $395.5, is $380.5, after which the level at $365 is next of importance. The RSI has also bounced off the 60 mark and is now hovering around the 52 mark – so SPY is far from being oversold.
All of this is superimposed on the poor January seasonality of SPY – over the past 20 years, the mean and median change in the instrument have been -0.22% and -0.04%, respectively. January is actually the second worst of the 12 months of the year (over the last 20 years):
TrendSpider, SPY’s seasonality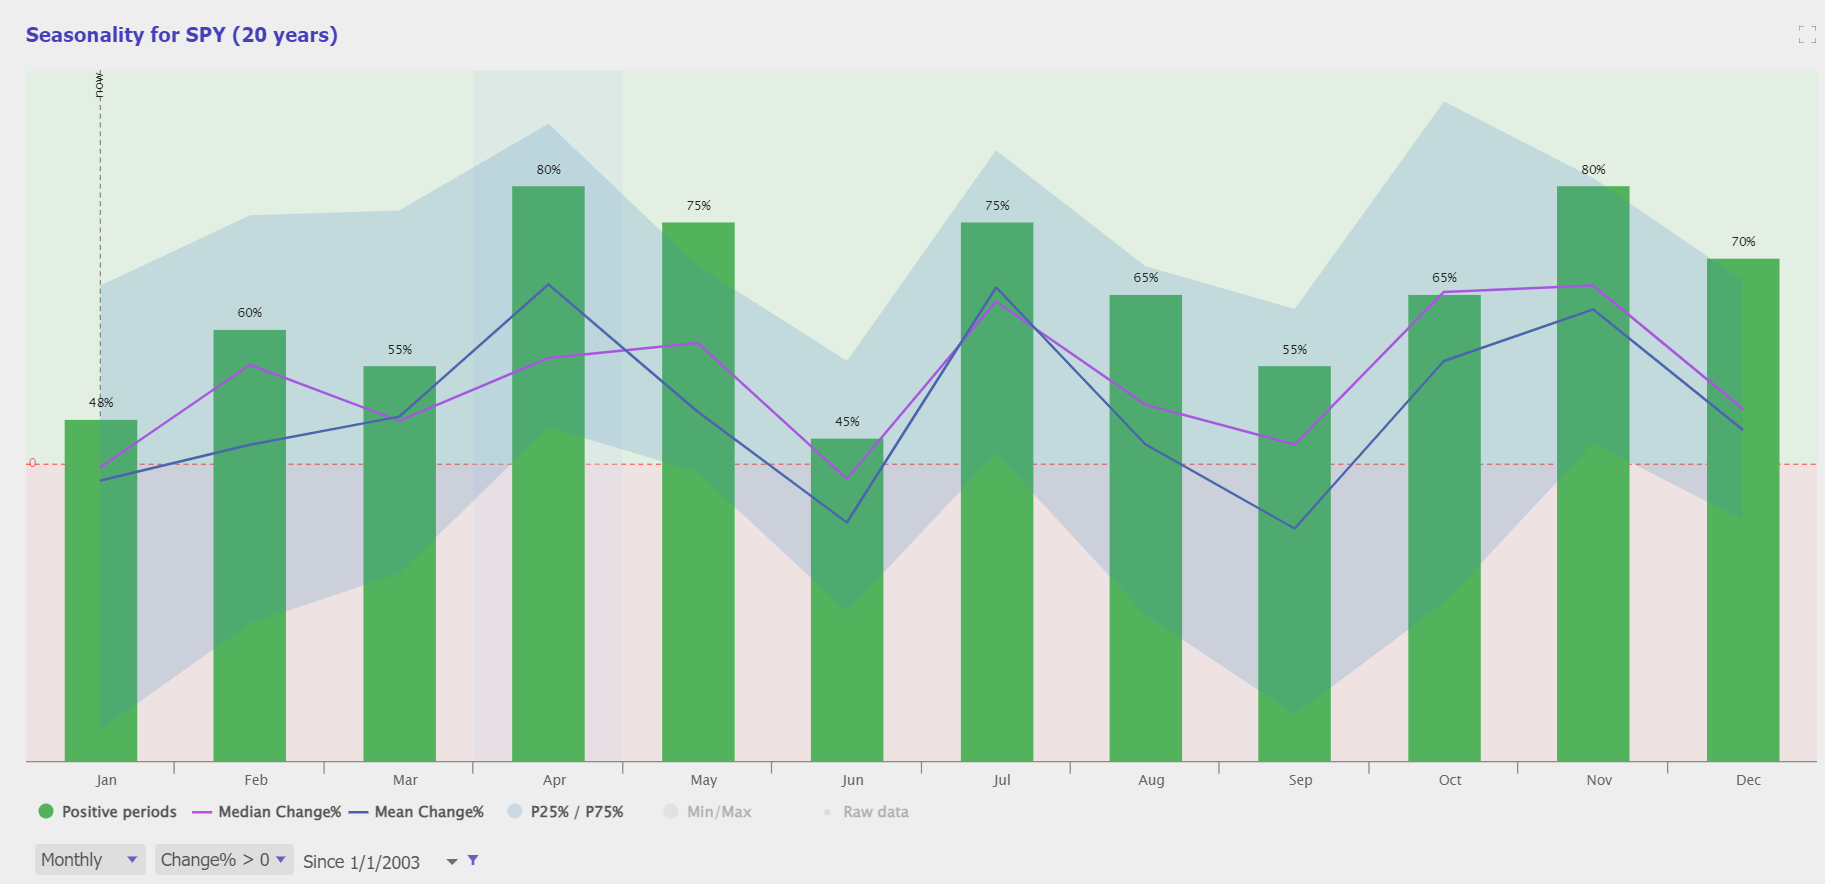
So, in terms of history and technical trends, SPY is currently in a very negative setup.
But that would be too simple… Anyway, I have found some signs that qualitatively complement this finding.
I have the impression that some people forget that the index should be considered complexly, through its components, and not only through seasonality or technical indicators in the chart.
I decided to conduct an experiment and test a small hypothesis. Since the beginning of the year, SPY is up 2.8% – great, which means that the entire broad market and many risky assets are up due to the leverage/beta effect of this change. If we are truly seeing further rejection and continuation of the medium-term downtrend, then there should be signs of this in a large number of stocks within the index (and not only). As one such sign, I have chosen a bearish RSI divergence setup characterized by an RSI correction against the backdrop of the instrument’s growth.
A bearish divergence occurs when the RSI creates an overbought reading followed by a lower high that appears with higher highs on the price. As you can see in the following chart, a bullish divergence was identified when the RSI formed higher lows as the price formed lower lows.
Source: Investopedia
If there are many stocks in the market with such a setup, it means that the current uptrend of the broad market is starting to fizzle out. Below is a table I have compiled based on the results of TrendSpider’s screening tool – to be fair here in my assessment, I have also included the results of screening for bullish RSI divergence in the table.
| Group of stocks, by market cap [otherwise stated] | RSI bearish divergence, # of stocks | RSI bullish divergence, # of stocks |
| $300M-1 billion | 34 | 0 |
| $1-3 billion | 14 | 0 |
| $3-10 billion | 22 | 1 |
| $10-20 billion | 22 | 0 |
| $20-50 billion | 7 | 0 |
| $50-100 billion | 1 | 0 |
| $100-200 billion | 0 | 0 |
| >$200 billion | 0 | 0 |
| ARK Holdings, all | 3 | 0 |
| NASDAQ 100 Index | 2 | 0 |
| S&P 500 Index | 6 | 0 |
Source: Author’s selection, TrendSpider Software.
That is, the market is feeling a widespread weakening of its short-term uptrend at this point – this is especially true for the small-cap stocks, but we also see several such examples for the S&P 500 Index itself. This is the first sign that no one is talking about yet.
The second sign to watch for is reversal patterns. Assuming that the uptrend is only gaining momentum, there should still be stocks in the market that should show signs of MACD reversal after a long selloff. I like to look at MACD crossovers:
Stockcharts.com, author’s notes
To this simple crossover, I would add another screening criterion – the distance to the moving average (i.e., MA dist). This addition indicates the potential for a possible mean reversion. Here’s what I got as an output:
| Group of stocks, by market cap [otherwise stated] | MACD daily + MA dist, # |
| $300M-1 billion | 1 |
| $1-3 billion | 0 |
| $3-10 billion | 0 |
| $10-20 billion | 0 |
| $20-50 billion | 0 |
| $50-100 billion | 0 |
| $100-200 billion | 0 |
| >$200 billion | 0 |
Source: Author’s selection, TrendSpider Software.
Only one instrument out of thousands of stocks and exchange-traded funds (“ETFs”) showed a pattern indicating a highly likely bullish reversal shortly. Wondering what that instrument is? It is the iPath Series B S&P 500 VIX Short-Term Futures ETN (VXX):
TrendSpider, author’s notes
Moreover, the chart of VXX looks indeed quite bullish:
TrendSpider, author’s notes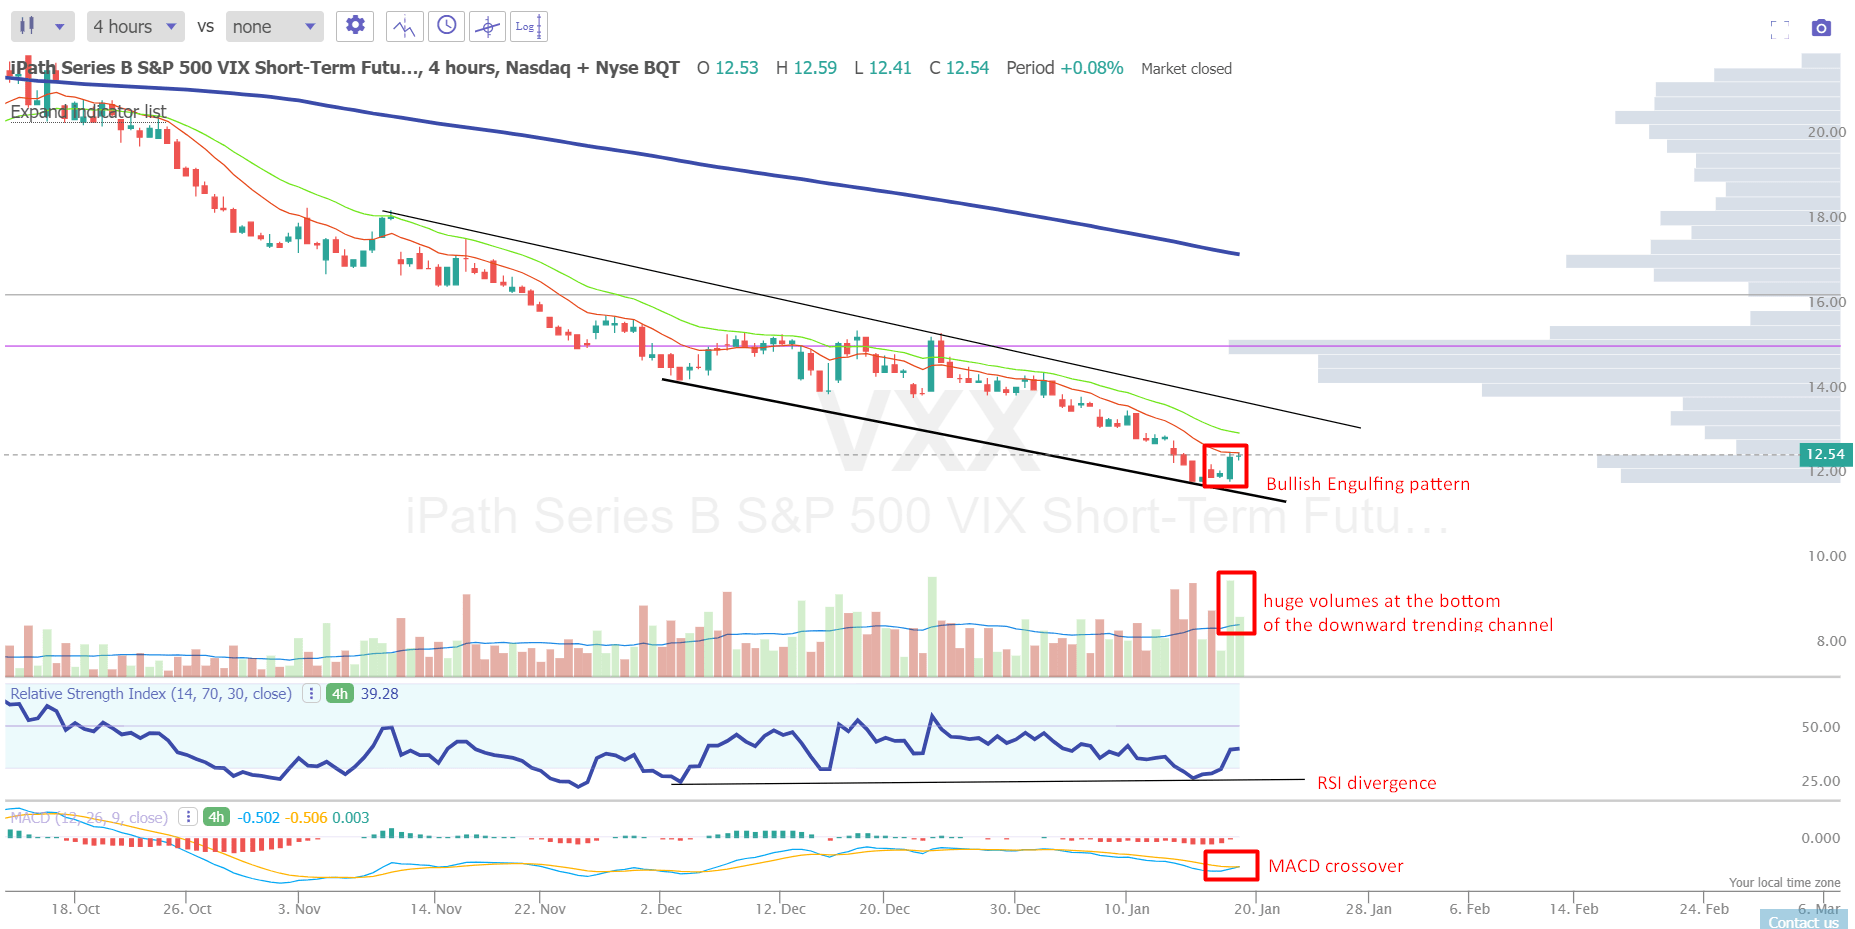
Intermarket analysis shows how precarious the dynamics of SPX and SPY are now.
Now the reporting season is in full swing, and judging by some leading indicators, we can most likely hear words of concern from management teams about the growth potential of their companies’ future earnings – this can only affect SPY, which prices in EPS growth for the full-year 2023 of about 13.15% YoY:
NASDAQ
One of these leading indicators is Nordea’s global liquidity indicator, which has already managed to fall below the lows of earlier crisis periods – to date, it does not seem to have been priced in by the broad market.
Nordea Equity Strategy & Quant, Mikael Sarwe [Twitter: @MikaelSarwe]![Nordea Equity Strategy & Quant, Mikael Sarwe [Twitter: @MikaelSarwe]](https://static.seekingalpha.com/uploads/2023/1/19/49513514-16741145347058504_origin.jpg)
Your Takeaway
I am not suggesting that the SPX and SPY will fall because they have reached the 200-day simple moving average, which was the “sell-the-rips” point for the whole of 2022. That would be too easy. However, I call your attention to several other indirect signs that point to the validity of the current reversal to the downside that began on January 18.
The broad market has run out of steam – we can see this in the abundance of RSI bearish divergences in several groups of stocks, while there are almost no strong stocks left within the major benchmarks. Intermarket analysis – a look at the VXX – confirms the high risk of a continuation of the downward reversal. As it turned out, some leading indicators are also in line with this conclusion.
I am not calling for frantically selling all stocks and shifting into gold, which, by the way, is near its multi-year highs (also a bad sign for stocks, indicating a capital flow into a safer haven). However, being cautious in the current environment and not buying back everything that falls is not a bad decision.
Strategically, I favor the dominance of bonds over equities in 2023 – I have written about this before in a recent article, “How To Position Your Portfolio For 2023.” However, it would be unwise to completely abandon equities. I believe that if the signs I see today really do lead to a continuation of the meltdown in stocks, investors should be patient and resort to dollar averaging on a number of high-quality value/growth stocks with high ROIC that they have selected in their watchlist. I do not see the point in buying back the January 18 drawdown in SPY.
Thank you for reading!
Be the first to comment