

Khosrork
What is a financial bubble?
We had a lot of them in the 1990s, and no one really came up with a definition of what a bubble was.
Here is a picture for you that might indicate that a bubble, or, bubbles were being formed over the past two years or so.
M2 Money Stock (Federal Reserve)
Early in 2020, in response to the spread of the Covid-19 pandemic, the Federal Reserve began to “pump” money into the banking system to provide protection for the economy so that the economic conditions would not fall apart.
Here is the picture of the Fed’s securities portfolio.
Federal Reserve: Securities Held Outright (Federal Reserve)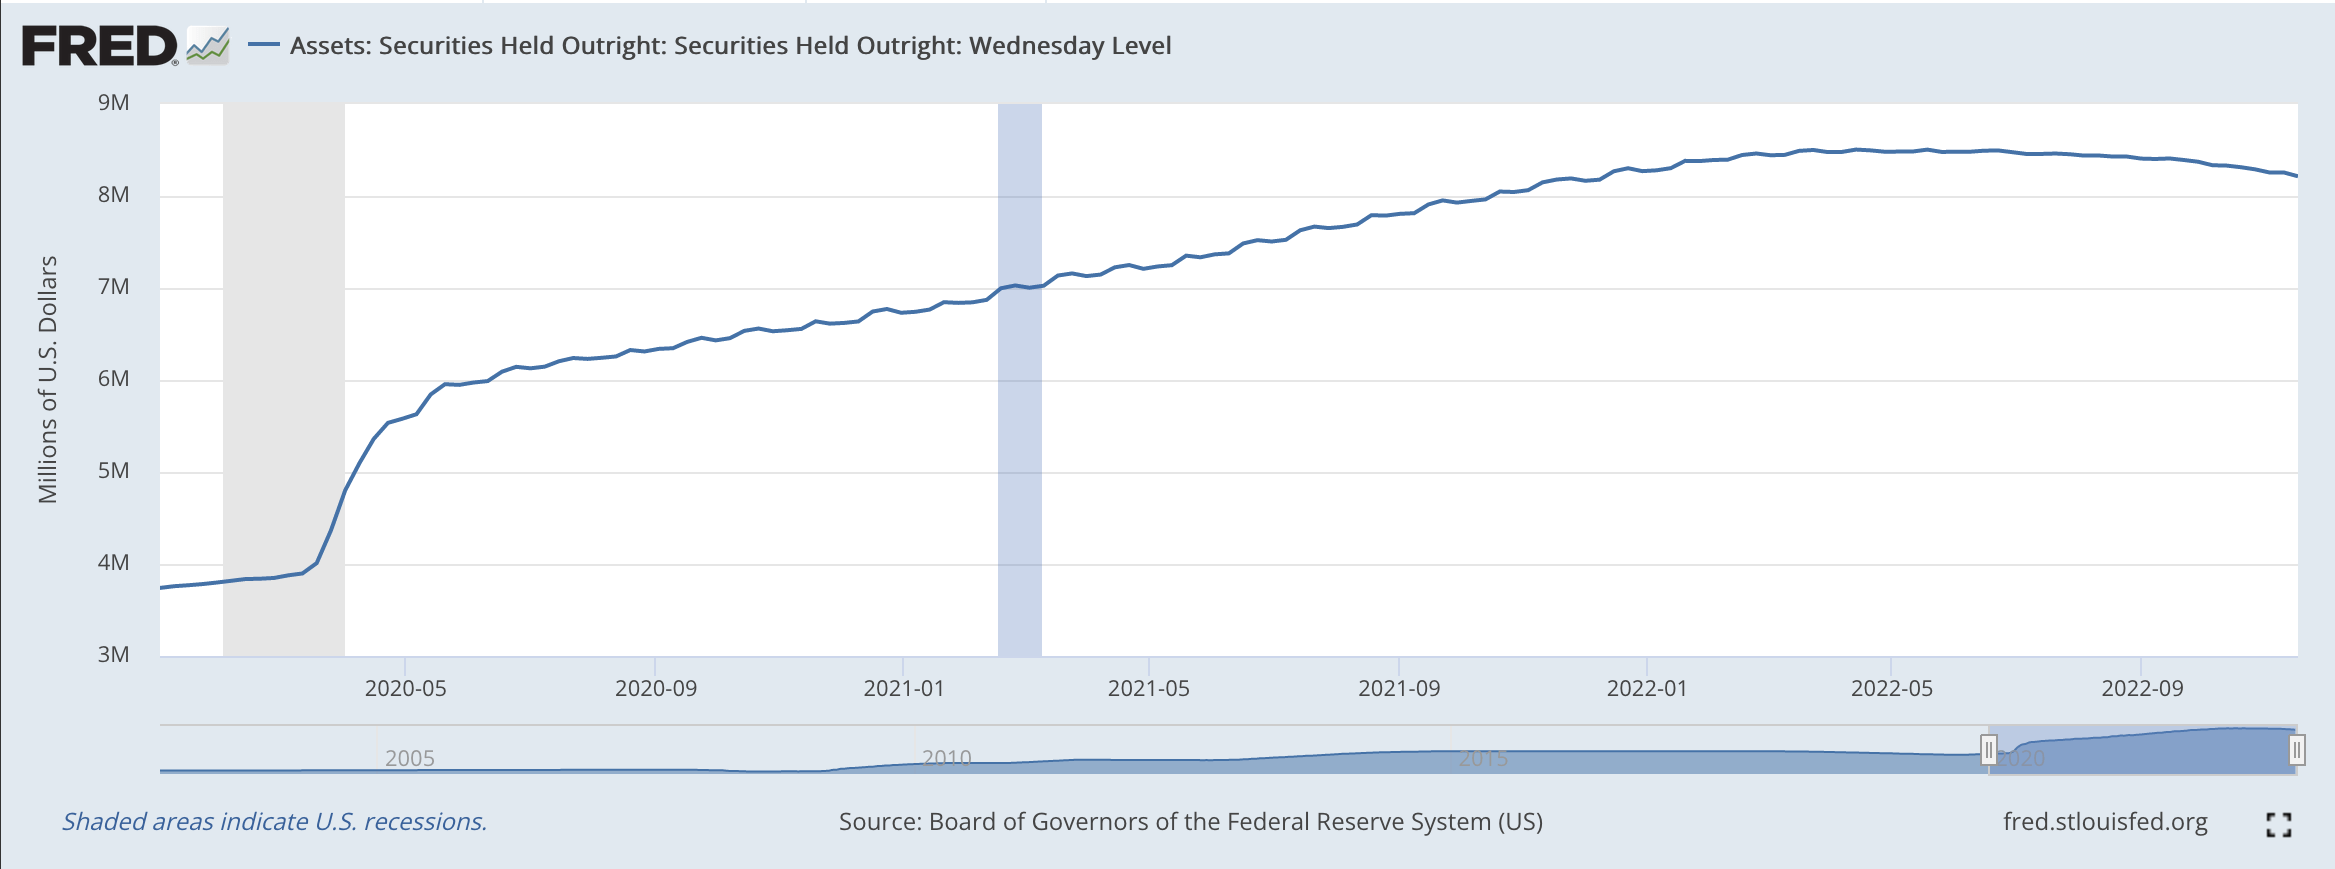
Money flowed into the financial markets in huge amounts.
More traditional firms were flooded with funds.
Less traditional firms were flooded with funds.
Newer asset managers thrived with the flood of funds. For example, the Special Purpose Acquisition Companies (SPAC), or “blank check” companies, flourished.
Innovative ideas flourished. Take for example the rise of Bitcoin.
Bitcoin (Federal Reserve)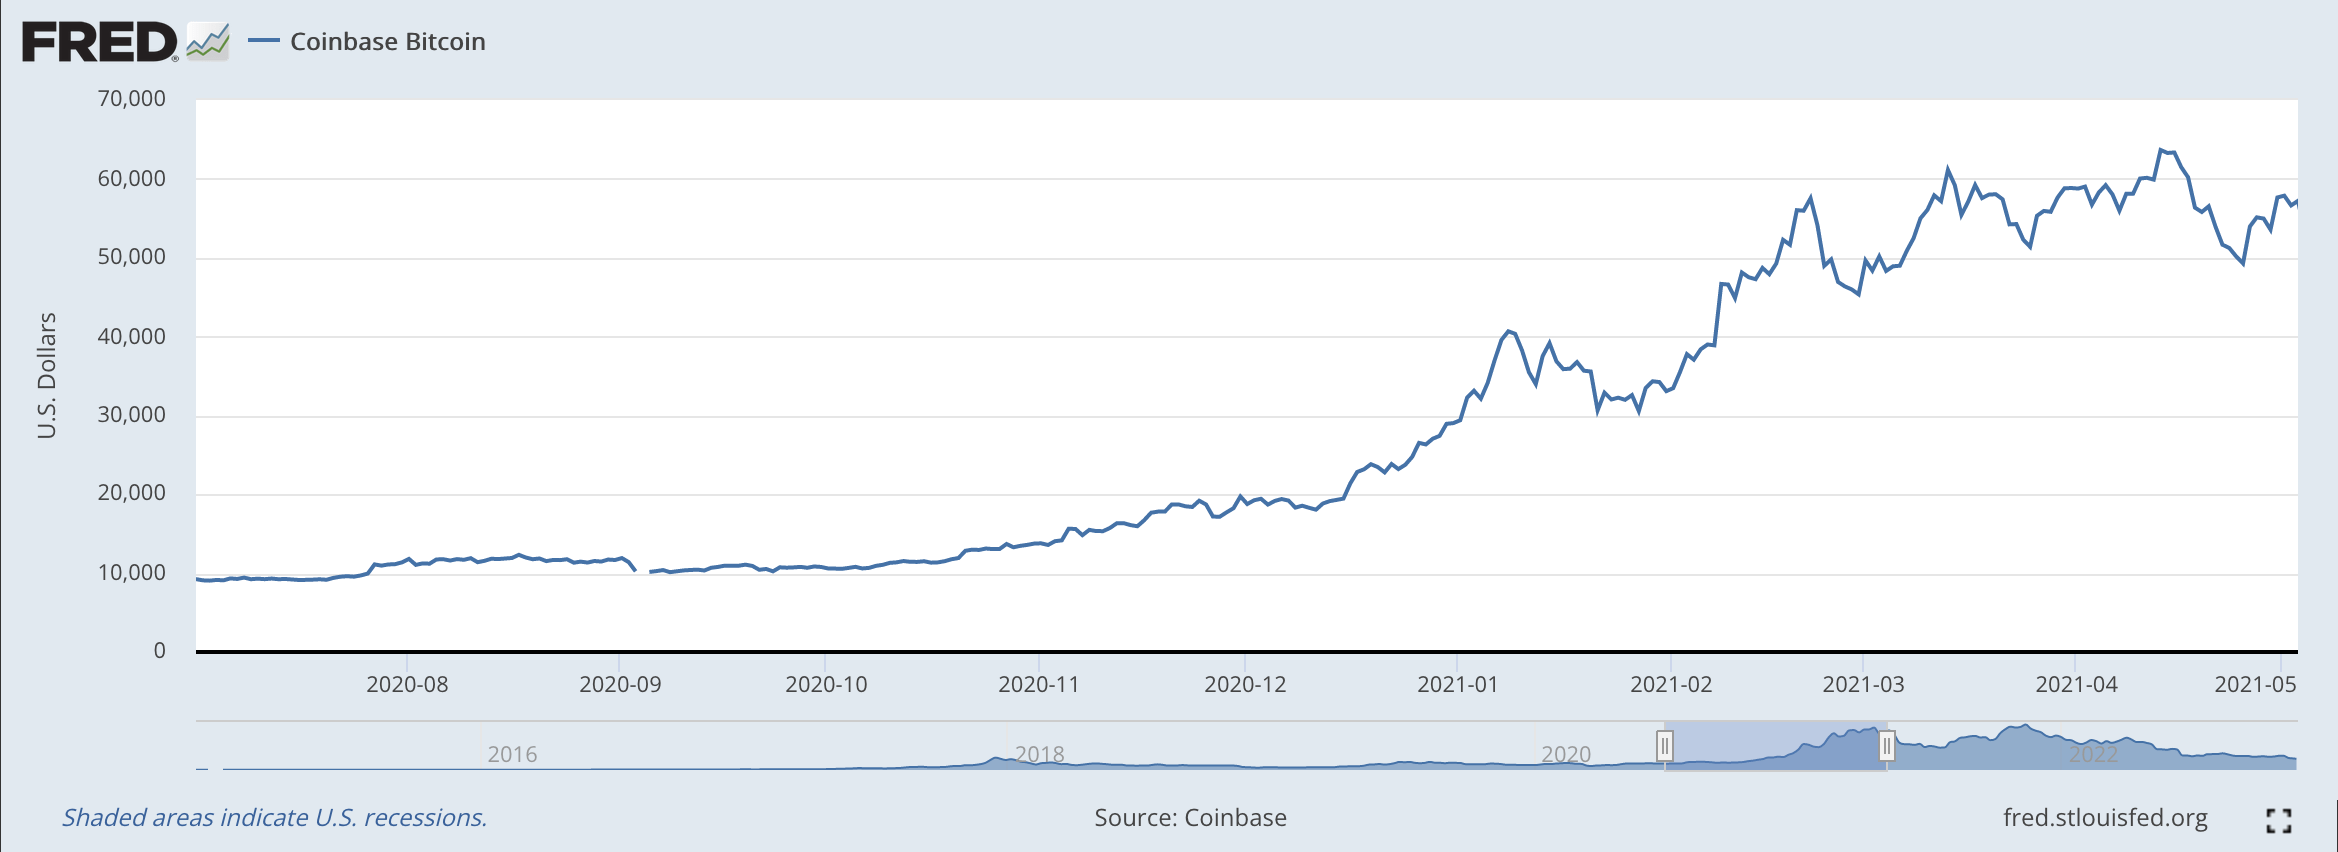
The Stock Market Also Popped Up!
S&P 500 Stock Index (Federal Reserve)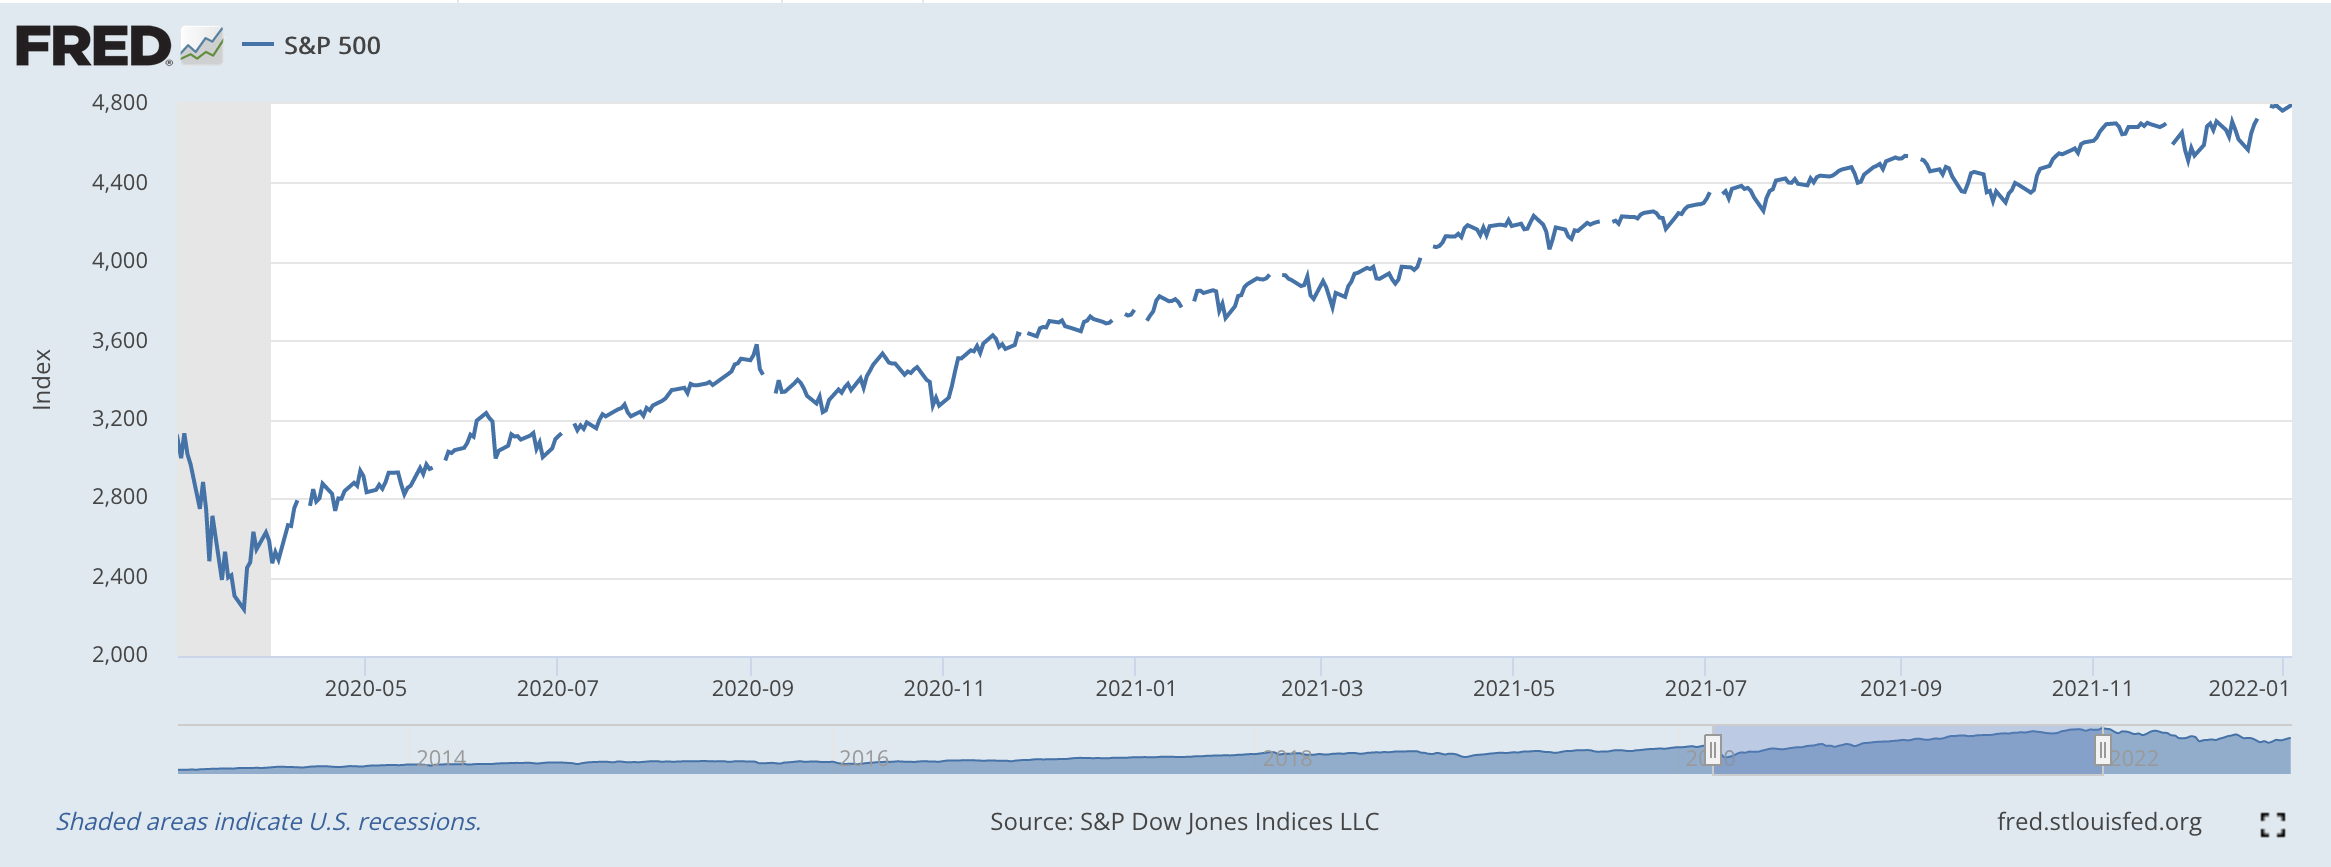
During this period of time, money was flooding all over the place.
And, what did you get? The bubble in the M2 money stock.
The M2 Money Stock
In 2018, the M2 money stock rose by 3.7 percent from December to December.
In 2019, the M2 money stock rose by 6.7 percent.
These are not exceptional numbers and were typical of the whole period of economic expansion since the Great Recession ended in 2009.
But, then, the pandemic came onto the scene.
From December 2019 to December 2020, the M2 money stock rose by 24.8 percent.
Wow!
Never in history has the U.S. M2 money stock risen by this amount!
Incredible!
Then, the next year, from December 2020 through December 2021, the M2 money stock rose by 12.4 percent.
Still, a historically high figure.
So, the United States experienced two years of massively excessive monetary growth.
The U.S. economy was spared a severe recession…or worse…but, what was the economy to do with all these funds hanging around.
Well, as mentioned before, the financial sector of the economy exploded. Funds were floating around everywhere.
But, also, after ten years of economic expansion without any significant appearance of inflation…inflation popped up.
And, as you can see from the second chart presented above, the Federal Reserve now has moved into a more restrictive mode.
The Fed’s securities portfolio began to decline after the middle of March 2022, and, from the first chart shown above, the M2 money stock began to decline in April 2022.
The peak month for the M2 money stock was in March 2022.
Through October 2022, the year-over-year rate of growth of the M2 money stock dropped to 1.3 percent.
The way things are going, it would not be surprising for the year-over-year rate of growth of the M2 money stock to move into negative territory soon.
Where Did The Money Go?
To support the discussion above, most of the money generated by the Federal Reserve went into the financial circuit of the economy and not into real expenditures, like investment in real capital.
How can I say this?
Well, the velocity of circulation of the M2 money stock declined and then stayed at a very low level.
Velocity of M2 Money Stock (Federal Reserve)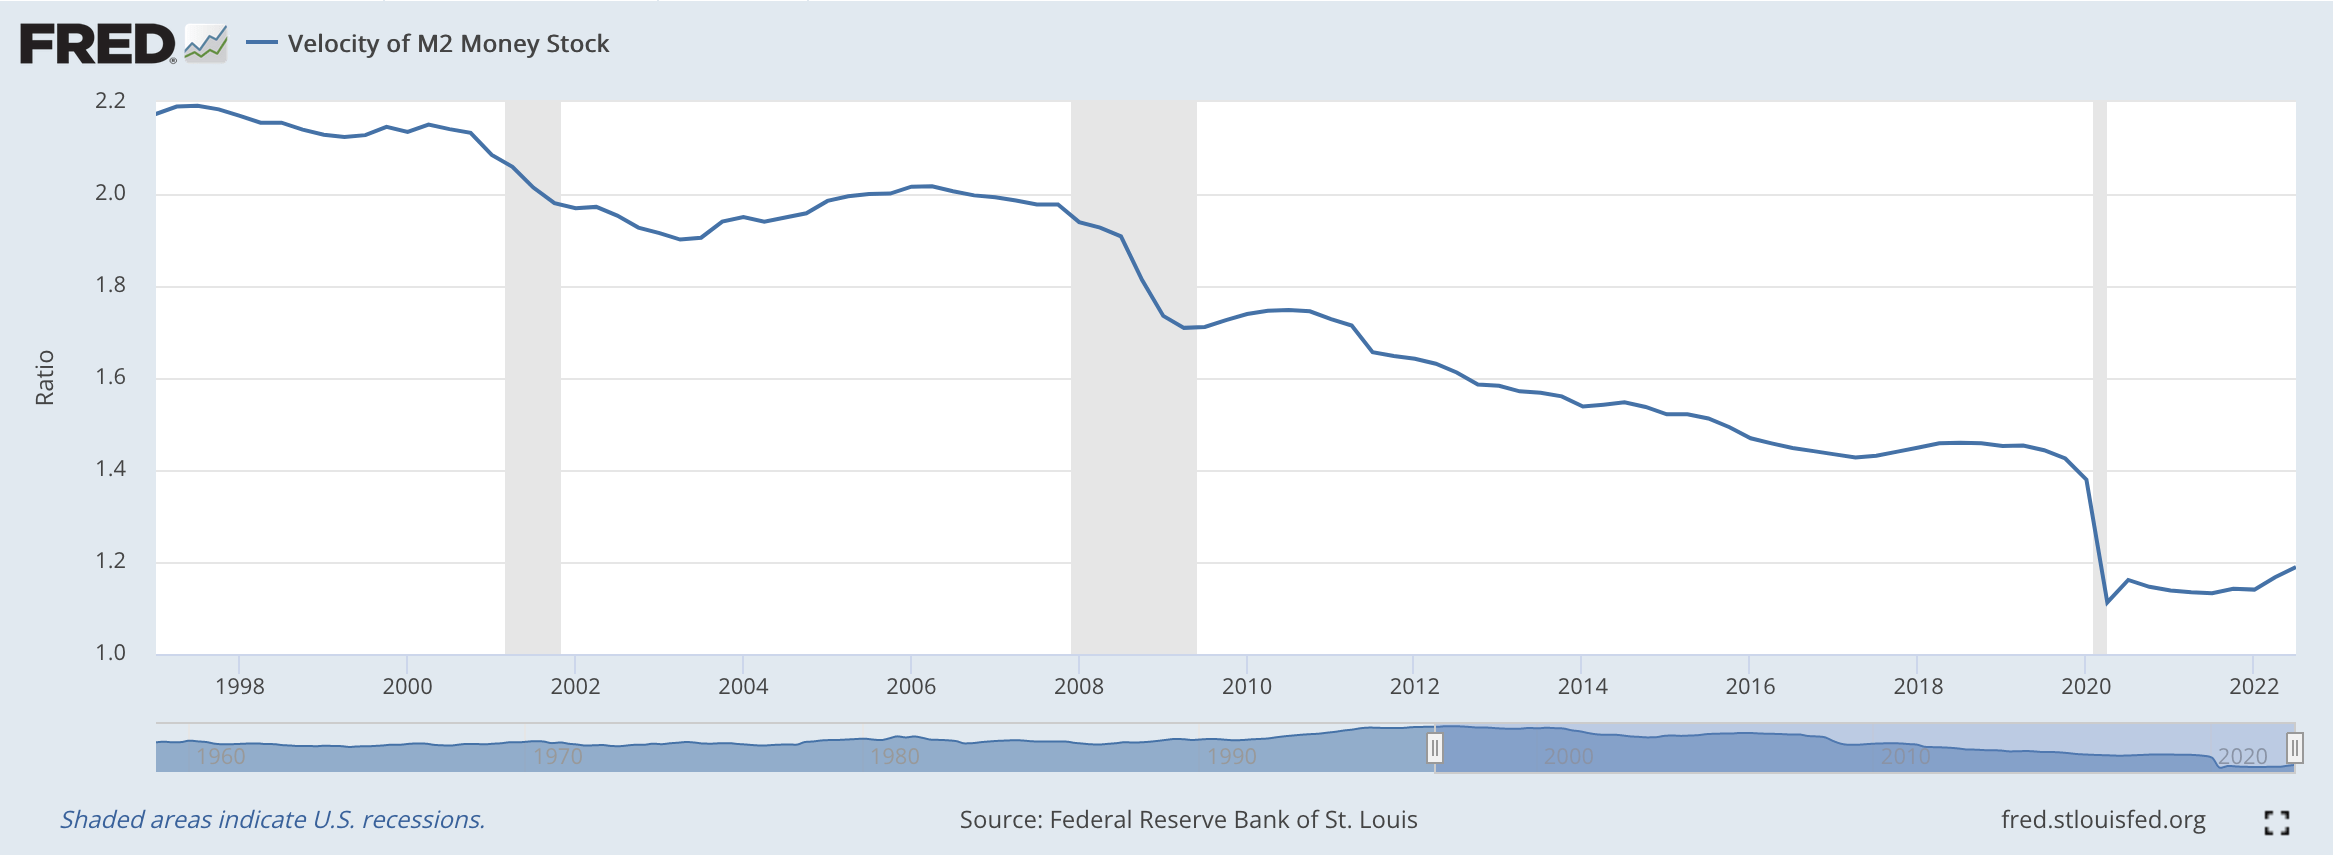
Note that the velocity of circulation of the M2 money stock had been declining since 1997. This decline was connected with the changes that took place in the investment world at this time.
Because of the Fed’s policy, based upon stimulating a small rate of inflation so as to achieve lower levels of unemployment, investors saw that they could make more money with less risk by investing in assets, like commodities or houses or stocks, than they could through investment in real capital, like plant and equipment.
Thus, asset prices rose and rose and rose while consumer price inflation remained modest.
So, velocity had been dropping on a regular basis.
But, in 2020, when the Fed was pumping lots and lots of money into the financial system, the velocity of circulation tanked.
The stimulus money was going into financial assets and not real assets.
So, economic growth over the past couple of years has not been great while all these funds created went into assets like “blank check companies,” and Bitcoin, and FTX Cryptocurrency Exchange.
Note that FTX was founded in 2019.
FTX, under the leadership of Sam Bankman-Fried, took advantage of all the money around and boomed. Quite a story resting on not only the cryptocurrency “bubble” but also resting on the “bubble” created by the Fed.
The Other Side Of The Story
Now, we have to deal with the next stage of the story, the time of Federal Reserve tightening.
The Federal Reserve is shrinking its asset portfolio.
As can be seen in the charts above, this action is resulting in a decline in the M2 money supply.
Money is being draw out of the system.
What can happen?
Well, since its peak on November 9, 2021, Bitcoin has fallen from about $67,500 to around $16,500.
The S&P 500 stock index has fallen from its peak on January 3, 2022, a decline from just under 4,800 to 4,000, hitting a low in the neighborhood of 3,600.
And, BTX declared bankruptcy a week ago.
This is the other side of the “bubble” story.
The question, of course, is where do we go from here?
What if the growth rate of M2 money stock goes negative?
Inflation will go down.
The economy will go into a recession.
And, we will have some bad times attempting to calm things after the bubble pops.
The question is, do we have the tools and do we have the right people in place to keep the financial markets and the economy under control?
Keep your eye on what is happening to the M2 money stock.
Be the first to comment