

pichitstocker/iStock via Getty Images
The EIA’s Short-Term Energy Outlook gives the USA data as C+C as well as all liquids, OPEC as crude only, but the rest of the world is Total Liquids only. All STEO charts below are a million barrels per day. Other charts, not part of the STEO, are in a thousand barrels per day. Also note that the EIA posts known data in bold and future predictions in a lighter font. They post known data through November 2022.
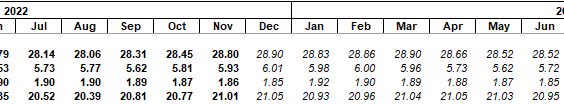
Obviously, all production is not known through November, but I have not tried to guess what they do know but posted the data as they posted it, known through November. But understand the November data, as well as October data, will almost certainly be revised later.

The EIA sees World Total Liquids declining early in 2023 with no gain for the total year.
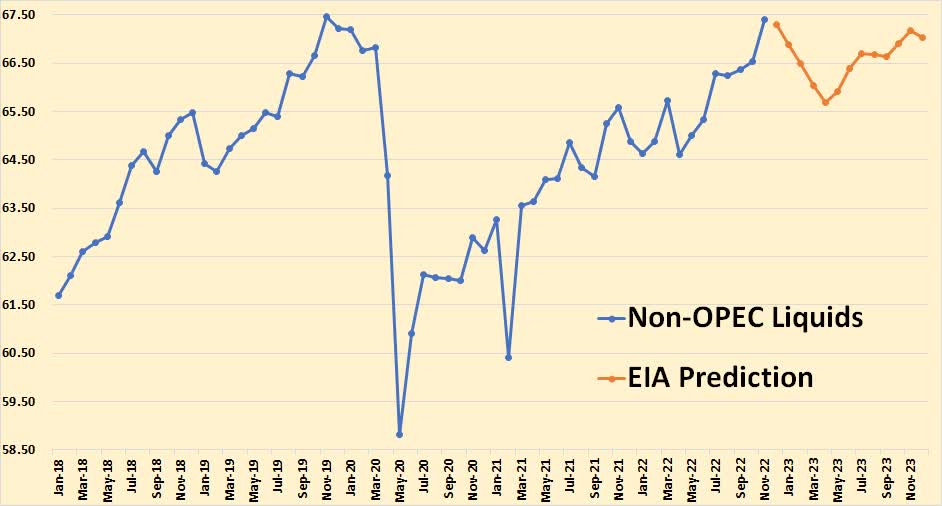
The EIA says Non-OPEC Liquids had a big jump in November, mostly from the USA and Kazakhstan, then a big decline, Russia, until April, then recovering for the rest of the year.
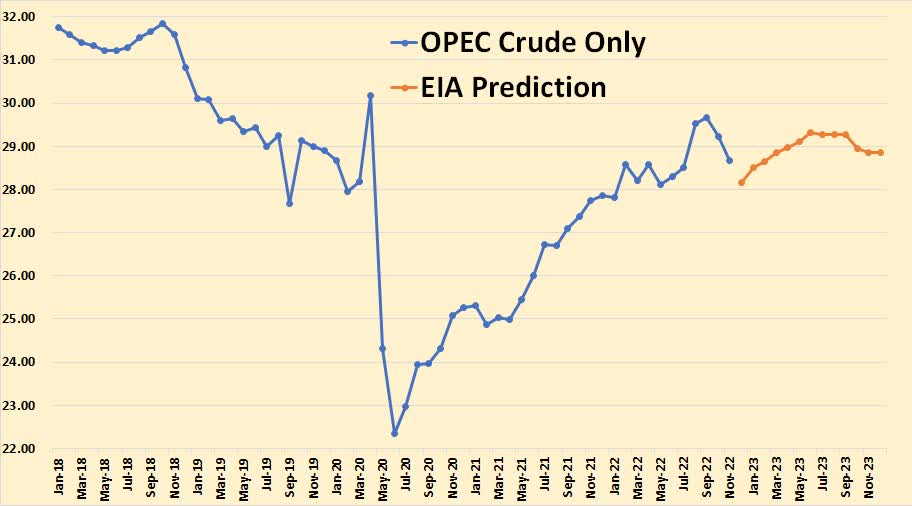
They think OPEC will keep cutting through December, then start to increase production gradually until they are back to their October 2022 level.
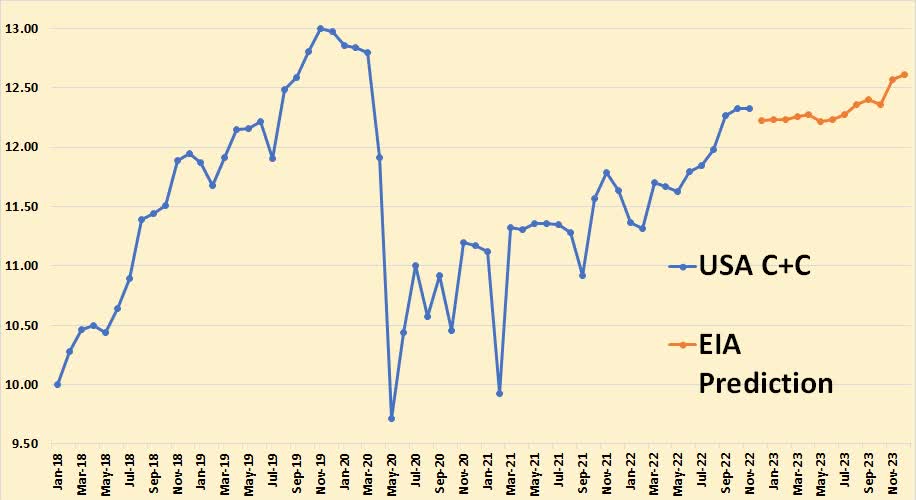
It appears the EIA thinks the USA’s growth spurt is just about over.
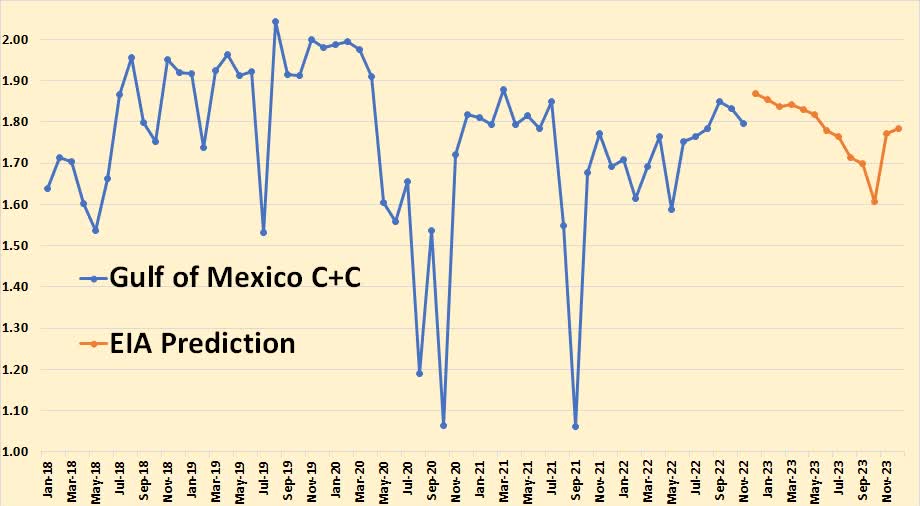
The GOM is expected to have a slight jump in December, then a gradual decline.

This is a strange one. The EIA sees USA Lower 48, less the GOM, growing by only 330,000 barrels per day from November 2022 to December 2033.
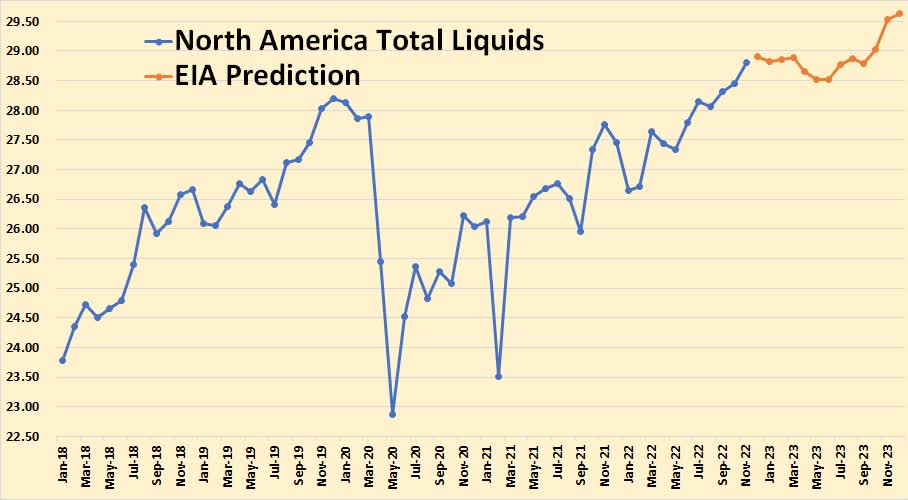
North American producers are the USA, Canada, and Mexico. This and all other STEO charts are Total Liquids.
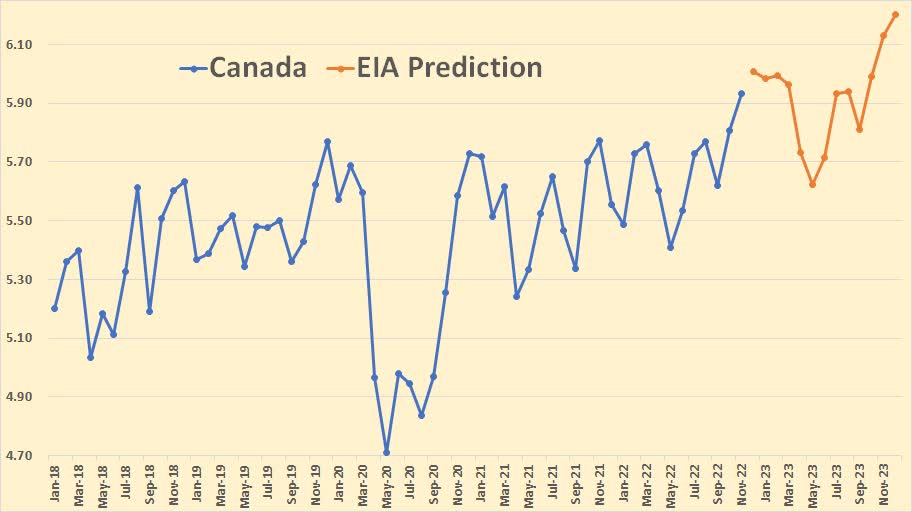
The EIA is optimistic about Canada.
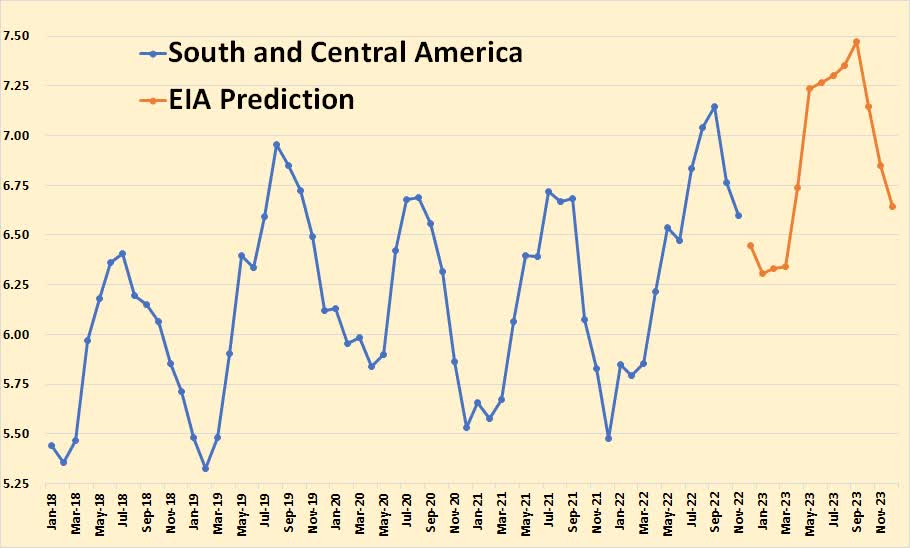
South and Central America consist of Argentina, Brazil, Colombia, and Ecuador. It does not include Venezuela, which is covered by OPEC data. The annual gyrations are caused by Brazil’s ethanol production.
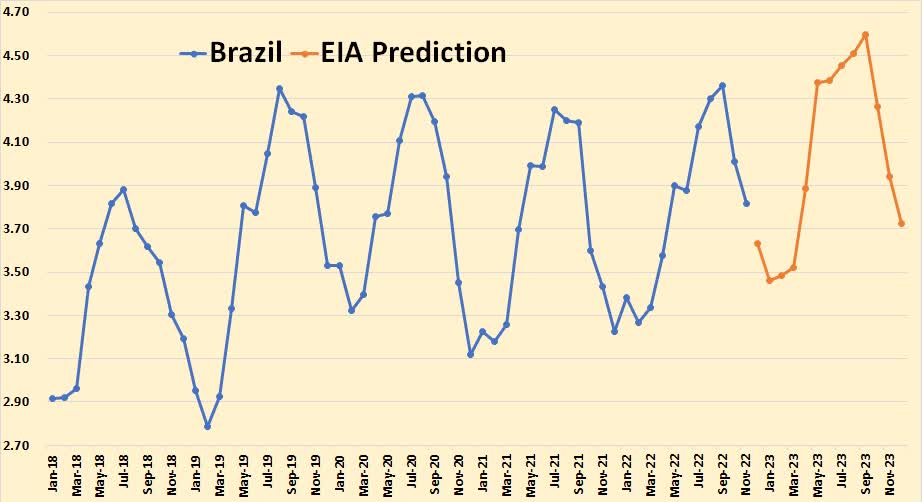
Most of Brazil’s liquid petroleum comes from offshore but during their winter months, they produce about a million barrels per day of ethanol.
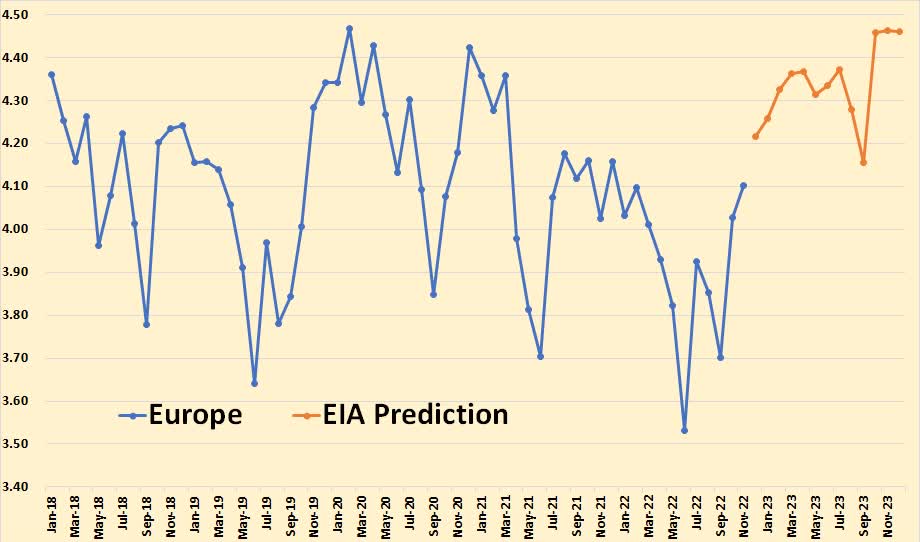
Europe consists primarily of Norway and the UK. Denmark and a few other countries contribute a small amount.
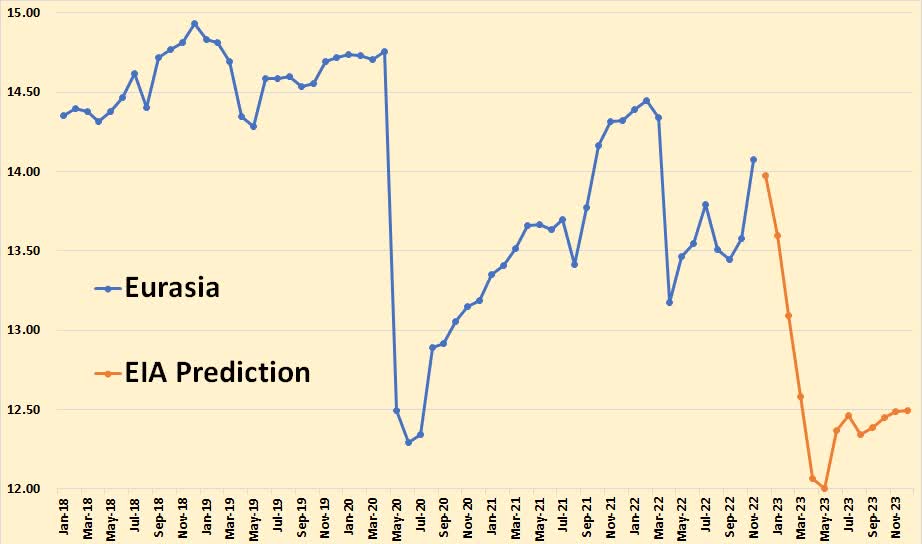
Eurasia consists of Azerbaijan, Kazakhstan, Russia, Turkmenistan, and a few smaller producers. Russian production seems to overwhelm all other Eurasian producers though Kazakhstan is also a strong producer.
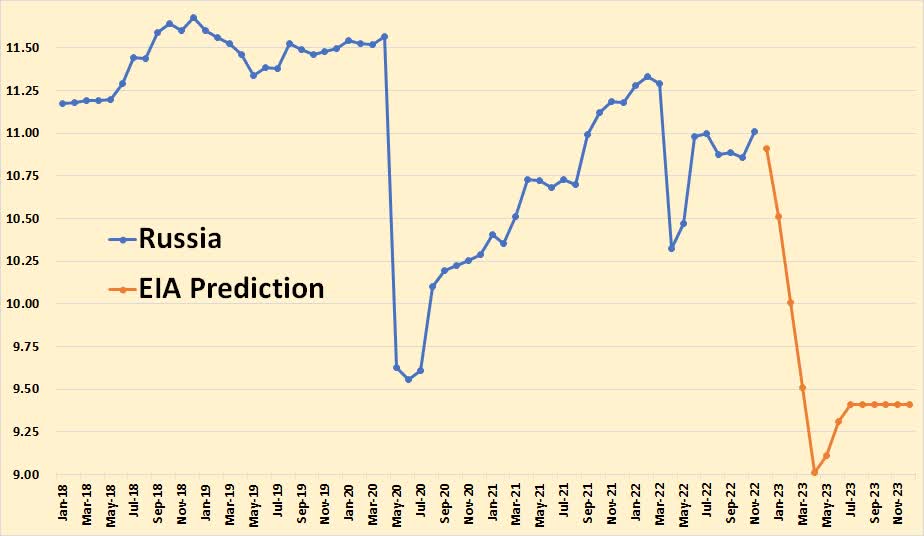
Russia surprisingly had an increase in November. But they start down in December and are down by about 2 million barrels per day by April 2022 to 9 million barrels per day. This is total liquids. C+C, if they are correct, will be somewhere between 8 and 8.5 million barrels per day by then.
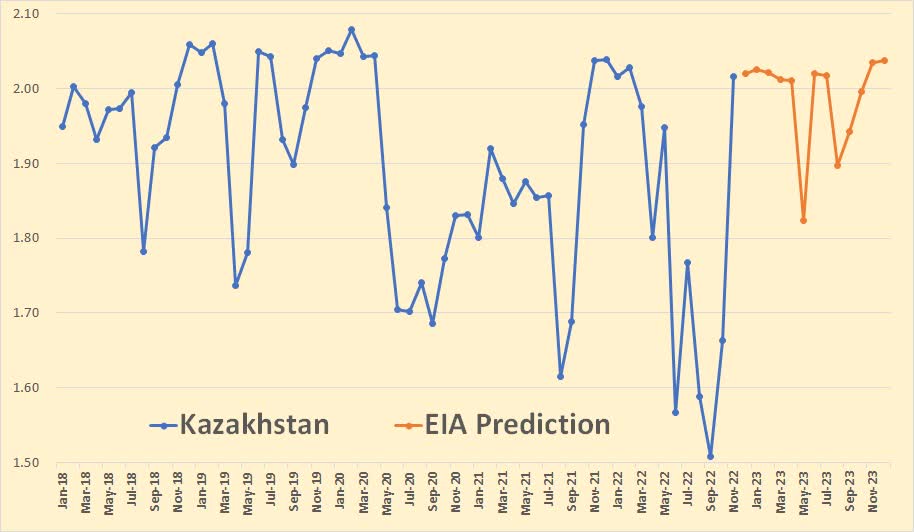
Kazakhstan finally got its pipeline leaks fixed and is back in full production. But they are pretty well at peak production now.
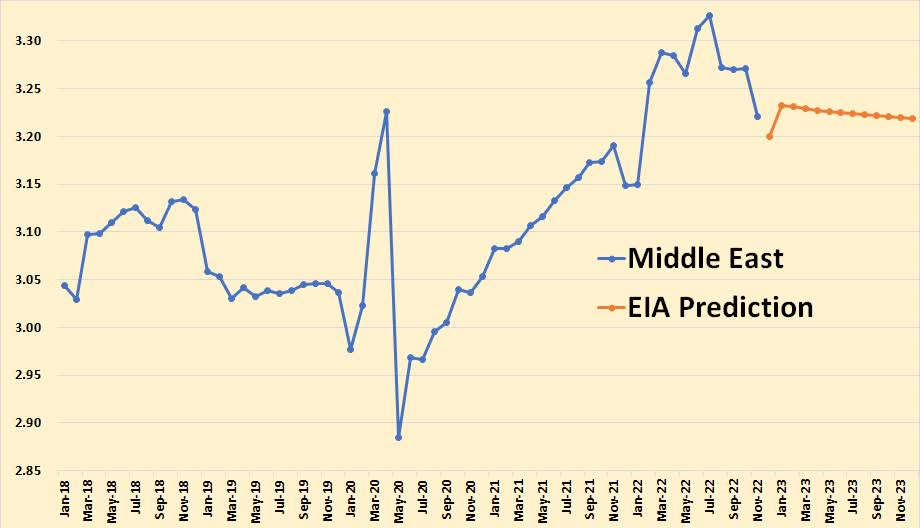
The Middle East non-OPEC nations consist of only Oman and Qatar.
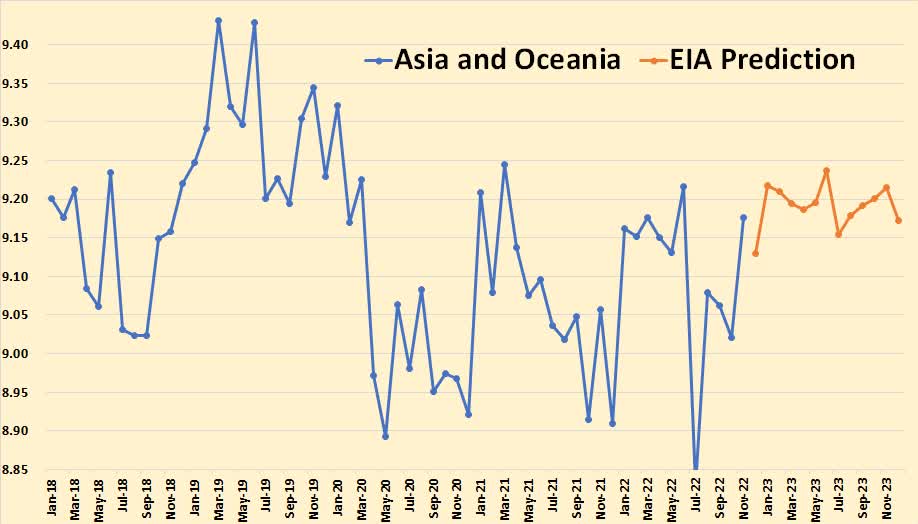
Asia and Oceania consist of Australia, China, India, Indonesia, Malaysia, and Vietnam.
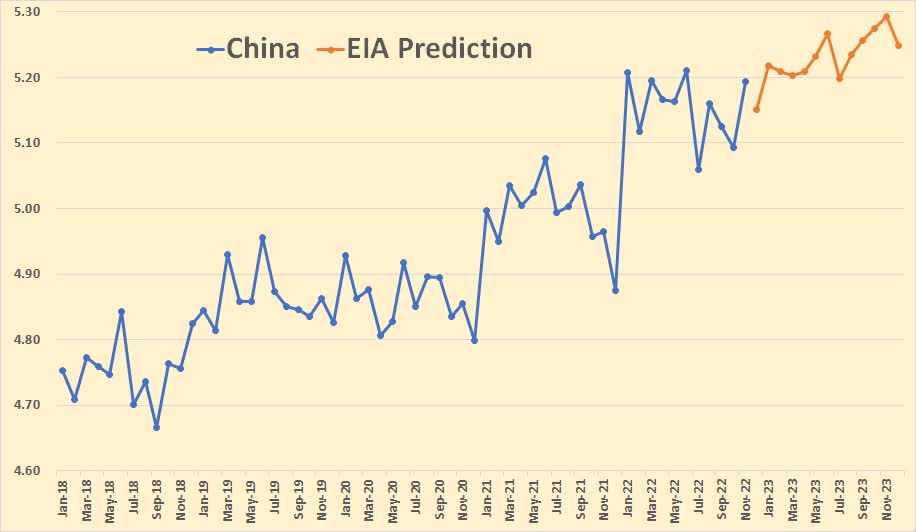
The EIA has China increasing only slightly over the next year.
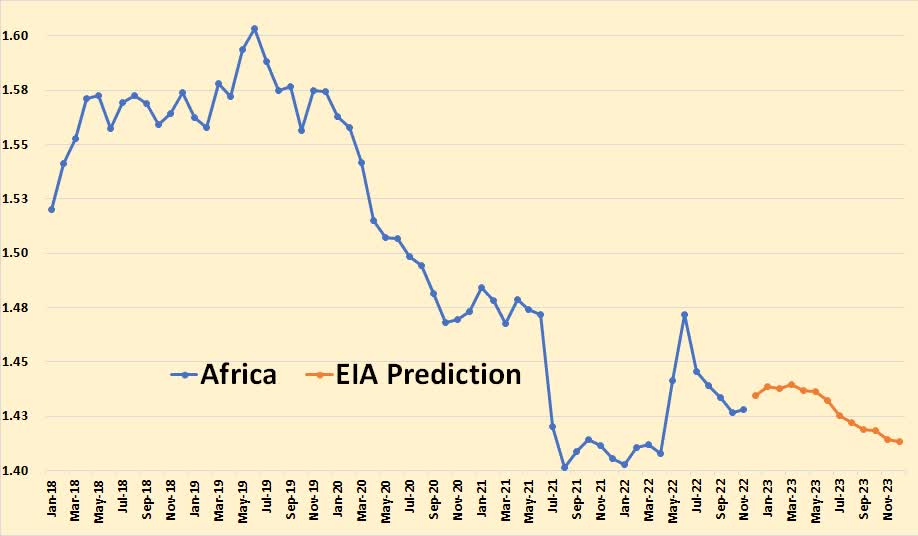
This is Africa non-OPEC nations only, that is Egypt, Sudan, South Sudan, and a few other countries.
With the below charts, I have attempted to show exactly what the EIA, as well as other institutions, are saying when they give us oil production data in “Total Liquids” instead of “Crude + Condensate”. They are giving us a lot of stuff that is just not oil. Data on all charts below is through August 2022.
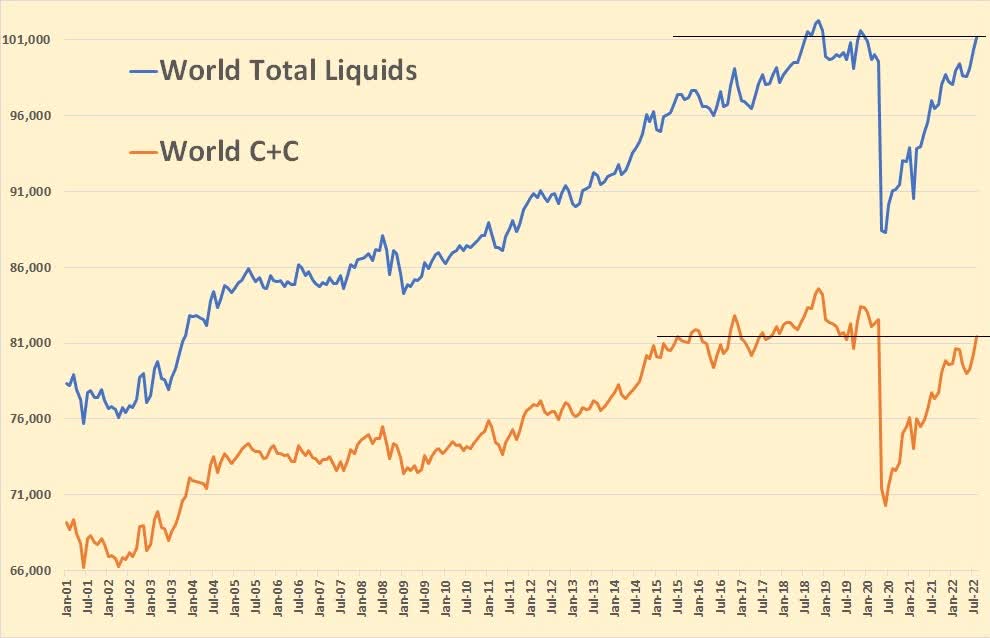
World total liquids average about 20 million barrels per day higher than C+C. Twenty years ago, it was less than half that. But what, other than crude + condensate, makes up those 20 million barrels? Well, it is 1. Natural gas liquids, that is, bottled gas such as propane and butane. 2. Other liquids, 3. Refinery process gain. We know what 1 and 3 are, but what about number 2? The EIA says: Other Liquids include biodiesel, ethanol, liquids produced from coal, gas, and oil shale, Orimulsion, blending components, and other hydrocarbons. Orimulsion was a mixture of Venezuelan heavy oil and water, but it is no longer produced.
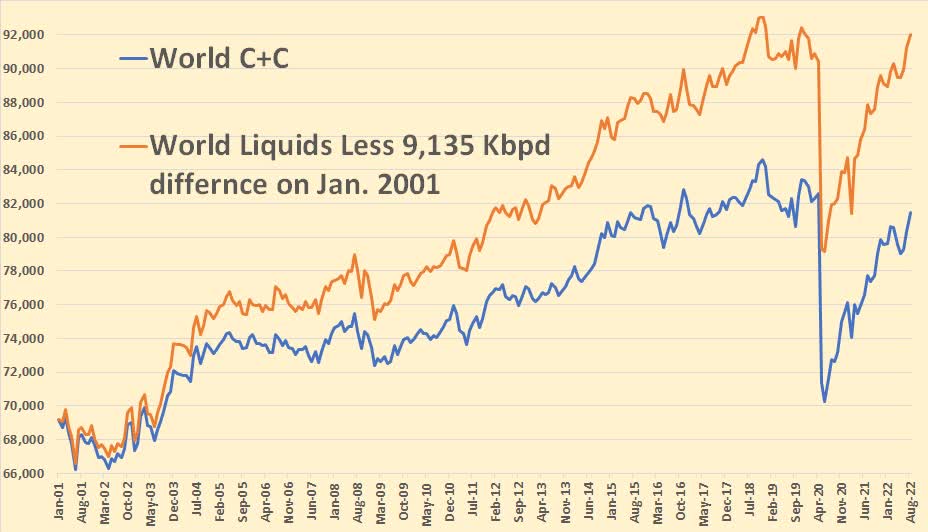
In January 2001, World Liquids were 9,135 Kbpd above world C+C. I subtracted that number from total liquids from that date through today to show the gain of liquids over a C+C.
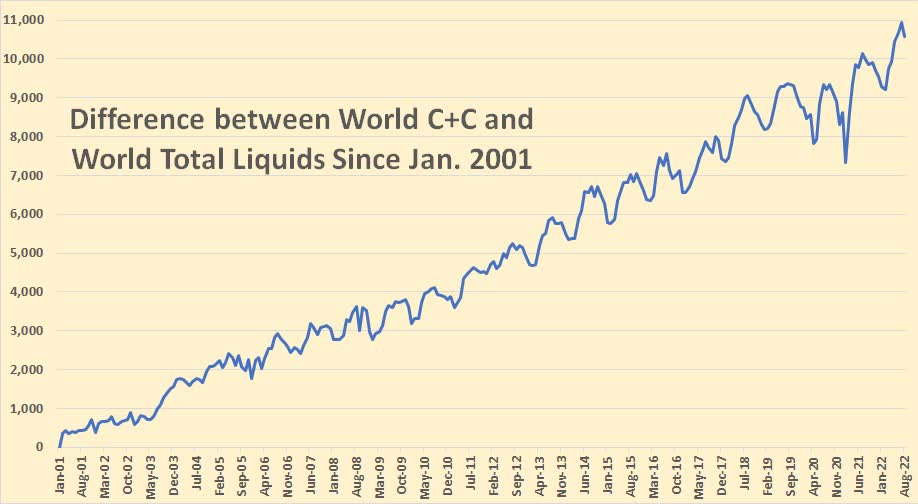
The actual difference between Total liquids and C+C in January 2001 was 9,135 k barrels per day. The chart above shows the gain of liquids over C+C since that date.
Below are the three components, other than C+C, that make up total liquids. I show the charts zero based in order to show more clearly their total contribution to Total Liquids.
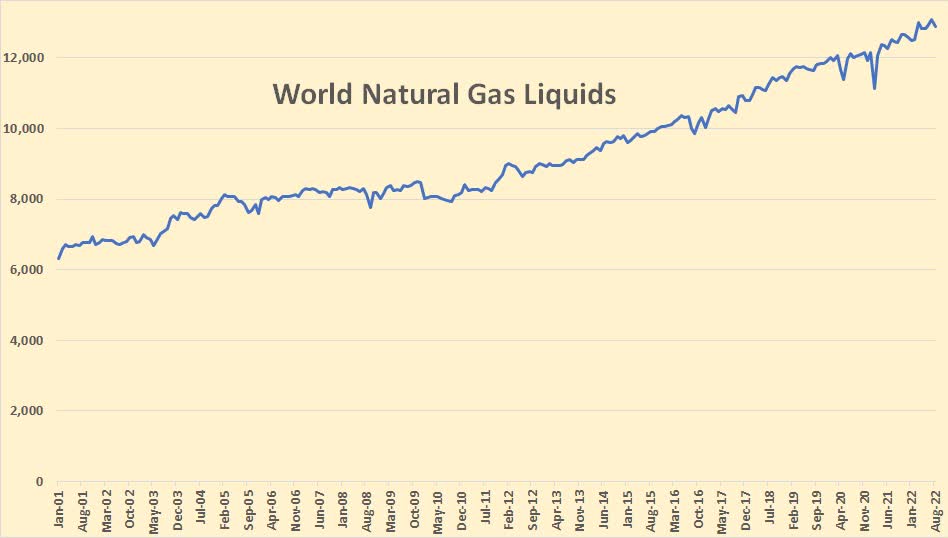
World Natural Gas Liquids production in August 2022 was 12,893,000 barrels per day, down 200,000 barrels per day from July.
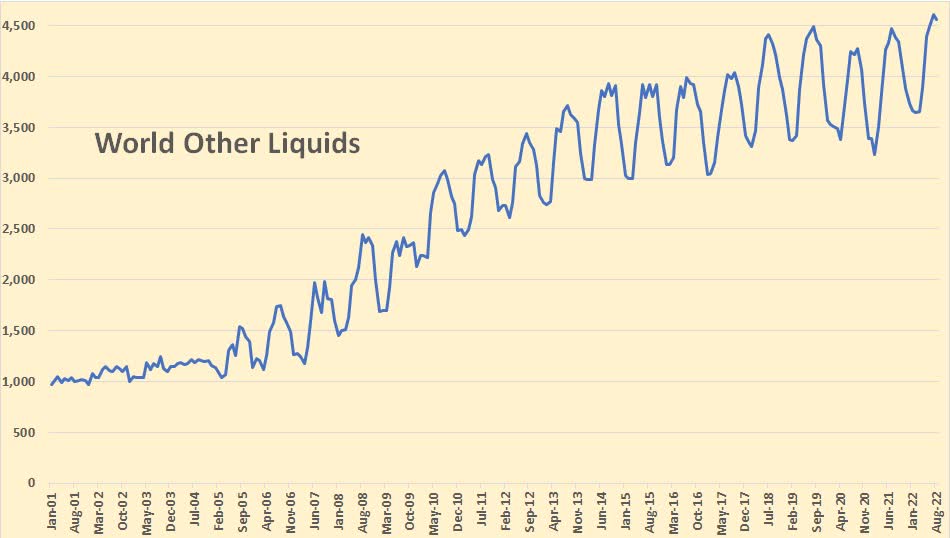
World Other Liquids production in August 2022 was 4,566,000 barrels per day, down 47,000 barrels per day from July. The annual gyrations were caused by Brazil’s ethanol production.
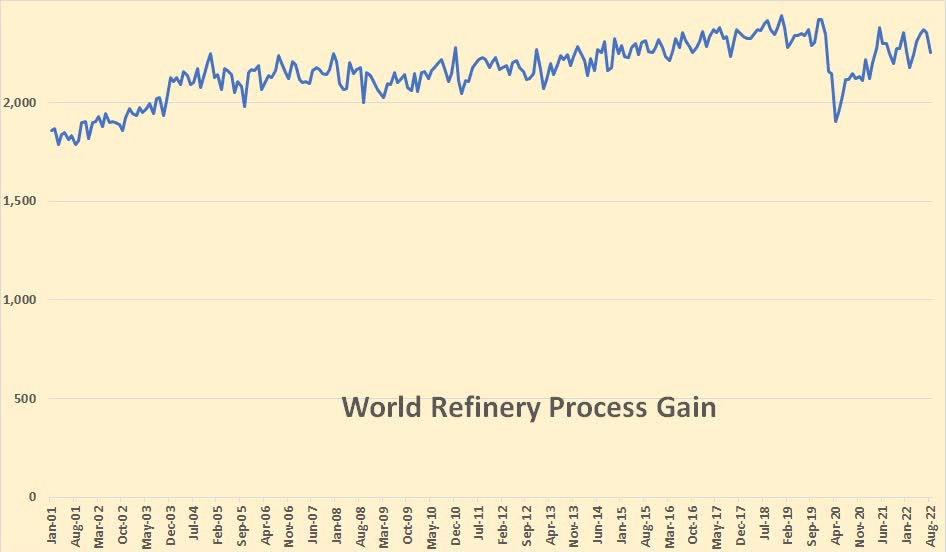
World Refinery Process Gain was 2,254,000 barrels per day in August, down 100,000 barrels per day from July.
Editor’s Note: The summary bullets for this article were chosen by Seeking Alpha editors.
Be the first to comment