

TonyBaggett/iStock via Getty Images
I have been waiting for the right time to publish this. I wrote my first draft on February 22nd, before the Russian invasion. Gold initially rocketed by $67 to $1964 on February 24th, the day of the invasion. On March 8th it peaked at $2057. Predictably, many bullish articles started appearing on Seeking Alpha and other sites. This caused me to table this article, given my contrarian nature.
Gold has since cooled, trading at about $1,940 as of this writing. In the past 10 days I’ve seen fewer bullish articles on gold. Therefore, I felt this was an ok time to publish. This article, like my investing approach, shares a long-view for patient investors, not a short-term trading view.
Here I will explore gold as a currency, its relationship to the monetary base and what an historic chart shows about its future price potential. I’ll also look at a chart showing the valuation of gold versus stocks over the past 100 years. The conclusion is that gold can easily reach $5,000 per ounce, maybe more, within three to six years. I’ll wrap up with research regarding optimal portfolio allocations to gold for long-term investors.
Gold Is a Currency
Gold is money. Throughout human history, until the advent of fiat currencies, gold and silver were the preferred mediums of exchange. The excellent investment advisory firm, Evanson Asset Management, quoted Alan Greenspan on its website:
“On October 29, 2014, former Fed Chairman Alan Greenspan was interviewed by Gillian Tett, U.S. managing editor for the Financial Times. The interview took place before members of the Council on Foreign Relations, a group composed of the world’s most powerful and wealthy people. Greenspan, known for his easy money policies, the “Greenspan put” and low interest rates during two decades of Fed reign, expressed some surprising views. Tett asks, “Do you think that gold is currently a good investment?”
Greenspan: “Yes, remember what we are looking at. Gold is a currency. It is still, by all evidence, a premier currency. No fiat currency, including the dollar, can match it.”
Evanson also cites a 2010 Wall Street Journal article by Jeff Opdyke where he argued that gold is a currency and not a commodity:
- Over the past 30 years the correlation between the U.S. dollar and gold was -0.65; a weak dollar drove up gold.
- Another study found a very high correlation of 0.93 between gold and total U.S. debt from 1982-2010.
So if gold is a currency, and one with negative correlation to the dollar, it is logical to compare gold’s relationship to the U.S. dollar and the money stock.
The Gold to Monetary Base Already Rebounded Off The All-Time Low
The chart below shows the price of gold divided by the St. Louis Adjusted Monetary base in billions of USD. The monetary base roughly matches the size of the Federal Reserve’s balance sheet.
Gold Price to Monetary Base Ratio (Macrotrends.net, Author edited)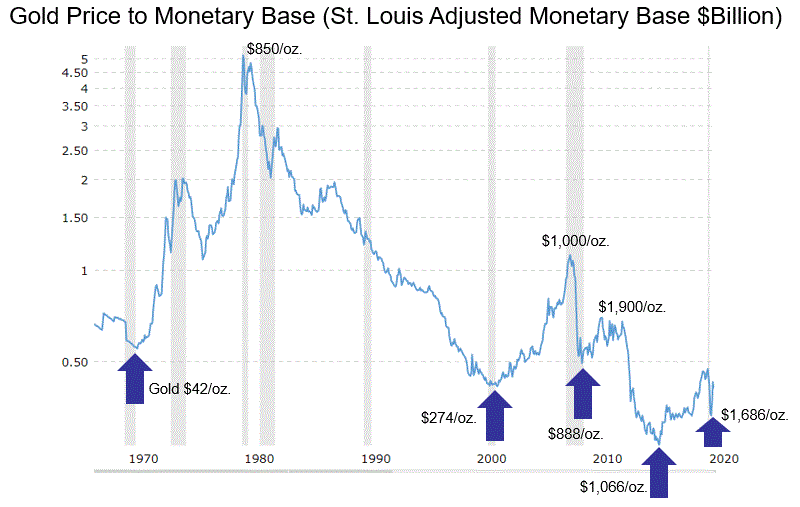
50 Year Gold Chart (goldprice.org)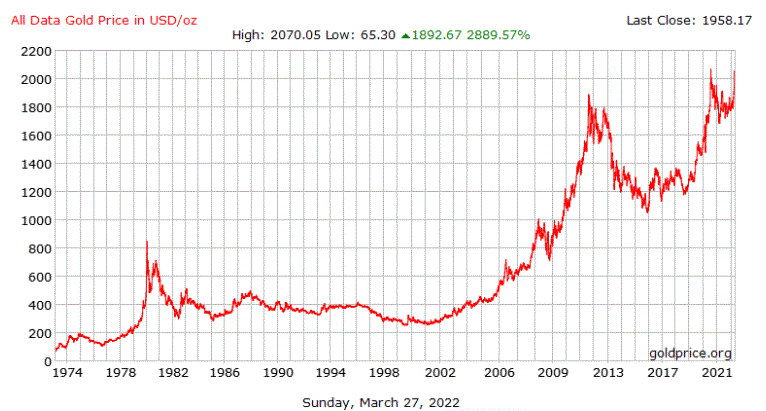
The arrows show significant troughs in the ratio since 1970. The table below shows the performance of gold after those troughs. The 1970’s stand out as the greatest bull run ever. That was ignited by Nixon’s removal of the dollar from the gold standard in 1971 and raging inflation.
Author, marcrotrends.net, gold.org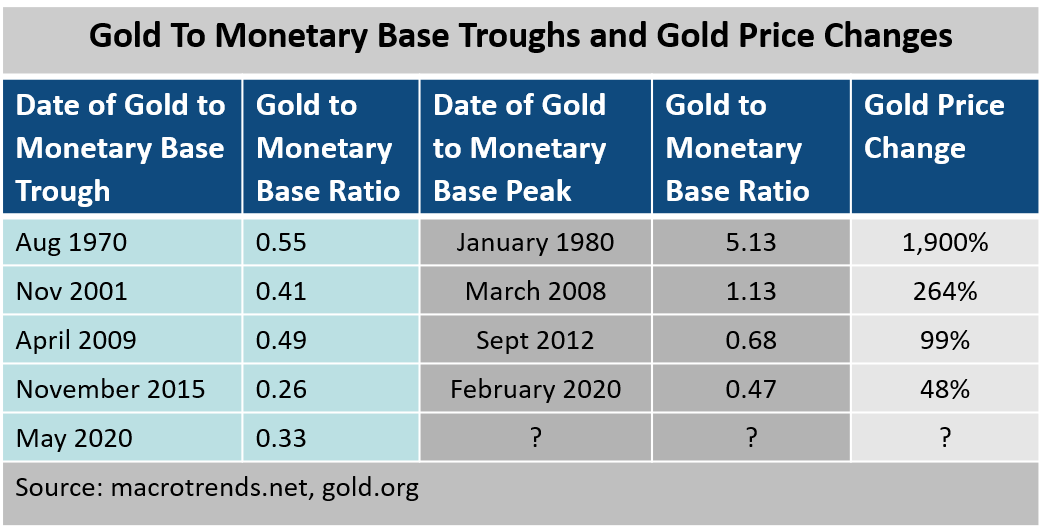
We reached the lowest ratio on the chart in November 2015 at 0.26. That nearly coincided with gold’s bottom of $1066 in December 2015. Gold has nearly doubled since.
The most recent ratio low of 0.33 occurred just after the pandemic’s onset in May 2020 with gold at $1,686. It’s possible the gold price gain since then is a resumption of a long-term trend reversal that began at the 2015 bottom. That run reached a peak of $2,070 in September 2020. Since then gold has consolidated its multi-year gains during a period when risk-on assets ruled. As of this writing, gold trades at about $1,940 with the gold to monetary base ratio at 0.32, not far from the all-time low.
goldprice.org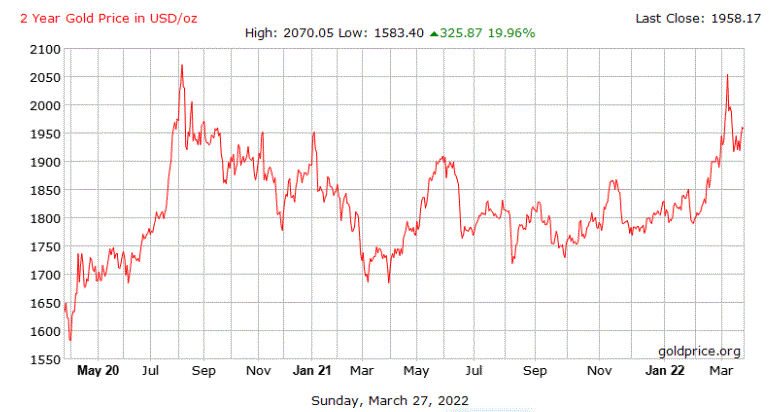
How We Can Get to $5,000 Gold
Let’s look at how the gold to monetary base ratio might change, beginning with the monetary base.
Economy and Debt Will Likely Temper Fed Tightening Action
Even in a solid economic environment the Fed will have great difficulty raising rates and reducing its balance sheet. Given the federal government debt of $30 trillion, each one percentage point rise in rates would add $300B/year in debt servicing costs. To put that in perspective, the FY2022 total defense spending budget is $1.1 trillion. Total interest payments are budgeted at $305B, so a one percentage point rate increase would double the amount of annual interest paid. This would further balloon the budget deficit, already projected at $1.3 trillion in FY 2022.
I believe the odds favor a slowing economy or even recession. A poll conducted by Deutsche Bank clients put the probability of a 2023 recession at 44%. A recession combined with a skittish financial market would lead the Fed to put the brakes on monetary policy tightening and even reverse course. David Rosenberg of Rosenberg Research was quoted in Barron’s: “The Fed has never tightened into such a maelstrom before – a shooting war, a pandemic, a weak and wobbly stock market, and an incredibly flat yield curve.”
In my view, the Fed doesn’t want to reduce policy accommodation. They are doing what every monetary authority in history has done – enabling government largesse by attempting to inflate away the real debt. Russia-Ukraine now gives them welcome cover.
The Fed stopped publishing the adjusted monetary base series at the end of 2019. However, the most recent figure for the unadjusted monetary base as of February 2022 was $6.040B. The two figures track closely, so we will utilize the current series in our analysis.
fred.stlouisfed.org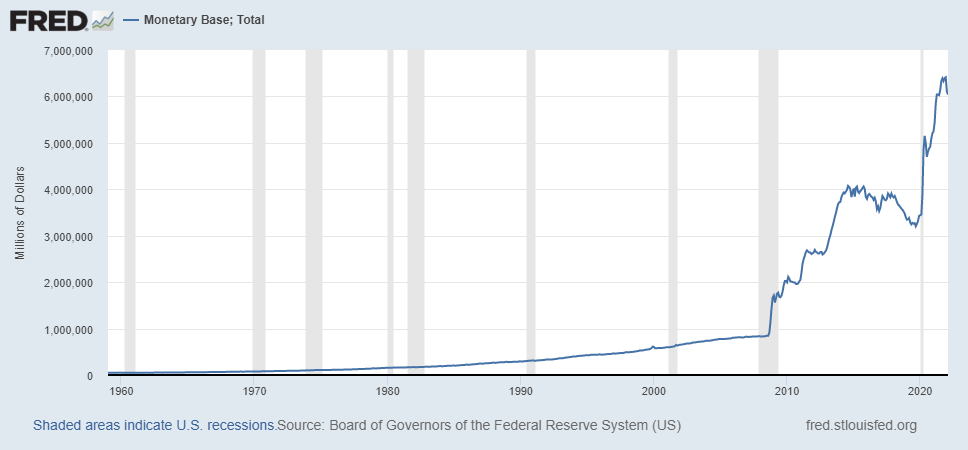
Decreases in the Fed’s balance sheet directly reduce the monetary base. The current consensus among market participants surveyed by the Federal Reserve Bank of New York anticipates a $1.2 trillion decline in the Fed’s balance sheet by Q4 2025. A few days ago Powell said balance sheet runoff could begin in May. If that happened, it would take about 42 months at a runoff rate of $28.6B per month. That sounds plausible, at least to start. By way of reference, the last QT cycle saw runoff of as much as $50B per month.
But let’s be optimistic and assume we avoid any economic hardship and the Fed achieves most of the consensus forecast runoff, say $1 trillion. That would result in a monetary base of about $5 trillion by 2025. But any hiccup or reversal in this process could easily result in a higher monetary base.
Shifting Sentiment: Dow/Gold is Close to Historical Highs
Let’s now turn to the numerator of the ratio – how investors value gold. That depends largely on investor sentiment, especially since gold isn’t like an equity that produces earnings and dividends for shareowners.
The historically low multiple of gold to the monetary base suggests relatively muted investor sentiment right now, despite the recent turmoil and high inflation. All assets compete for a place in investors’ portfolios. Another way to gauge sentiment is to look at gold versus equities. The chart below shows the Dow to Gold ratio. The past few years of bumping against the 20 mark and recent downtick suggests a shift in sentiment in favor of gold may already be underway.
macrotrends.net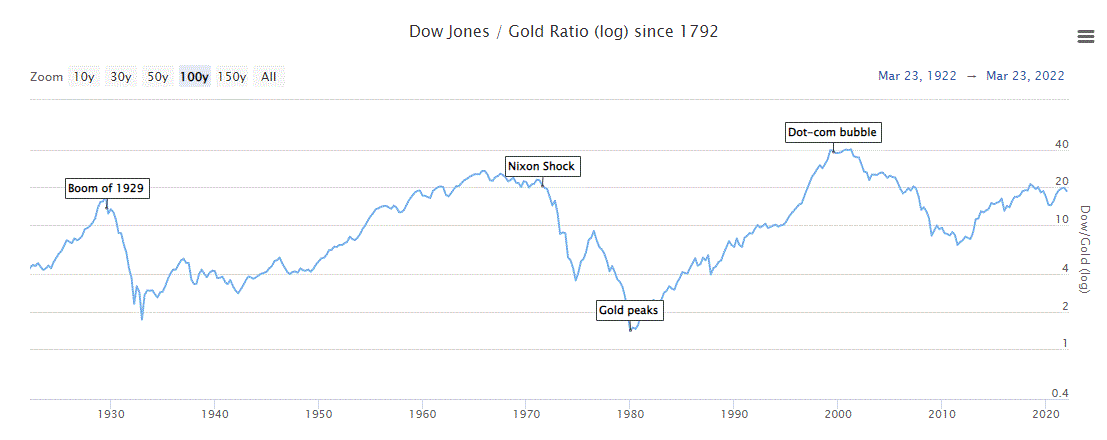
Based on this 100 year chart we are closer to a relative peak for the equities/gold ratio than to a bottom. The current level is close to peaks in 1929 and 1971. However it is still well below the dot-com bubble peak 40. Hence, there could be considerably more relative upside for equities before we top out.
Putting it Together – $5,000 Gold
The historic relationship between gold and the monetary base suggests the ratio could easily move back to a level between 1 and 5. If we apply a conservative ratio of 1 to the somewhat optimistic (LOW) monetary base estimate of about $5 trillion in 2025, we arrive at gold worth $5,000/oz. And if we experience a reversal in monetary tightening and/or a stronger shift in sentiment towards gold, it’s plausible we could reach a ratio of 2.0. In that case gold could reach $10,000/oz.
Why Gold Could Languish
It’s possible the gold to monetary base ratio won’t budge or even moves lower for several years. The ratio hasn’t exceeded 1 since 2008 and didn’t remain there very long. And the Dow to gold ratio could move further towards the dotcom bubble all-time high.
It can be puzzling why gold hasn’t rallied as strongly as the broader commodity indexes in the wake of much higher than anticipated inflation over the past year. The action on February 24thafter the invasion saw gold rise above $1,972 only to crash below $1,900 in less than a trading day. As some fervently believe, price manipulators might be in play, distorting market action.
Either way, the long-term nature of these ratios suggests it will take years to achieve such an advance. Yet an explosive move is possible. After the initial dollar-gold decoupling in 1971, it took less than three years for the gold/monetary base ratio to go from 0.56 to 1. But it took six years from the 2001 bottom of 0.4 to reach 1.
Recommended Portfolio Allocation to Gold
To be clear, I am not making a forecast for gold, rather showing a plausible case for what might happen. Regardless of the upside potential, gold has proven to be an effective portfolio diversifier. For example, gold initially declined during the 2020 pandemic onset, but still gained 25% that year, outperforming the S&P 500.
Ibbotson conducted a study of the benefits of precious metals diversification from 1971-2004:
Based on the forward looking resampled efficient frontiers, asset allocations that include precious metals have better risk-adjusted performance (as measured by Sharpe ratio) than asset allocations without the precious metals. Investors can potentially improve the reward-to-risk ratio in conservative, moderate, and aggressive asset allocations by including precious metals with allocations of 7.1%, 12.5%, and 15.7%, respectively. These results suggest that including precious metals in an asset allocation may increase expected returns and reduce portfolio risk.
The chart below from Sprott, “The Relevance of Gold as a Strategic Asset 2022” shows the range of efficient frontier portfolio allocations to gold for investors across world regions. For U.S. investors, it is consistent with the Ibbotson study numbers – about 6-12%.
Sprott, The Importance of Gold as a Strategic Asset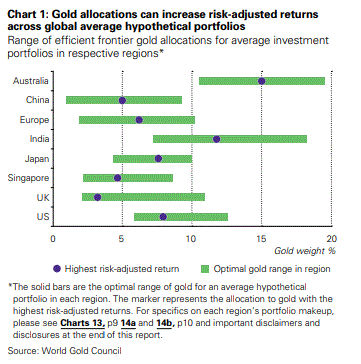
My recent SA article, Investing When Key Market Charts Conflict, demonstrated how a diversified, moderate risk portfolio with a 15% allocation to gold outperformed the US Total Stock Index by 7.5 percentage points per year during the first decade of the century. In my portfolio I carry a long-term strategic allocation of 10% gold via a combination of GLD, SGOL and some physical gold.
Conclusion
The Gold to Monetary Base and Dow/Gold ratios suggest significant upside for gold. Even a modest move towards historical ratios can easily support $5,000 gold. Since these charts depict very long-term trends and relationships, it’s possible gold could languish near-term. Besides the upside potential, gold has proven to be an excellent portfolio diversifier over time, particularly during times of market stress. A strategic allocation of 6-15% of a portfolio has proven to be beneficial to patient investors.
Thanks for reading this. I look forward to your comments.
Be the first to comment