

LUMIKK555/iStock via Getty Images
This article was published on Dividend Kings on Wed, December 28th.
—————————————————————————————
What’s going to happen in the stock market in 2023? After a brutal year for both the stock and bond market in 2022, this is naturally the question many investors have.
But it’s the wrong question to ask. Why? Because decades of market data from JPMorgan, Fidelity, Bank of America, Princeton, and RIA show that:
- over 30+ years, 97% of stock returns are a function of pure fundamentals, not luck
- in the short term; luck is 25X as powerful as fundamentals
- in the long term, fundamentals are 33X as powerful as luck
In other words, in the short-term stock prices are a crap shoot. In the long-term, they are fundamentals-driven destiny.
So the right question to ask for 2023 is, “what do stocks do in the long-term?” The answer? They always go up.
Charlie Bilello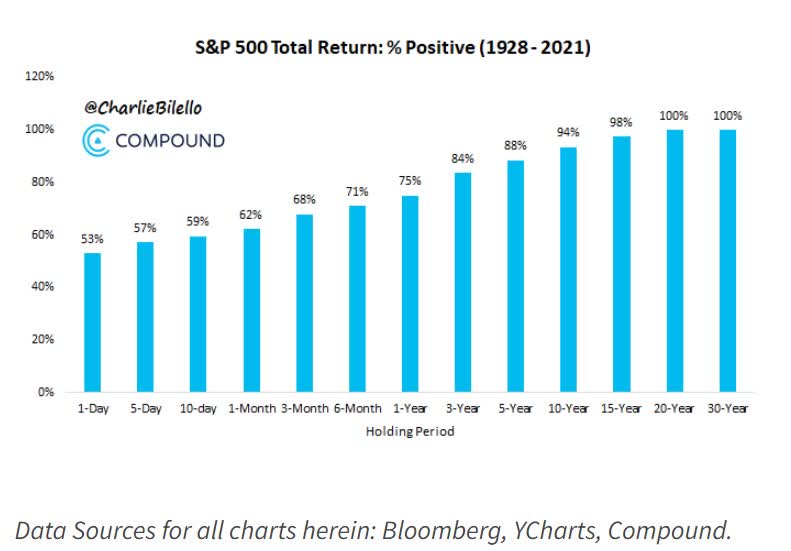
Even if you had bought the market at the worst time in history, the 1929 peak, right before the Great Depression’s 87% crash, there has never been a period when stocks didn’t go up over 20+ years.
And guess what? Stocks are the best-performing asset class in history.
Charlie Bilello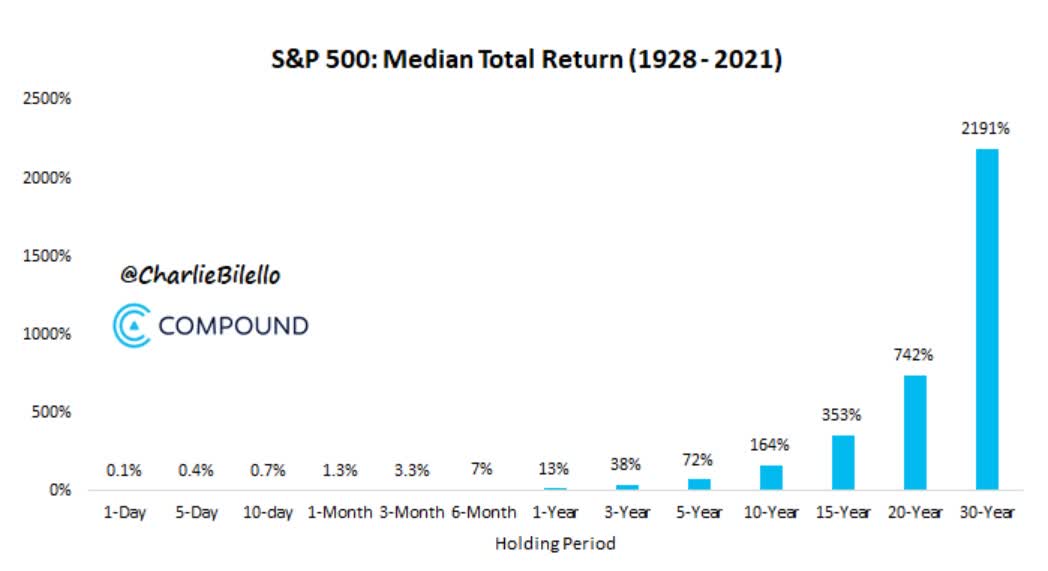
Over the standard 30-year time frame, the median return for stocks is 23X.
But aren’t we headed for a recession in 2023? Yes, according to the bond market, CEOs, and most economists, we are.
And doesn’t that mean earnings growth in 2023 is likely to be flat at best and possibly as bad as -20%? According to the blue-chip economist consensus, that’s indeed likely.
S&P 500 Bear Market Bottom Forecast Range
| Earnings Decline In 2023 | 2023 S&P Earnings | X 25-Year Average PE Of 16.7 | Decline From Current Level |
| 0% | $218.44 | $3,647.95 | 4.7% |
| 5% | $207.52 | $3,465.55 | 9.5% |
| 10% | $196.60 | $3,283.15 | 14.3% |
| 13% | $190.04 | $3,173.71 | 17.1% |
| 15% | $185.67 | $3,100.76 | 19.0% |
| 20% | $174.75 | $2,918.36 | 23.8% |
(Source: DK S&P 500 Valuation Tool, Blue-Chip Consensus, Bloomberg)
Does that mean stocks are likely to bottom significantly lower next year? That’s what fundamentals and market history would suggest.
So shouldn’t investors stick to cash and avoid stocks until the market falls 5% to 24% more? Not at all, and here’s why.
Bank of America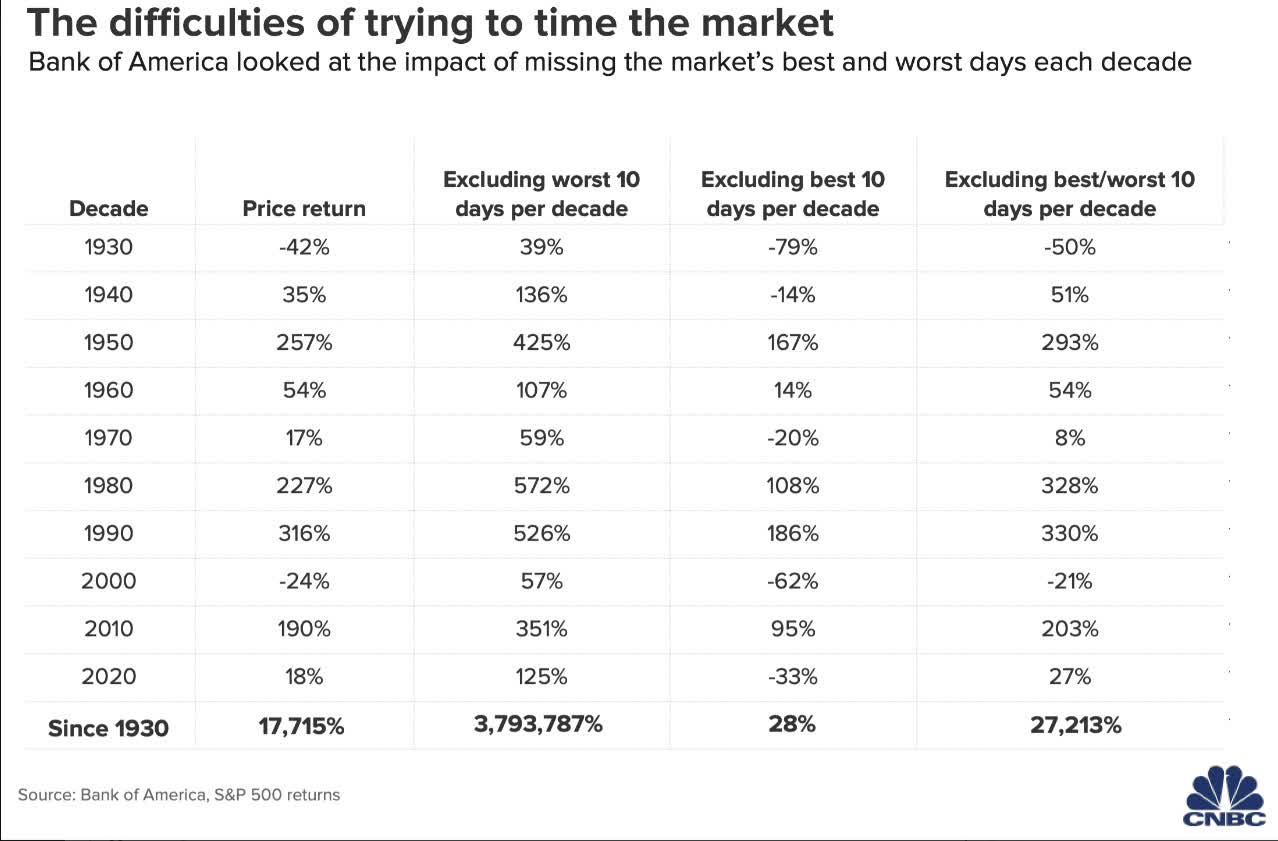
Since 1930 99.84% of the market’s long-term returns, those incredible 23X returns every 30 years, have come from just 10 of the single best market days… of each decade.
Miss those days, and the total return for stocks is 28% or -94% adjusted for inflation. And guess what? 80% of those single biggest gains come within two weeks of the worst days, during bear markets like this one.
In other words, if you try to time the market, you risk a sure thing, a life-changing return turning into a potentially permanent and catastrophic wipeout of your life savings.
Want proof that short-term trading is almost impossible to do well?
One study of Brazilian futures traders found that 97% of day traders lost money over 300 days.
Another study of day traders in Taiwan between 1995 and 2006 found only 5% of day traders to be profitable.
A study by the U.S. Securities and Exchange Commission of forex traders found 70% of traders lose money every quarter on average, and traders typically lose 100% of their money within 12 months.
A study of eToro day traders found nearly 80% of them had lost money over 12 months, and the median loss was 36%.” – Business Insider
Take it from someone who spent 13 years trying every get-rich-quick timing and trading scheme under the sun and who lost $366,000 doing it; market timing doesn’t work.
We believe time, not timing, is key to building wealth in the stock market.” – Bill Miller, famous value investor who beat the S&P for 15 consecutive years
Want more proof?
JPMorgan Asset Management 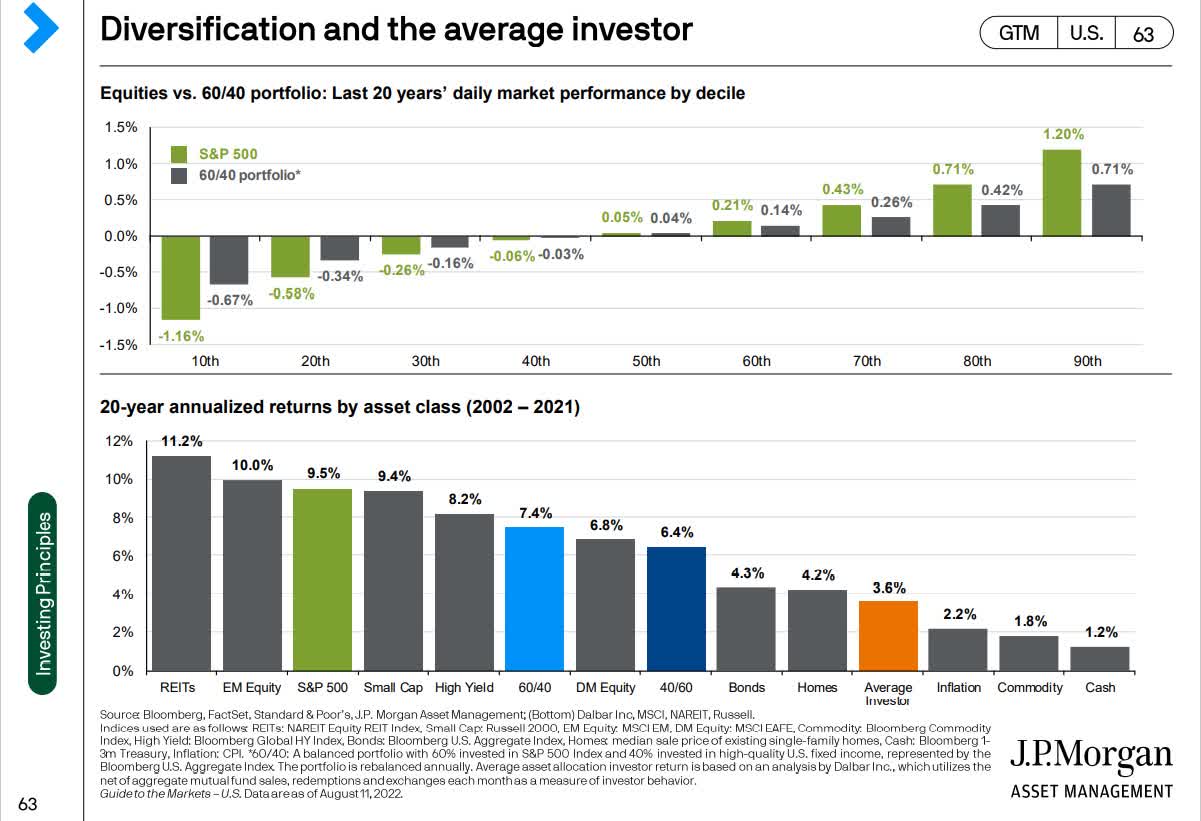
The average investor can’t help themselves. They try to time the market and over the last 20 years, half an investing lifetime for most people, that results in 1/3rd the returns of the stock market. Heck, it was 50% lower returns than just buying and holding a 60/40.
It means the average investor only did better than inflation, commodities, and cash.
Turbocharge Your Retirement Dreams With Dividend Stocks
Stocks have historically delivered 10% annual returns, or 7% after inflation for the last:
- 20 years = 3.9X adjusted for inflation
- 50 years = 29.5X real return
- 75 years = 160X real return
- 100 years = 868X real return
- 222 years = 3.3 million X real return
That’s absolutely incredible, the best-performing asset class in history.
Legacy Research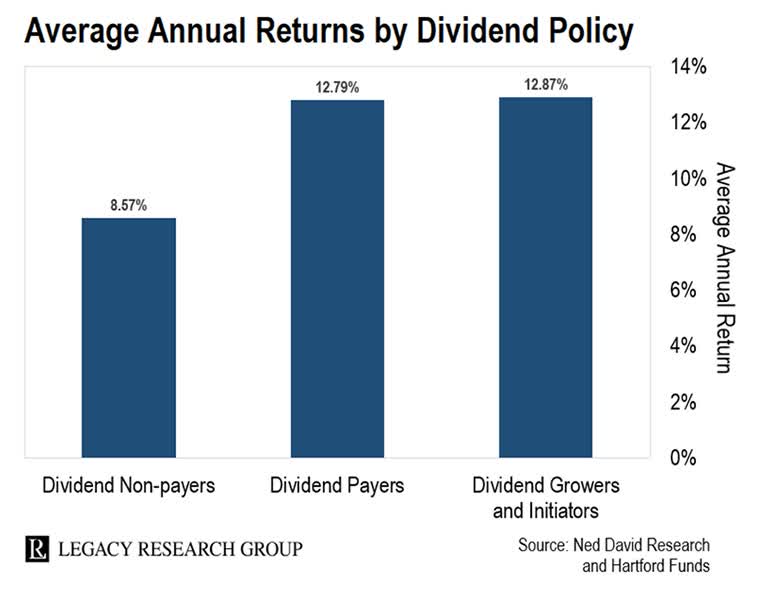
But dividend growth stocks have delivered 7X higher inflation-adjusted returns over the last 50 years. And do you know what the most dependable dividend stocks on earth are? The dividend aristocrats, companies with 25+ year dividend growth streaks.
So let me show you how to quickly and easily find the best 4+% yielding dividend aristocrats for 2023 and far beyond. The companies that can help you sleep-well-at-night in all market and economic conditions while retiring in safety and splendor.
How To Find The Best 4+% Yielding Dividend Aristocrats In 1 Minute
Let me show you how to screen the Dividend Kings Zen Research Terminal, which runs off the DK 500 Master List, to find the highest-yielding blue-chips on Wall Street easily.
The Dividend Kings 500 Master List includes some of the world’s best companies, including:
- every dividend champion (25+ year dividend growth streaks, including foreign aristocrats)
- every dividend aristocrat
- every dividend king (50+ year dividend growth streaks)
- every Ultra SWAN (as close to perfect quality companies as exist)
- the 20% highest quality REITs according to iREIT
- 40 of the world’s best growth blue-chips
| Step | Screening Criteria | Companies Remaining | % Of Master List |
| 1 | Reasonable Buy or better (Never Overpay For Stocks) | 347 | 69.40% |
| 2 | Dividend Champions (all companies with 25+ year dividend growth streaks) | 77 | 15.40% |
| 3 | 10+% long-term return potential (Market’s historical return) | 44 | 8.80% |
| 4 | 4+% ultra yield | 9 | 1.80% |
| Total Time | 1 Minute |
In just 60 seconds we were able to fine 9 of the best 4+% yielding dividend aristocrats you can buy for 2023 and beyond.
The Best 4+% Yielding Dividend Aristocrats For 2023
I’ve linked to articles exploring each company’s investment thesis, growth outlook, and risk profile.
Here they are in order of highest to lowest yield.
(Source: Dividend Kings Zen Research Terminal)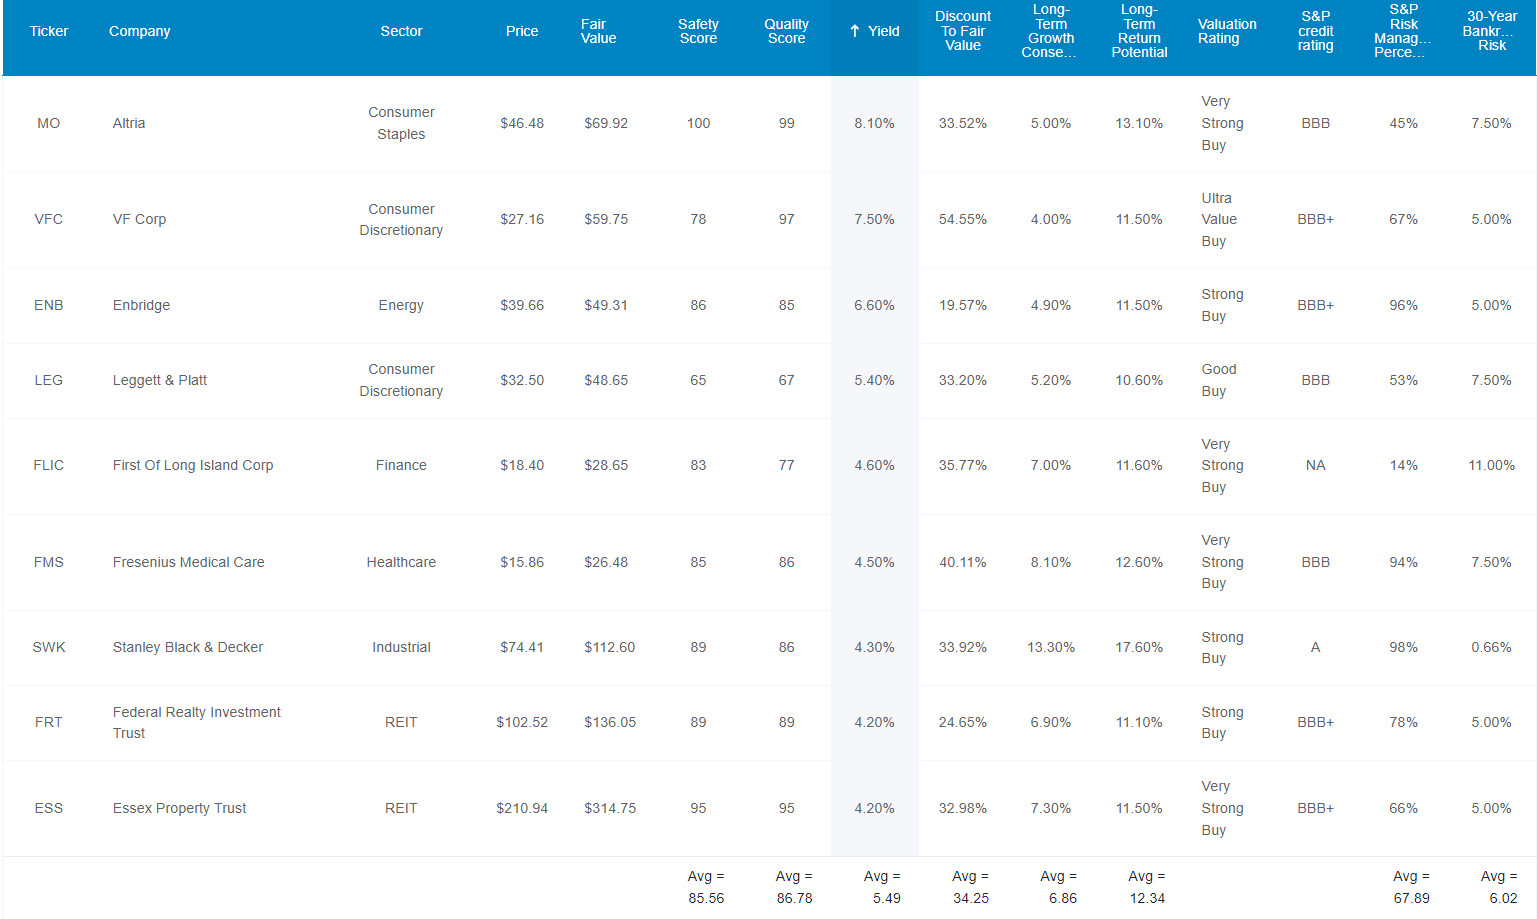
- Altria (MO)
- VF Corp (VFC)
- Enbridge (ENB)
- Leggett & Platt (LEG)
- First of Long Island Corp (FLIC)
- Fresenius Medical Care (FMS)
- Stanley Black & Decker (SWK)
- Federal Realty Investment Trust (FRT)
- Essex Property Trust (ESS)
Tax Implications
- ENB is a Canadian company
- 15% dividend tax withholding in taxable accounts
- no withholding in retirement accounts
- tax credit available to recoup withholding in taxable accounts
- own in a retirement account to avoid paperwork
- FMS is a German company
- 26.375% withholding
- own in a taxable account to qualify for the tax credit to recoup the withholding
FAST Graphs Up Front
Altria 2024 Consensus Total Return Potential
(Source: FAST Graphs, FactSet)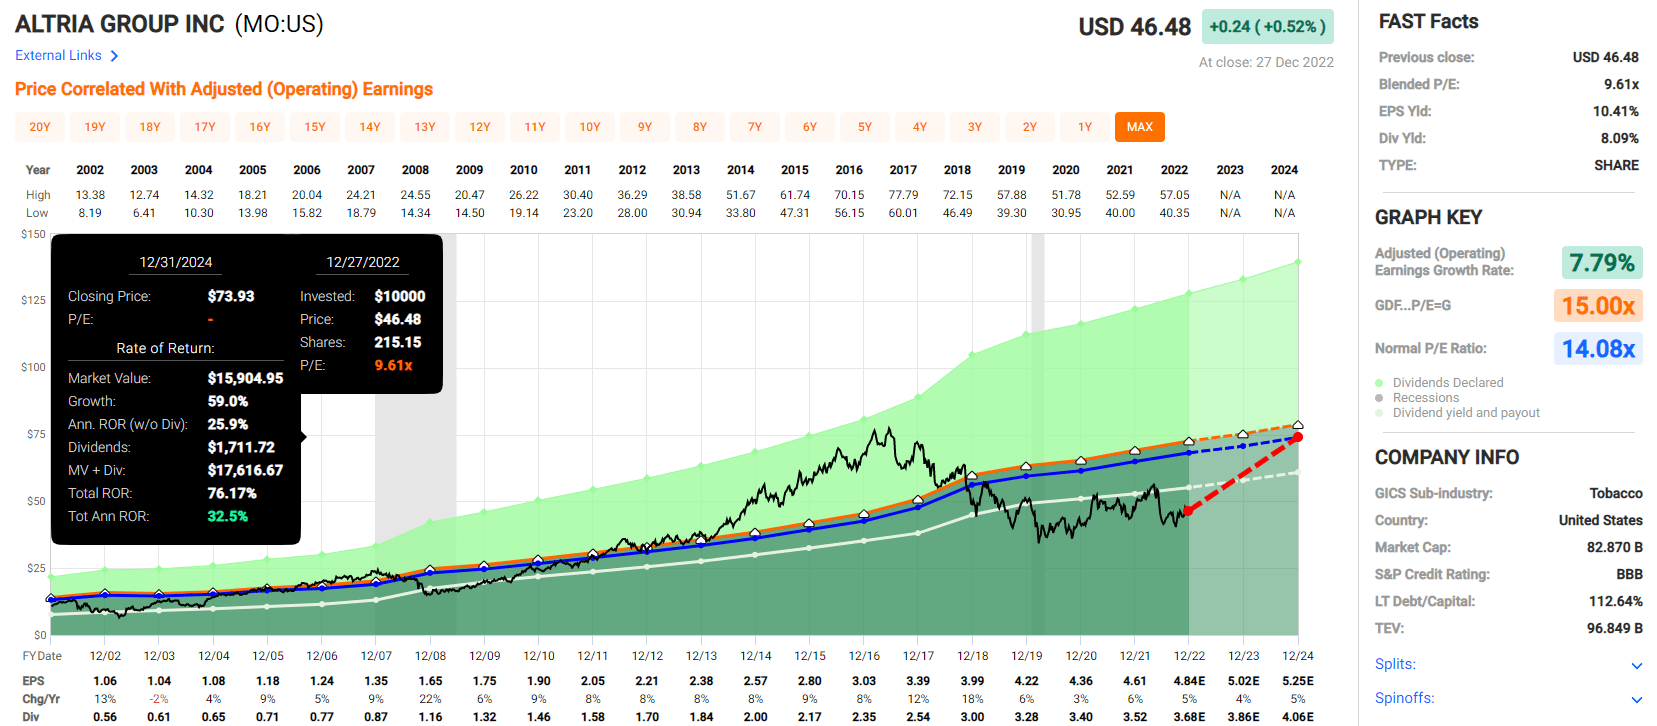
VF Corp 2024 Consensus Total Return Potential
(Source: FAST Graphs, FactSet)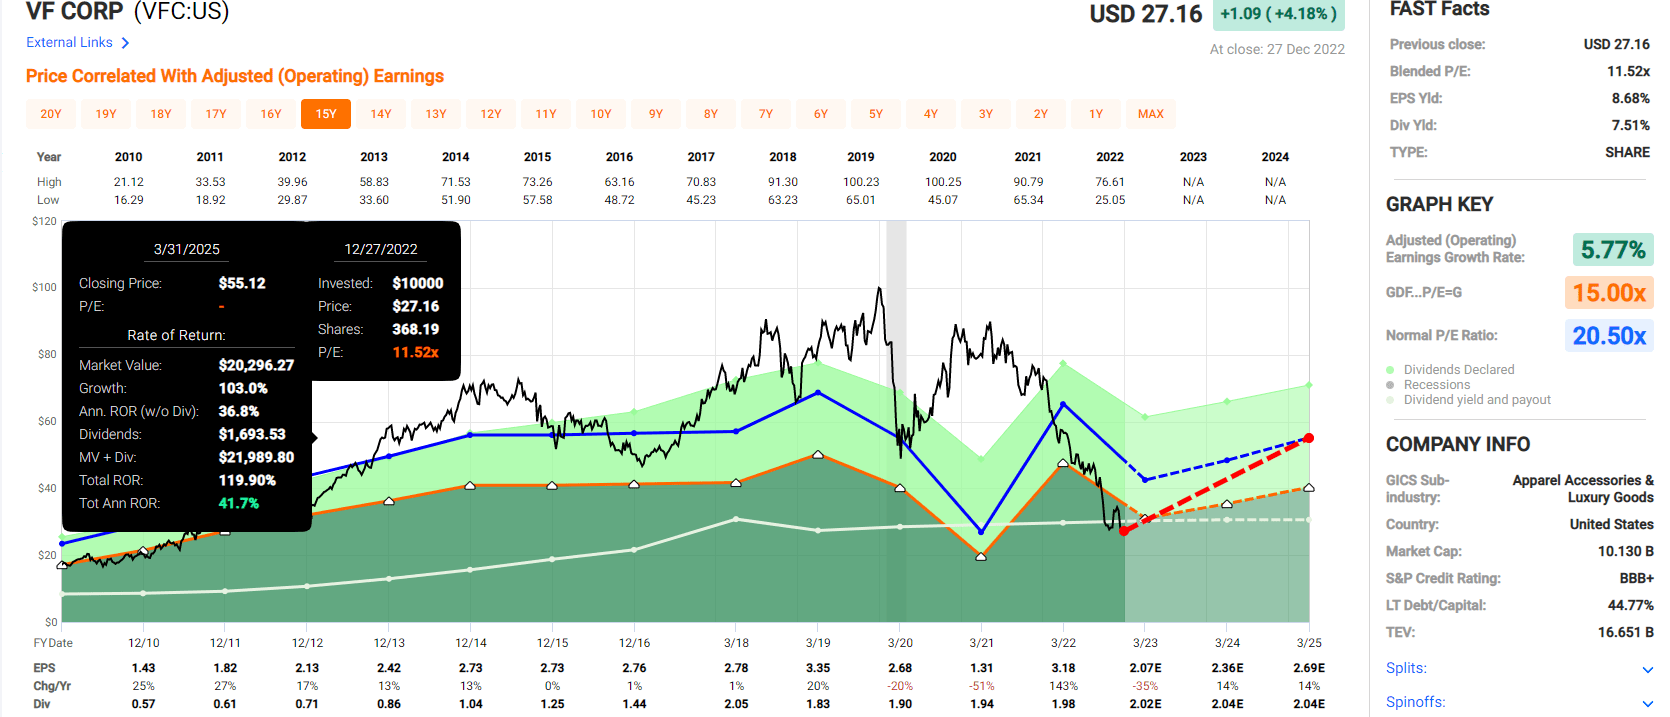
Enbridge 2024 Consensus Total Return Potential
(Source: FAST Graphs, FactSet)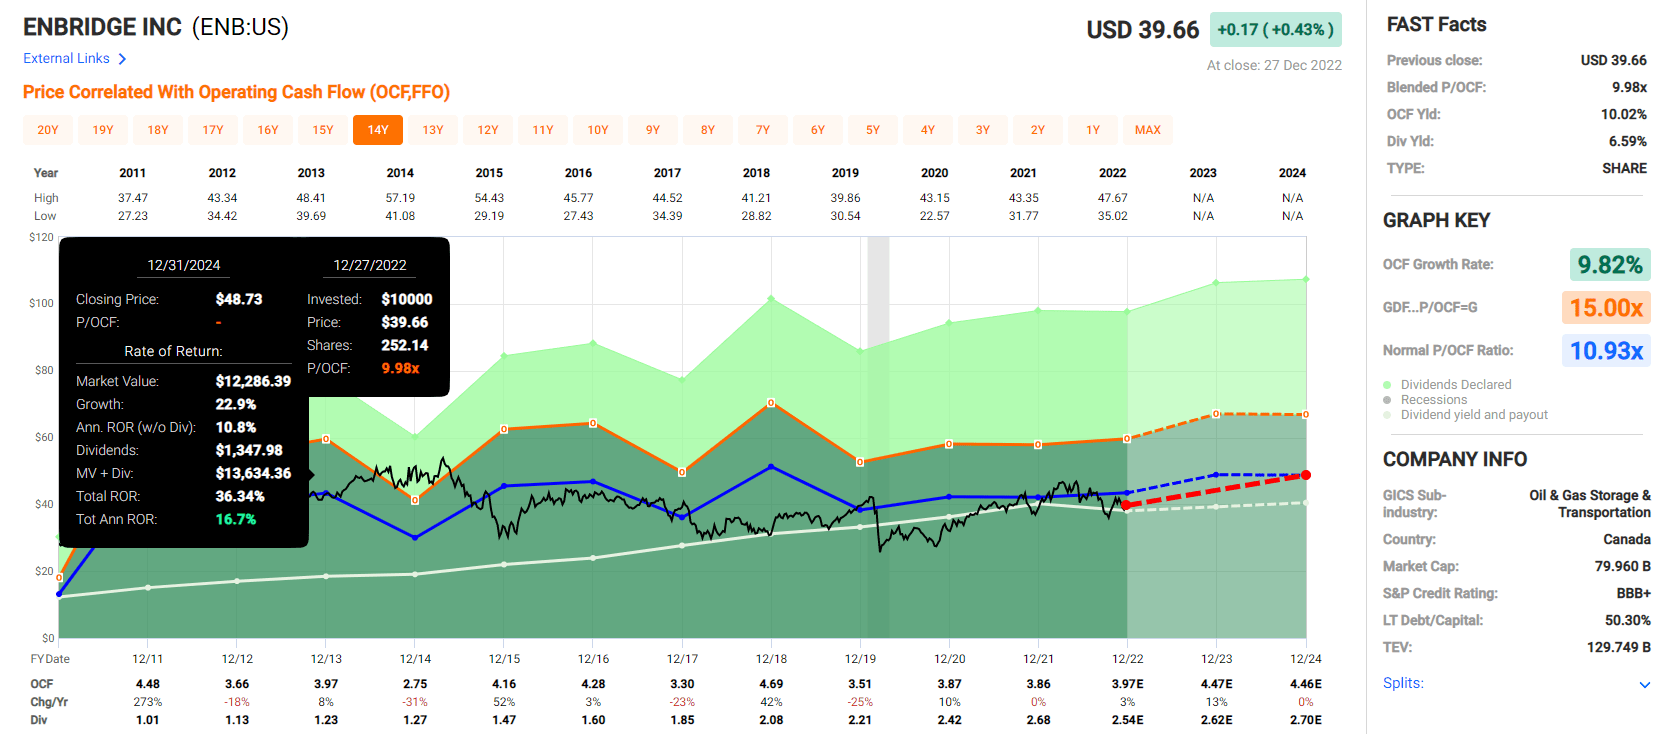
Leggett & Platt 2024 Consensus Total Return Potential
(Source: FAST Graphs, FactSet)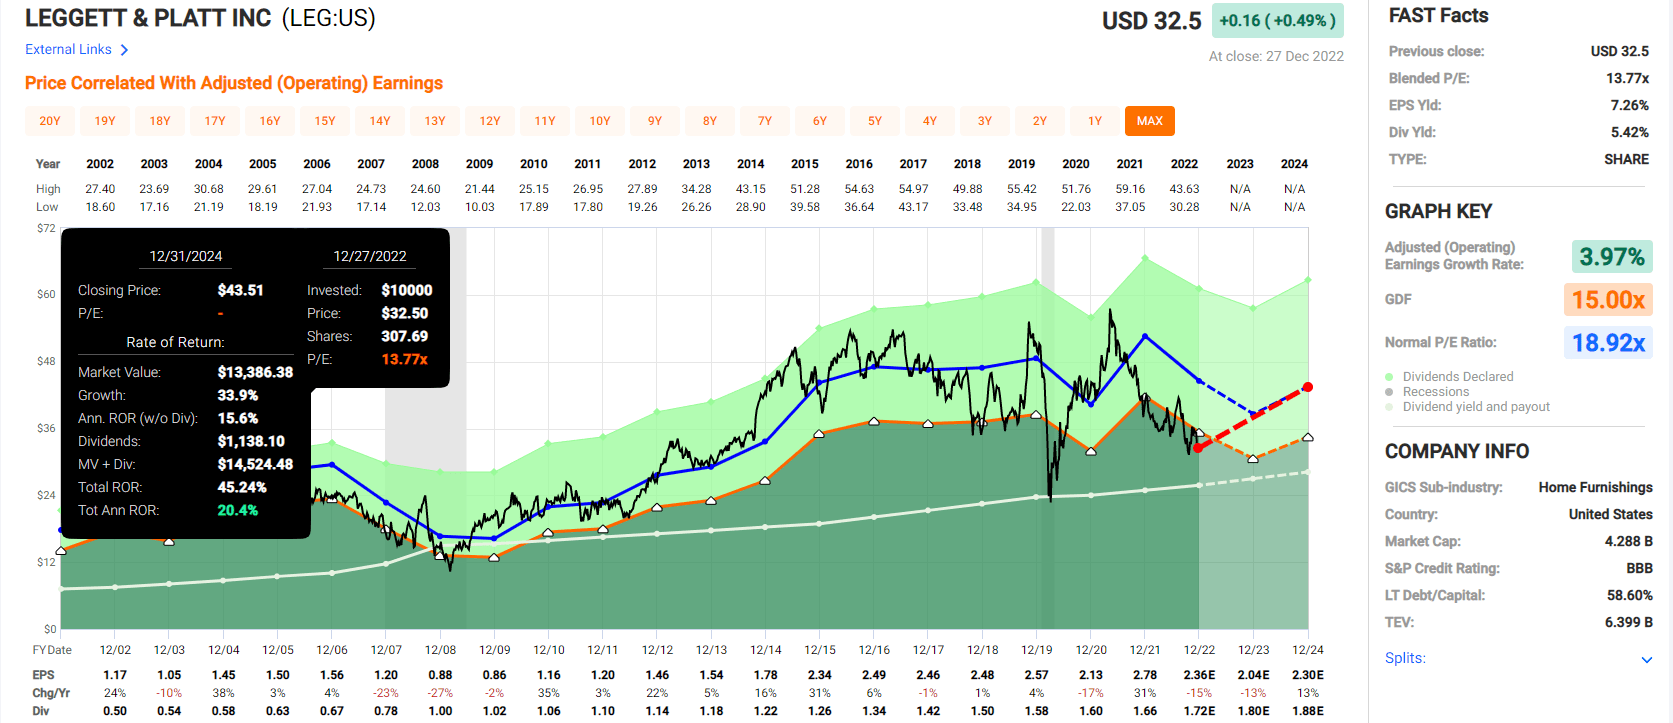
First of Long Island Corp 2024 Consensus Total Return Potential
(Source: FAST Graphs, FactSet)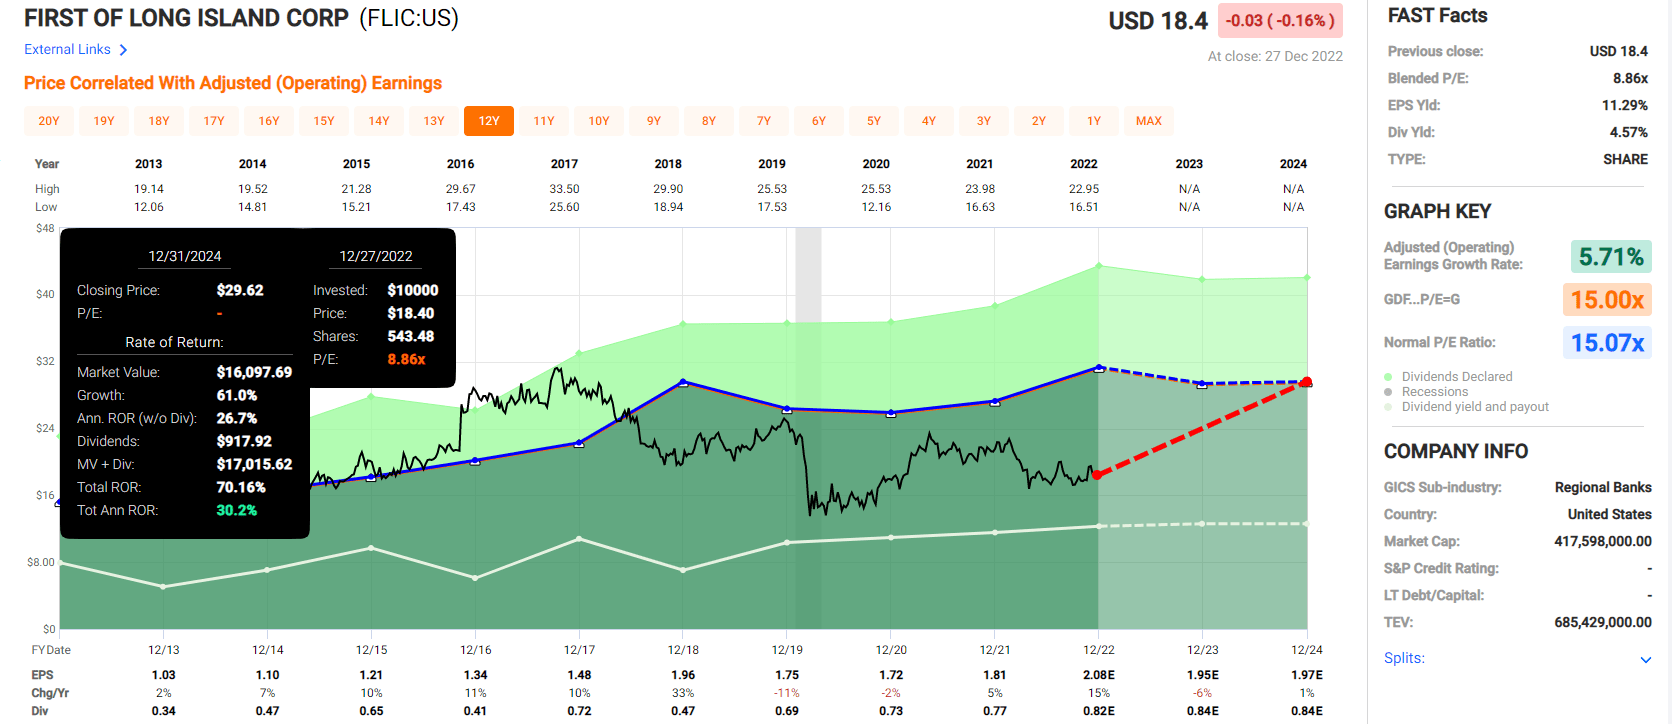
Fresenius Medical Care 2024 Consensus Total Return Potential
(Source: FAST Graphs, FactSet)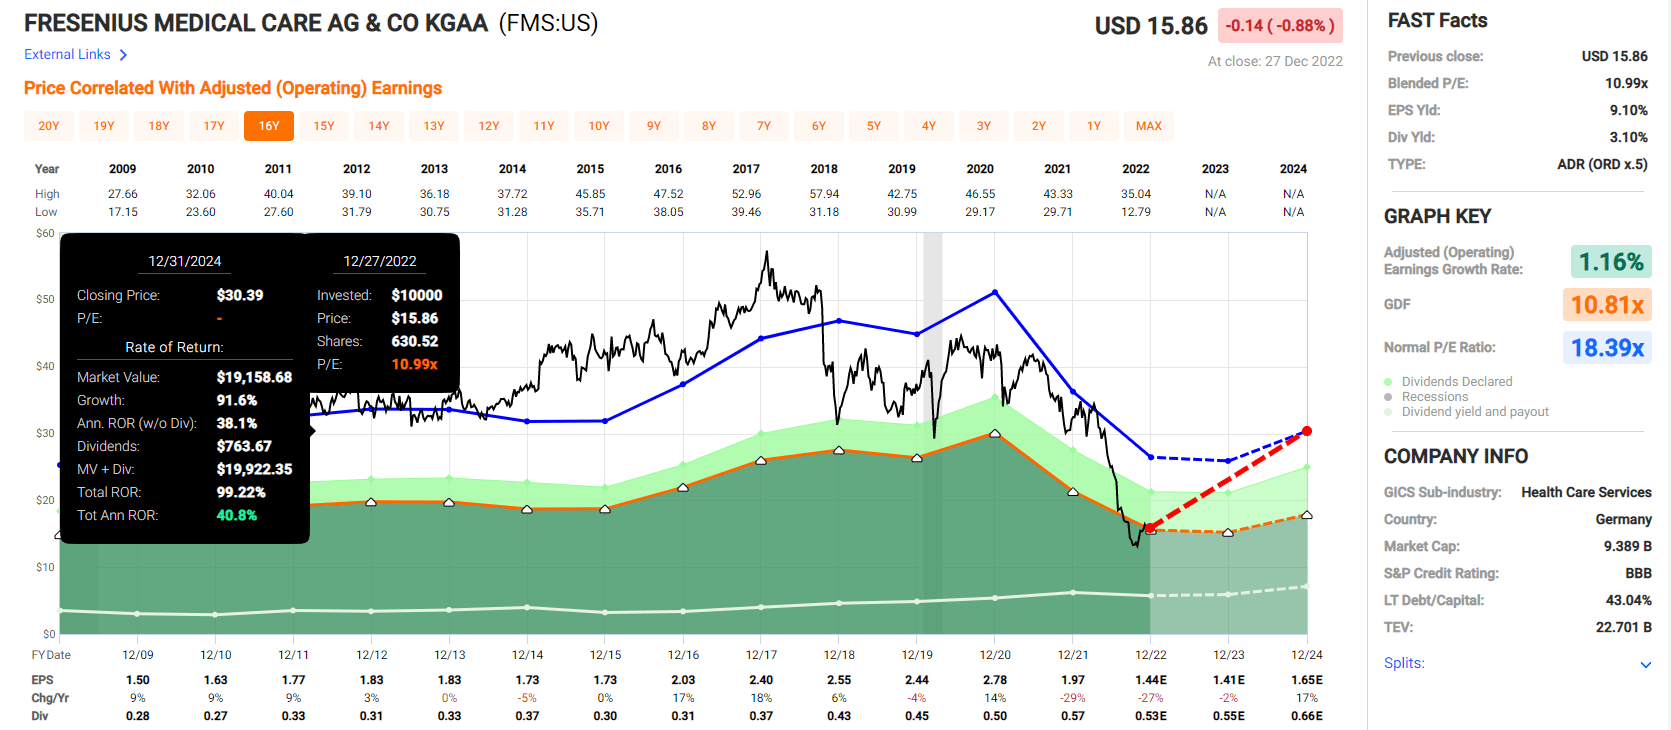
Stanley Black & Decker 2024 Consensus Total Return Potential
(Source: FAST Graphs, FactSet)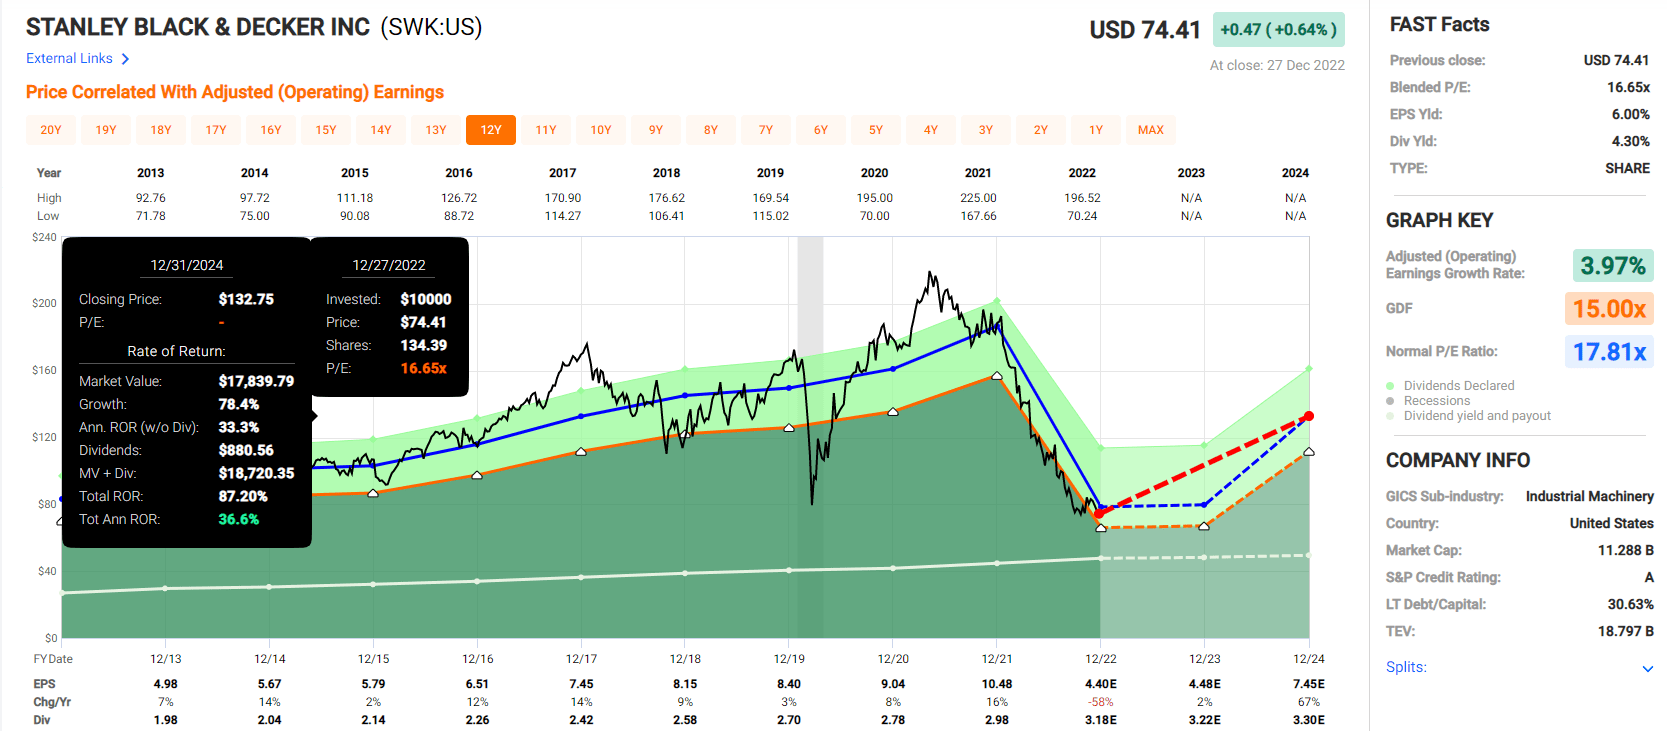
Federal Realty 2024 Consensus Total Return Potential
(Source: FAST Graphs, FactSet)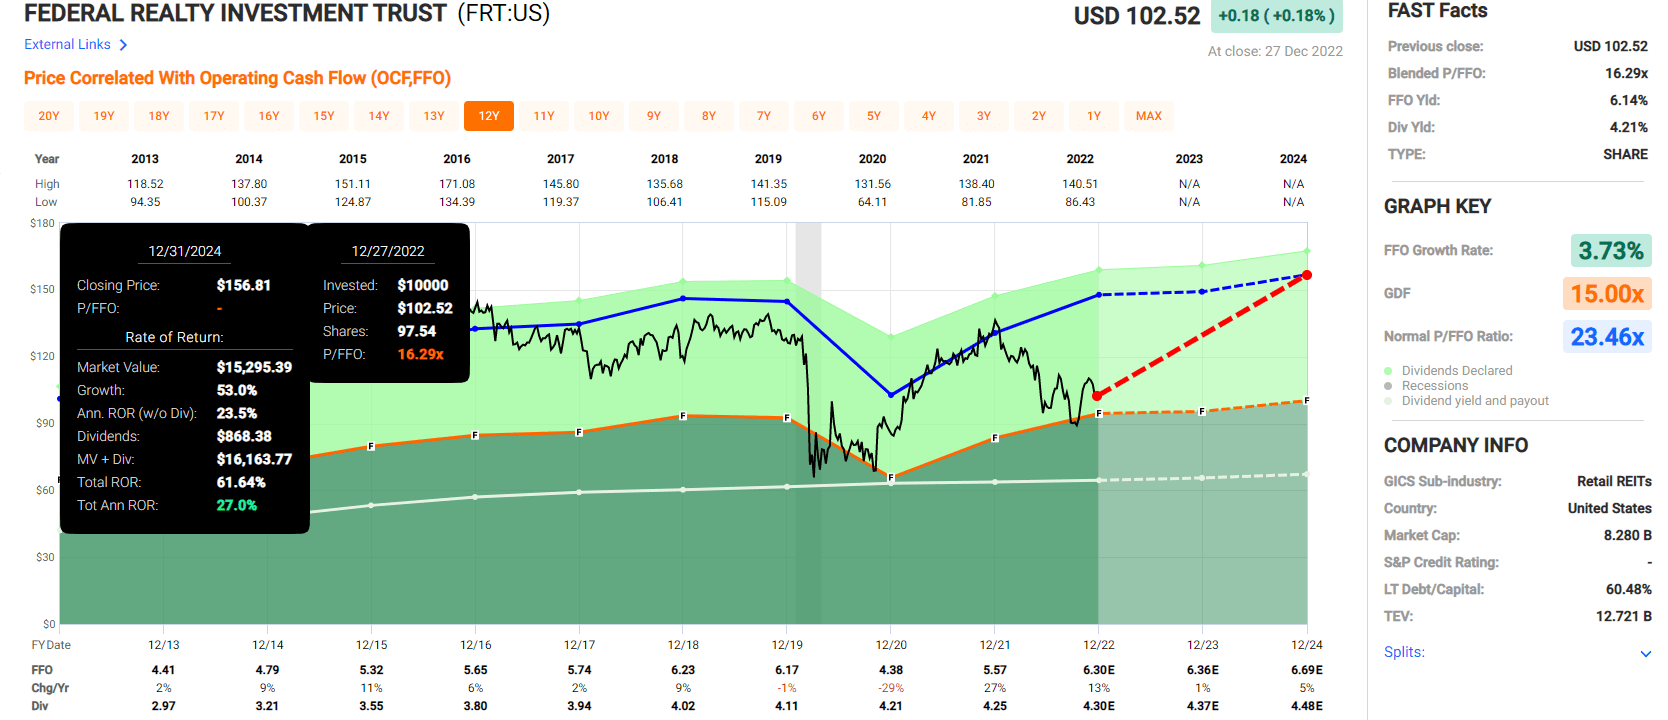
Essex Property 2024 Consensus Total Return Potential
(Source: FAST Graphs, FactSet)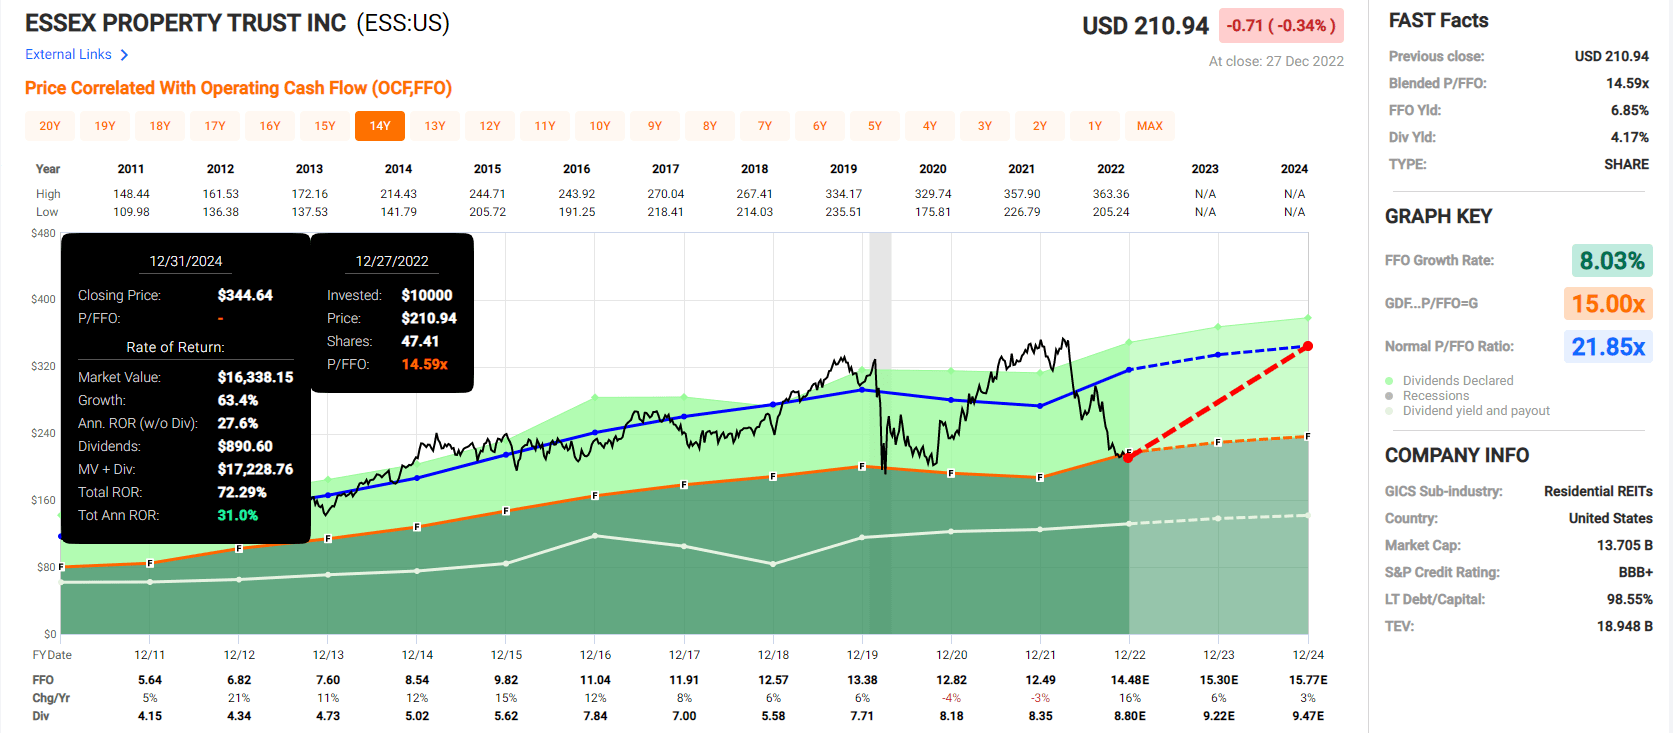
Now compare these to the S&P 500 consensus.
S&P 500 2024 Consensus Total Return Potential
(Source: FAST Graphs, FactSet)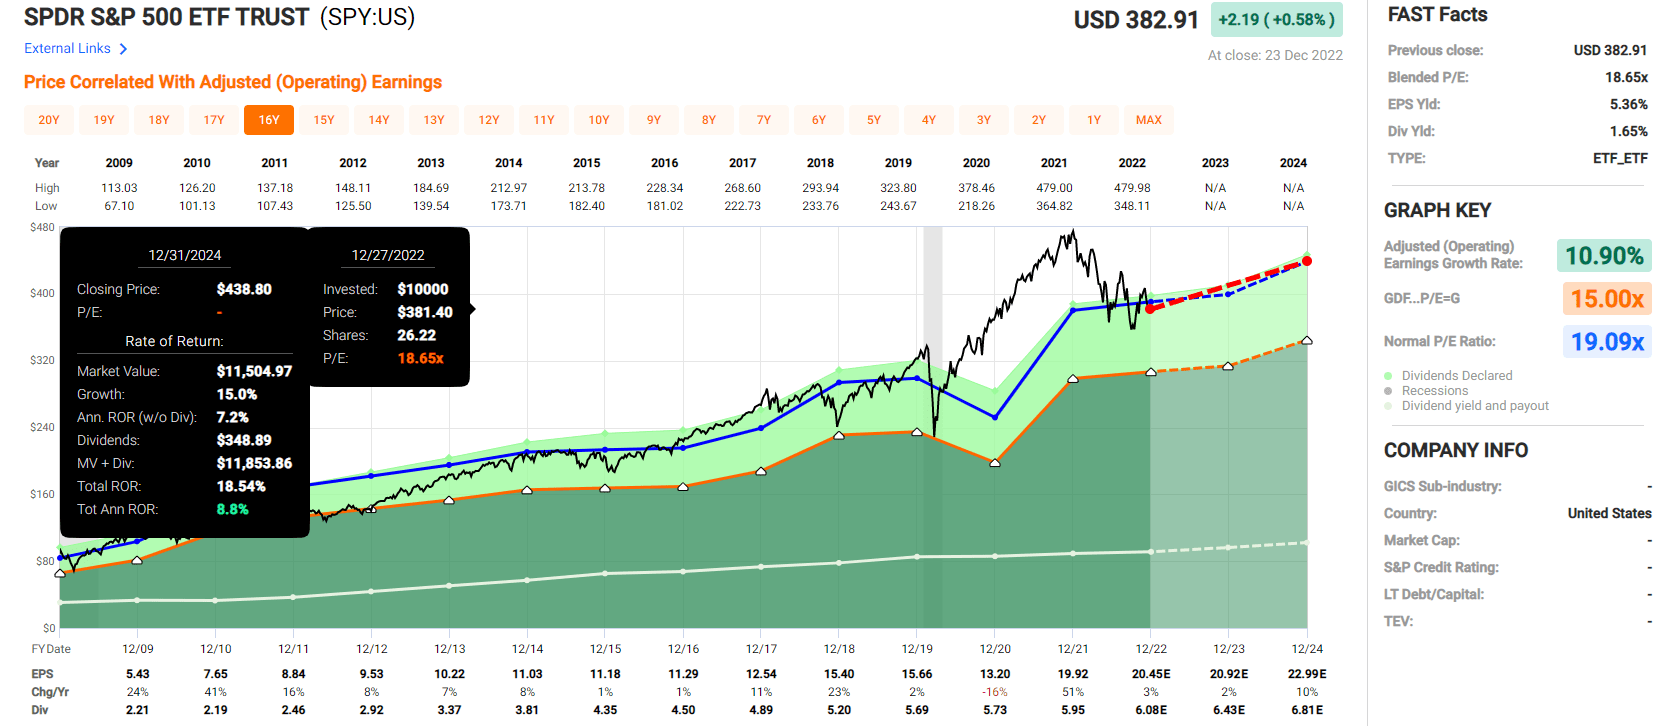
Analysts expect the market to deliver 19% total returns over the next two years, or about 9% annually.
They expect these 4+% yielding aristocrats to potentially deliver 31% annual returns or 72%.
- almost 4X the total return potential of the S&P over the next two years
- and more than 3X the much safer yield
But my goal isn’t to help you potentially make 72% returns in two years or 31% in a year. I want to help you achieve potentially life-changing safe high-yield, and strong returns.
9 Of The Safest High-Yield Blue-Chips On Earth
(Source: Dividend Kings Zen Research Terminal)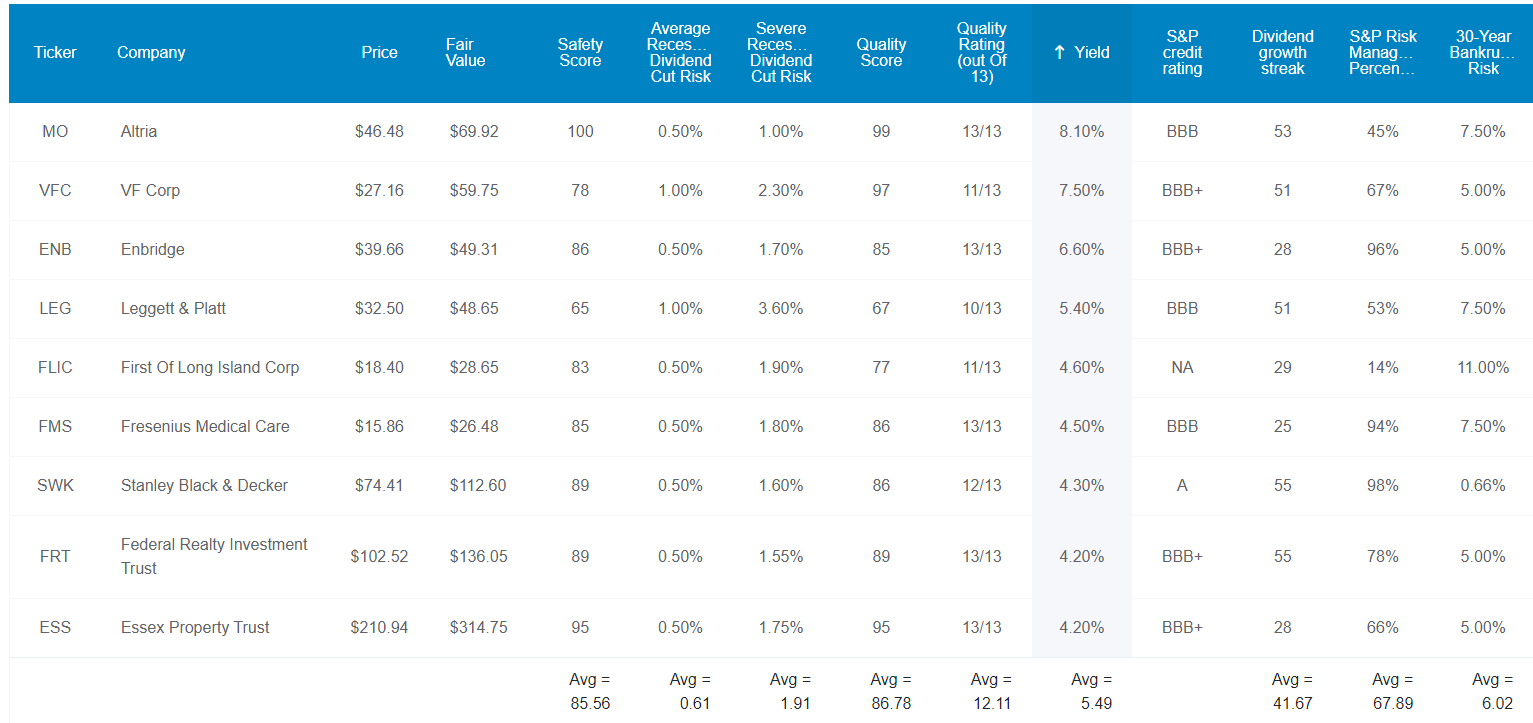
These are 12/13 Super SWAN (sleep-well-at-night) dividend aristocrats. What does that mean?
- 0.61% average historical recession (since WWII) dividend cut risk
- 1.91% average severe recession (Great Recession, Pandemic level) dividend cut risk
Ben Graham considered a 20+ year streak without a dividend cut an important sign of quality and a 20+ year dividend growth streak a sign of excellence.
These aristocrats average a 42-year dividend growth streak, more than 2X the Graham standard of excellence.
That means they’ve been paying rising dividends every year since 1980 through:
- seven recessions
- two economic crises
- interest rates as high as 20%
- inflation as high as 15%
- 10-year Treasury yields as high as 16%
- mortgage rates as high as 16%
- nine bear markets
- two major invasions
- 9/11
- a once in a century pandemic
S&P estimates their average 30-year bankruptcy risk at 6.02%, a BBB+ stable credit rating.
S&P also estimates their long-term risk management at 68th percentile.
Risk Management You Can Trust No Matter What Happens In The Future
DK uses S&P Global’s global long-term risk-management ratings for our risk rating.
- S&P has spent over 20 years perfecting their risk model
- which is based on over 30 major risk categories, over 130 subcategories, and 1,000 individual metrics
- 50% of metrics are industry specific
- this risk rating has been included in every credit rating for decades
The DK risk rating is based on the global percentile of how a company’s risk management compares to 8,000 S&P-rated companies covering 90% of the world’s market cap.
These High-Yield Aristocrats score 68th Percentile On Global Long-Term Risk Management
S&P’s risk management scores factor in things like:
- supply chain management
- crisis management
- cyber-security
- privacy protection
- efficiency
- R&D efficiency
- innovation management
- labor relations
- talent retention
- worker training/skills improvement
- occupational health & safety
- customer relationship management
- business ethics
- climate strategy adaptation
- sustainable agricultural practices
- corporate governance
- brand management
Long-Term Risk Management Is The 216th Best In The Master List 57th Percentile In The Master List)
| Classification | S&P LT Risk-Management Global Percentile |
Risk-Management Interpretation |
Risk-Management Rating |
| BTI, ILMN, SIEGY, SPGI, WM, CI, CSCO, WMB, SAP, CL | 100 | Exceptional (Top 80 companies in the world) | Very Low Risk |
| Strong ESG Stocks | 86 |
Very Good |
Very Low Risk |
| Foreign Dividend Stocks | 77 |
Good, Bordering On Very Good |
Low Risk |
| Ultra SWANs | 74 | Good | Low Risk |
| 4+% Yielding Dividend Aristocrats | 68 | Above-Average (Bordering On Good) | Low Risk |
| Dividend Aristocrats | 67 | Above-Average (Bordering On Good) | Low Risk |
| Low Volatility Stocks | 65 | Above-Average | Low Risk |
| Master List average | 61 | Above-Average | Low Risk |
| Dividend Kings | 60 | Above-Average | Low Risk |
| Hyper-Growth stocks | 59 | Average, Bordering On Above-Average | Medium Risk |
| Dividend Champions | 55 | Average | Medium Risk |
| Monthly Dividend Stocks | 41 | Average | Medium Risk |
(Source: DK Research Terminal)
Their risk-management consensus is in the top 43% of the world’s best blue chips and is similar to:
- Coca-Cola (KO): Ultra SWAN dividend king
- PepsiCo (PEP): Super SWAN dividend king
- VF Corp (VFC): speculative blue-chip quality dividend king
- Clorox (CLX): Super SWAN dividend aristocrat
- Amazon (AMZN): Ultra SWAN
OK, so now that you know why these are some of the safest 5.5% yielding stocks on earth, here’s why you might want to buy them today.
Wonderful Companies At Wonderful Prices
(Source: Dividend Kings Zen Research Terminal)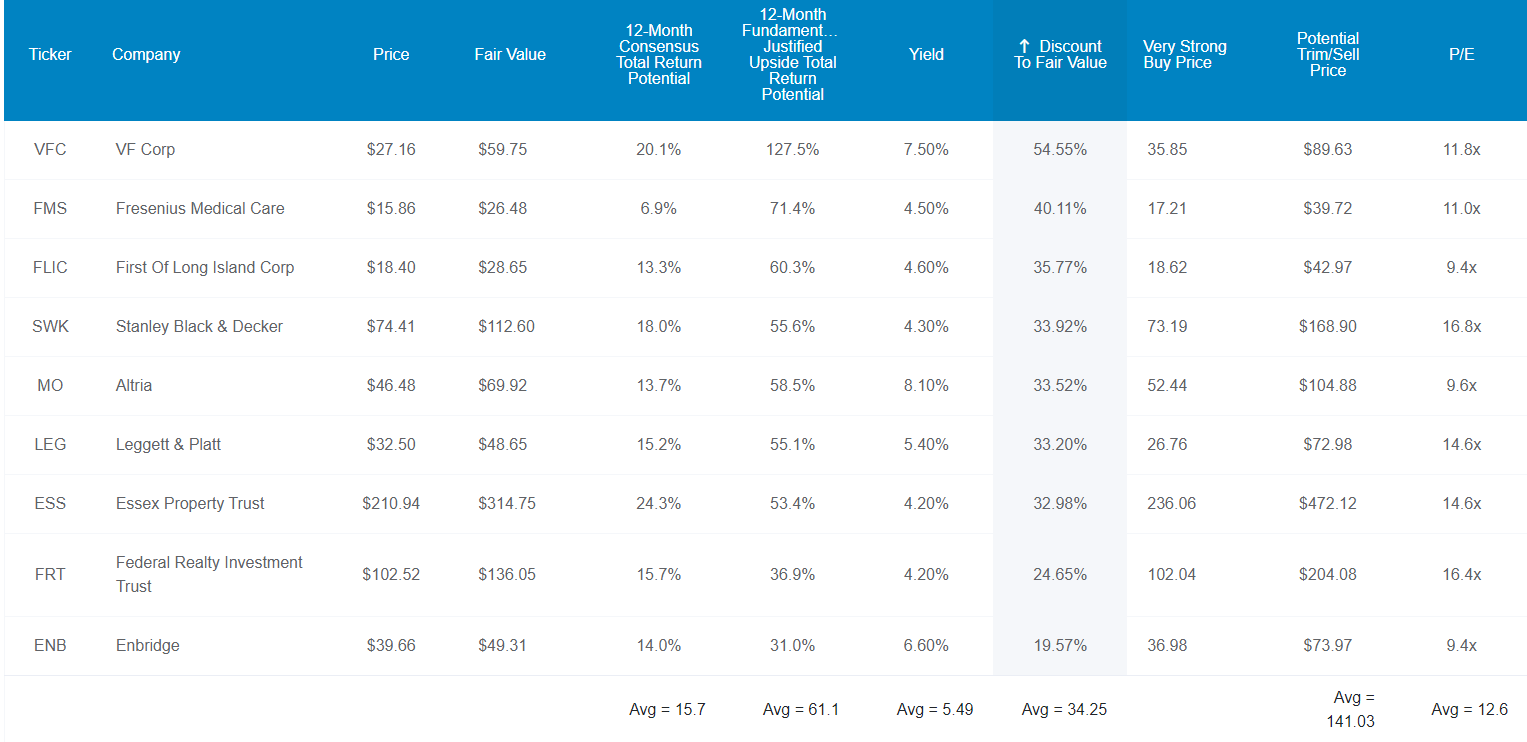
These aristocrats offer a very safe 5.5% yield and trade at 12.6X earnings and cash flow. They are 34% historically undervalued.
For context, the S&P 500 trades at 16.6X earnings and is 1% historically undervalued.
The last time the S&P traded at 12.6X earnings was in the 2011 bear market.
Even with a recession looming in 2023, analysts expect these aristocrats to deliver 16% total returns within 12 months.
They are so undervalued that their 12-month fundamentally justified total return potential is 61%.
- If they all grow as expected and return to mid-range historical market-determined fair value within 12 months you will make 61% in the next year
But my goal isn’t to help you make 16% in 12 months, or 61% in a year, or 72% in two years. I’m trying to help you potentially make 32.5X returns over the next 30 years.
How These 4+% Yielding Aristocrats Can Help You Potentially Retire In Safety And Splendor
(Source: Dividend Kings Zen Research Terminal)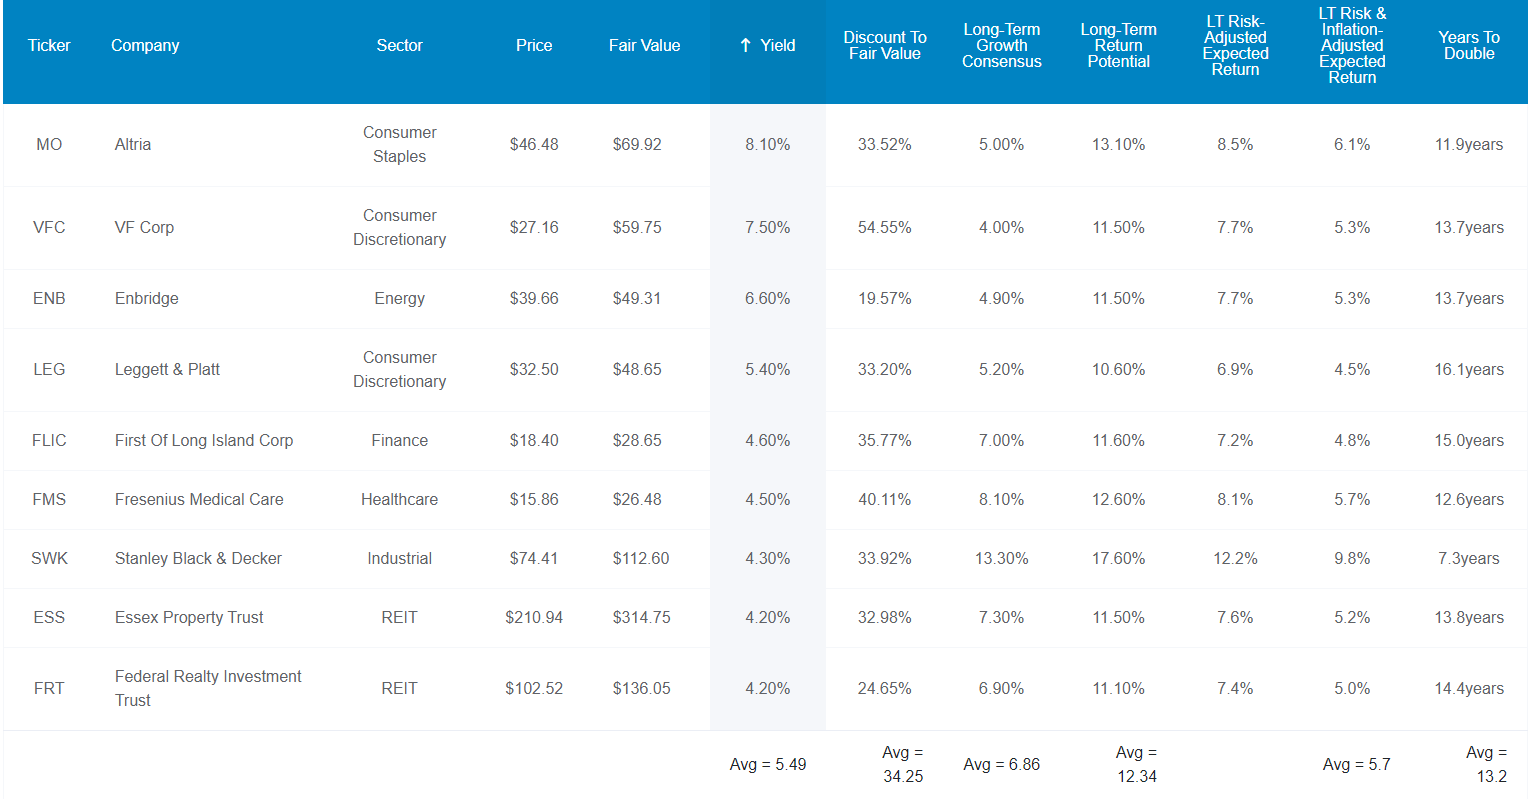
These aristocrats not only offer one of the most dependable and safest 5.5% yields on earth but are also growing at almost 7% and offer 12.3% long-term return potential. How impressive is that?
Long-Term Consensus Total Return Potential
| Investment Strategy | Yield | LT Consensus Growth | LT Consensus Total Return Potential | Long-Term Risk-Adjusted Expected Return |
| 4+% Yielding Dividend Aristocrats | 5.5% | 6.8% | 12.3% | 8.6% |
| Vanguard Dividend Appreciation ETF | 1.9% | 10.2% | 12.1% | 8.5% |
| Nasdaq | 0.8% | 10.9% | 11.7% | 8.2% |
| Schwab US Dividend Equity ETF | 3.4% | 7.6% | 11.0% | 7.7% |
| Dividend Aristocrats | 1.9% | 8.5% | 10.4% | 7.3% |
| S&P 500 | 1.8% | 8.5% | 10.3% | 7.2% |
(Source: DK Research Terminal, FactSet, Morningstar, Ycharts)
How do the prospects of earning more than 3X the market’s yield while potentially beating every popular investing strategy, including the Nasdaq, strike you?
Inflation-Adjusted Consensus Return Potential: $1,000 Initial Investment
| Time Frame (Years) | 7.8% CAGR Inflation-Adjusted S&P 500 Consensus | 8.0% Inflation-Adjusted Aristocrat Consensus | 9.9% CAGR Inflation-Adjusted High-Yield Aristocrat Consensus | Difference Between Inflation-Adjusted High-Yield Aristocrat Consensus And S&P Consensus |
| 5 | $1,453.75 | $1,469.33 | $1,603.20 | $149.45 |
| 10 | $2,113.39 | $2,158.92 | $2,570.26 | $456.87 |
| 15 | $3,072.33 | $3,172.17 | $4,120.65 | $1,048.31 |
| 20 | $4,466.40 | $4,660.96 | $6,606.23 | $2,139.83 |
| 25 | $6,493.02 | $6,848.48 | $10,591.13 | $4,098.11 |
| 30 (retirement time frame) | $9,439.23 | $10,062.66 | $16,979.73 | $7,540.50 |
| 35 | $13,722.27 | $14,785.34 | $27,221.95 | $13,499.68 |
| 40 | $19,948.73 | $21,724.52 | $43,642.31 | $23,693.57 |
| 45 | $29,000.45 | $31,920.45 | $69,967.47 | $40,967.02 |
| 50 | $42,159.37 | $46,901.61 | $112,172.04 | $70,012.67 |
| 55 | $61,289.14 | $68,913.86 | $179,834.53 | $118,545.39 |
| 60 (investing lifetime) | $89,099.03 | $101,257.06 | $288,311.22 | $199,212.19 |
(Source: DK Research Terminal FactSet)
Over the next 30 years, analysts think these aristocrats could deliver 32.5X returns or 17X after inflation. Over an investing lifetime, they have the potential for almost 300X real returns.
| Time Frame (Years) | Ratio Inflation-Adjusted High-Yield Aristocrat Consensus/Aristocrat Consensus | Ratio Inflation-Adjusted High-Yield Aristocrat Consensus vs. S&P consensus |
| 5 | 1.09 | 1.10 |
| 10 | 1.19 | 1.22 |
| 15 | 1.30 | 1.34 |
| 20 | 1.42 | 1.48 |
| 25 | 1.55 | 1.63 |
| 30 | 1.69 | 1.80 |
| 35 | 1.84 | 1.98 |
| 40 | 2.01 | 2.19 |
| 45 | 2.19 | 2.41 |
| 50 | 2.39 | 2.66 |
| 55 | 2.61 | 2.93 |
| 60 | 2.85 | 3.24 |
(Source: DK Research Terminal FactSet)
In other words, over the next 30 years, 3X the very safe yield of the market today and potentially 2X the real returns.
Over an investing lifetime, 3X the very safe yield today and more than 3X the potential real returns.
OK, this sounds amazing, but what proof do we have that these aristocrats can deliver anything close to 12% long-term returns?
Historical Returns Since 1996 (Annual Rebalancing)
The future doesn’t repeat, but it often rhymes. – Mark Twain
Remember, “past performance is no guarantee of future results.”
But studies show that blue chips with relatively stable fundamentals offer predictable returns based on yield, growth and valuation mean reversion over time.
Bank of America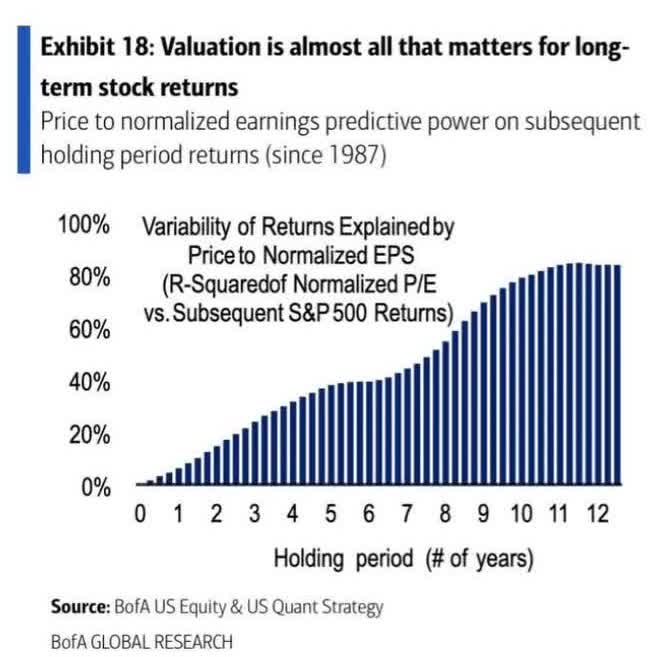
26 years is a time period when 94% of returns are a result of fundamentals, not luck.
Portfolio Visualizer Premium 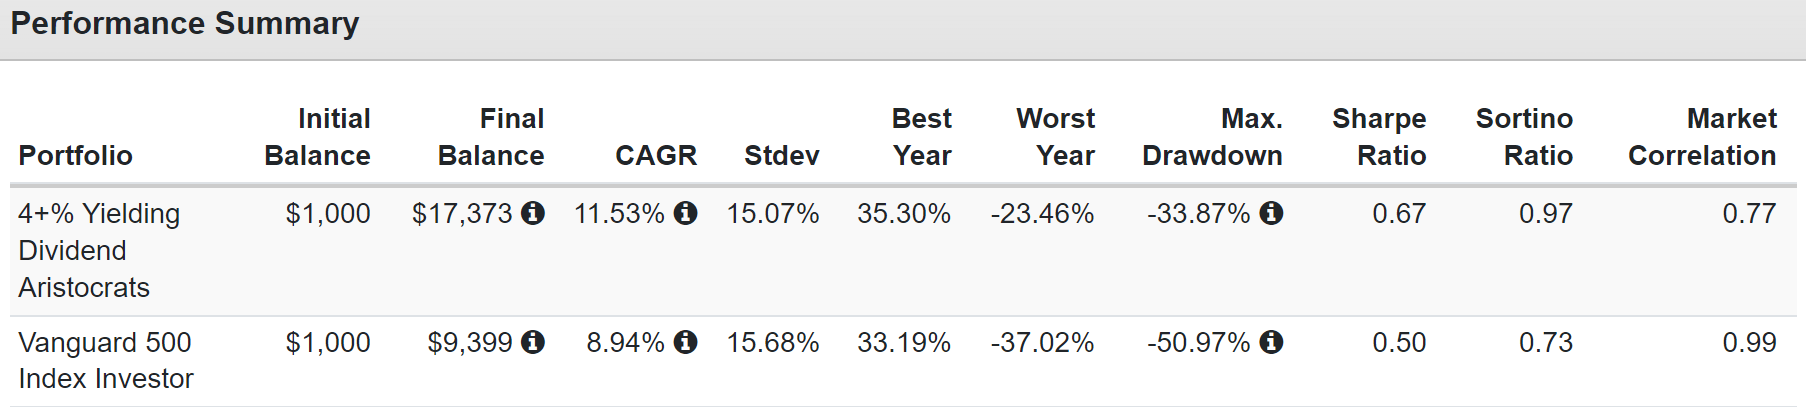
Beating the market by about 2% per year, just like analysts expect in the future.
And remember, we’re in a bear market. Check the rolling returns to see the average annual rolling return to see how reasonable those future return forecasts are.
Portfolio Visualizer Premium 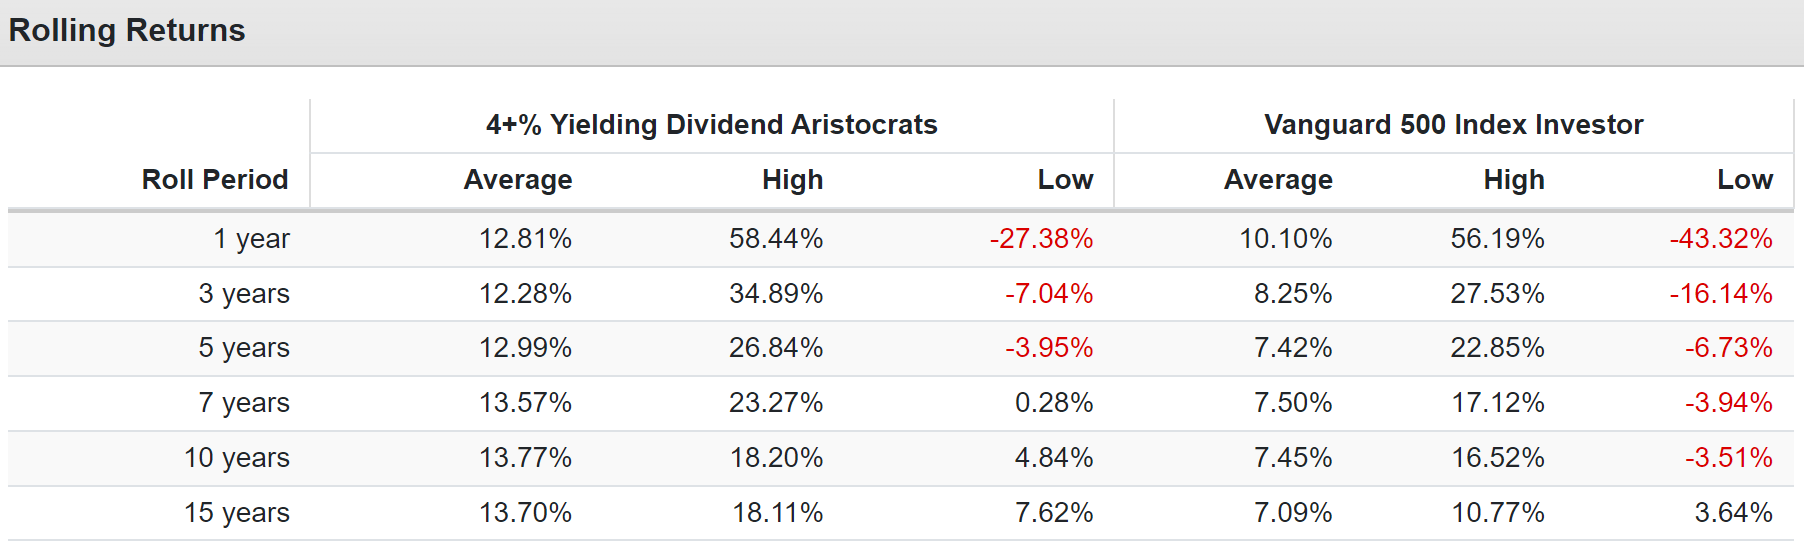
12.8% average annual returns vs. 12.3% consensus, and the S&P delivered 10.1% vs. 10.2% expected in the future.
These aristocrats didn’t just beat the market; they spanked it consistently across every average rolling time frame.
Dividend Income Rich Retirements Are Made Of
2007 and 2008 were 3 MO spinoffs ((Source: Portfolio Visualizer Premium))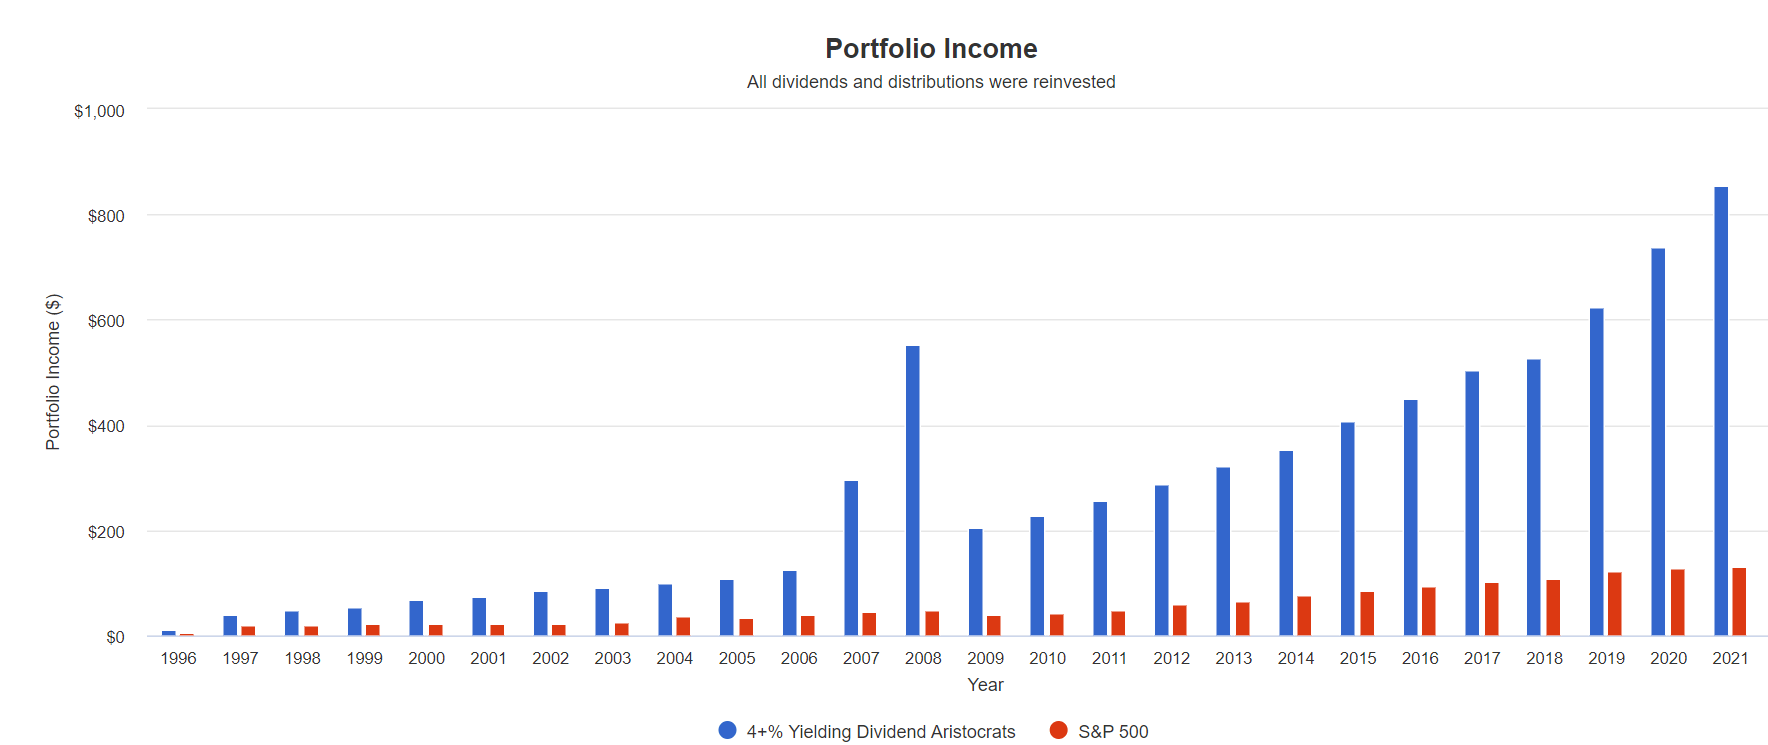
Cumulative Dividend Income Since 1997 Per $1,000 Investment
| Metric | S&P | 4+% Yielding Dividend Aristocrats |
| Total Dividends | $1,573 | $8,415 |
| Total Inflation-Adjusted Dividends | $841.18 | $4,500.00 |
| Annualized Income Growth Rate | 7.2% | 13.7% |
| Total Income/Initial Investment % | 1.57 | 8.42 |
| Inflation-Adjusted Income/Initial Investment % | 0.84 | 4.50 |
| More Inflation-Adjusted Income Than S&P 500 | NA | 5.35 |
| Starting Yield | 2.0% | 4.1% |
| Today’s Annual Dividend Return On Your Starting Investment (Yield On Cost) | 11.3% | 101.2% |
| 2022 Inflation-Adjusted Annual Dividend Return On Your Starting Investment (Inflation-Adjusted Yield On Cost) | 6.0% | 54.1% |
(Source: Portfolio Visualizer Premium)
These aristocrats had 2X the annual dividend growth rate for a quarter-century, delivering 5.4X more inflation-adjusted dividends. A 4.1% yield in 1997 is now a 54% inflation-adjusted yield on cost, 9X more than the S&P 500.
How To Turn These Aristocrats Into The Ultimate Sleep-Well-At-Night Retirement Portfolio
Investing 100% of your money into just nine dividend aristocrats isn’t a terrible idea, except for one thing. Any pure stock portfolio will be highly volatile and might cause you to panic sell at the worst possible time.
- Warren Buffett calls avoiding becoming a forced seller for emotional or financial reasons the most important secret to successful investing.
(Source: Portfolio Visualizer Premium)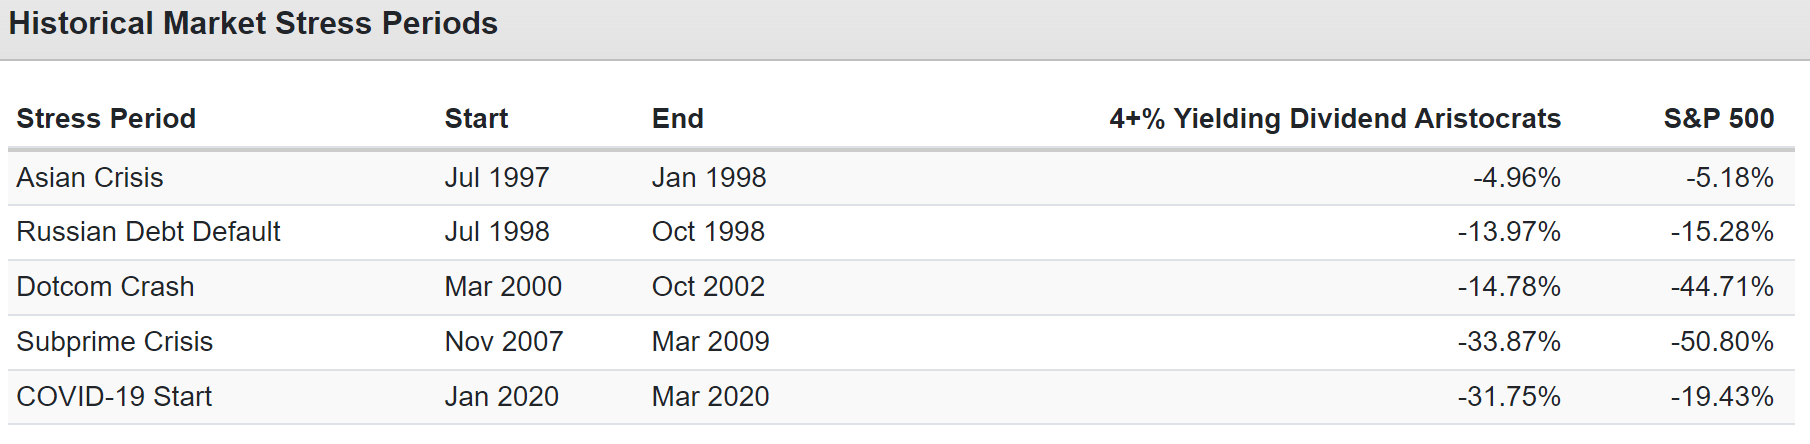
Most of the time, during corrections, these high-yield aristocrats are less volatile than the market, but not always.
(Source: Portfolio Visualizer Premium)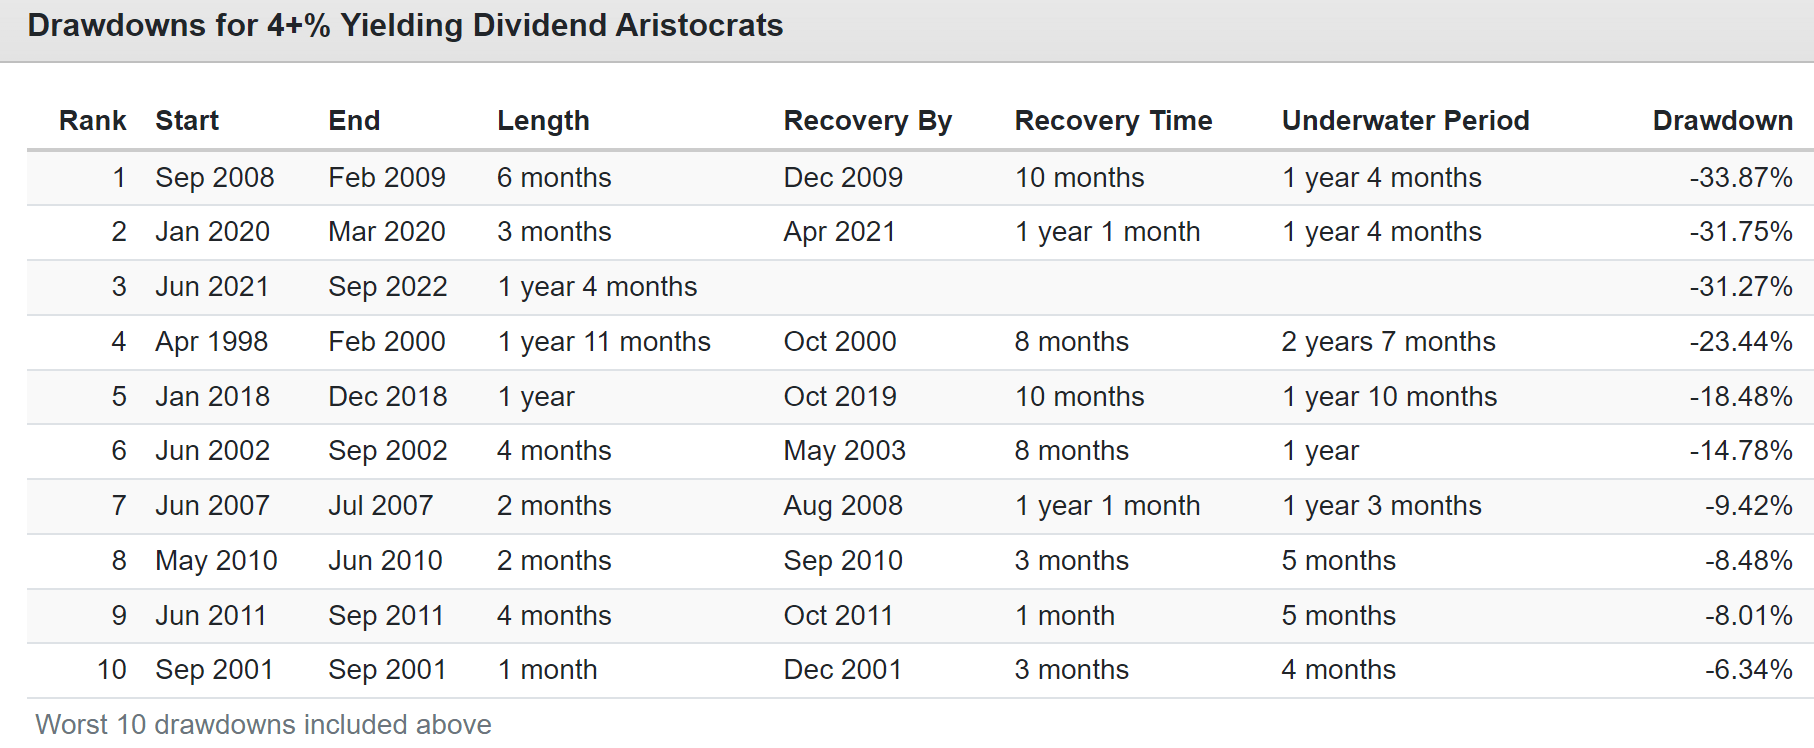
While a 34% peak decline during the Great Recession, when the S&P fell 58%, and a 60/40 fell 44%, is impressive, it’s potentially more than you might be able to emotionally handle.
So here’s how to turn these high-yield aristocrats into the ultimate sleep-well-at-night portfolio.
- 33.3% SCHD (99th percentile high-yield ETF)
- 16.7% EDV (gold-standard long bond ETF)
- 16.7% DBMF (the Vanguard of hedge funds)
- 33.3% these high-yield dividend aristocrats (3.7% each)
This is the Dividend Kings ZEUS strategy for long-term recession-optimized portfolios.
- ZEUS = Zen Extraordinary Ultra SWAN portfolio
ZEUS is designed to deliver:
- 2X to 3X the safe yield of a 60/40
- market-like returns
- 30% to 82% smaller peak declines than the 60/40 and S&P 500 during even the worst market crashes
In other words, ZEUS is the king of sleep-well-at-night retirement portfolio strategies and lets you ride over the worst market potholes in a Rolls Royce portfolio.
ZEUS is:
- 33% ETFs
- 33% hedging assets
- 33% individual stocks
You can build a ZEUS portfolio for any need or style.
- ZEUS value
- ZEUS growth
- ZEUS income growth
- ZEUS total return
- ZEUS low volatility
- ZEUS ultra-low volatility (as low as 8% declines in the Great Recession)
- ZEUS dividend aristocrat
- ZEUS high-yield aristocrat
- ZEUS REIT
- ZEUS monthly income
- ZEUS foreign stocks
- ZEUS ESG
ZEUS offers infinite diversity in infinite combinations, all with great yield, great returns, and volatility so low you’ll laugh at future bear markets.
According to Nick Maggiulli, Chief Data Scientist for Ritholtz Wealth management, this is the long-term historically optimized asset allocation.
Here’s the proof.
ZEUS High-Yield Aristocrat Vs. 60/40
| Metric | 60/40 | ZEUS High-Yield Aristocrat | X Better Than 60/40 |
| Yield | 2.1% | 5.1% | 2.43 |
| Growth Consensus | 5.1% | 4.9% | 0.96 |
| LT Consensus Total Return Potential | 7.2% | 10.0% | 1.39 |
| Risk-Adjusted Expected Return | 5.0% | 7.0% | 1.39 |
| Safe Withdrawal Rate (Risk And Inflation-Adjusted Expected Returns) | 2.8% | 4.7% | 1.71 |
| Conservative Time To Double (Years) | 26.0 | 15.2 | 1.71 |
(Source: DK Research Terminal, FactSet)
ZEUS high-yield aristocrat offers almost 2.5X the yield of a 60/40, 40% higher long-term return potential, and can conservatively be expected to double your inflation-adjusted wealth almost twice as fast as a 60/40.
ZEUS High-Yield Aristocrat Vs. 60/40
| Metric | S&P | ZEUS High-Yield Aristocrat | X Better Than S&P 500 |
| Yield | 1.7% | 5.1% | 3.00 |
| Growth Consensus | 8.5% | 4.9% | 0.58 |
| LT Consensus Total Return Potential | 10.2% | 10.0% | 0.98 |
| Risk-Adjusted Expected Return | 7.1% | 7.0% | 0.98 |
| Safe Withdrawal Rate (Risk And Inflation-Adjusted Expected Returns) | 4.9% | 4.7% | 0.97 |
| Conservative Time To Double (Years) | 14.8 | 15.2 | 0.97 |
(Source: DK Research Terminal, FactSet)
It is a great choice for young investors looking for an alternative to the S&P 500.
- 3X the safe yield
- similar returns
- peak declines 50% smaller during even the most catastrophic market crashes
Inflation-Adjusted Consensus Return Potential: $510,000 Average Retired Couple Savings At Age 65
| Time Frame (Years) | 4.8% CAGR Inflation-Adjusted 60/40 | 7.6% Inflation-Adjusted ZEUS High-Yield Aristocrat | Difference Between ZEUS High-Yield Aristocrat Consensus and 60/40 Consensus |
| 5 | $644,728.09 | $735,582.74 | $90,854.66 |
| 10 | $815,047.66 | $1,060,945.05 | $245,897.39 |
| 15 | $1,030,361.01 | $1,530,221.31 | $499,860.30 |
| 20 | $1,302,554.28 | $2,207,067.43 | $904,513.16 |
| 25 | $1,646,653.58 | $3,183,295.53 | $1,536,641.95 |
| 30 (retirement time frame) | $2,081,654.53 | $4,591,327.96 | $2,509,673.44 |
| 35 | $2,631,570.86 | $6,622,160.05 | $3,990,589.19 |
| 40 | $3,326,760.08 | $9,551,267.96 | $6,224,507.88 |
| 45 | $4,205,599.33 | $13,775,976.27 | $9,570,376.93 |
| 50 | $5,316,603.94 | $19,869,353.78 | $14,552,749.85 |
| 55 | $6,721,105.64 | $28,657,948.59 | $21,936,842.95 |
| 60 (investing lifetime) | $8,496,638.38 | $41,333,906.80 | $32,837,268.42 |
| 100 (endowment, charitable trust time frame) | $55,424,073.36 | $774,100,430.78 | $718,676,357.41 |
(Source: DK Research Terminal, FactSet)
This ZEUS portfolio potentially offers the average retired couple an extra $2.5 million in inflation-adjusted wealth over 30 years.
| Time Frame (Years) |
Ratio ZEUS High-Yield Aristocrat Portfolio Vs. 60/40 Consensus |
| 5 | 1.1 |
| 10 | 1.3 |
| 15 | 1.5 |
| 20 | 1.7 |
| 25 | 1.9 |
| 30 | 2.2 |
| 35 | 2.5 |
| 40 | 2.9 |
| 45 | 3.3 |
| 50 | 3.7 |
| 55 | 4.3 |
| 60 | 4.9 |
| 100 | 13.97 |
(Source: DK Research Terminal, FactSet)
That’s 2.2X more than the 60/40; over longer time frames, it delivers even better superior returns.
Historical Returns Since December 2007 (The Start of The Great Recession)
(Source: Portfolio Visualizer Premium)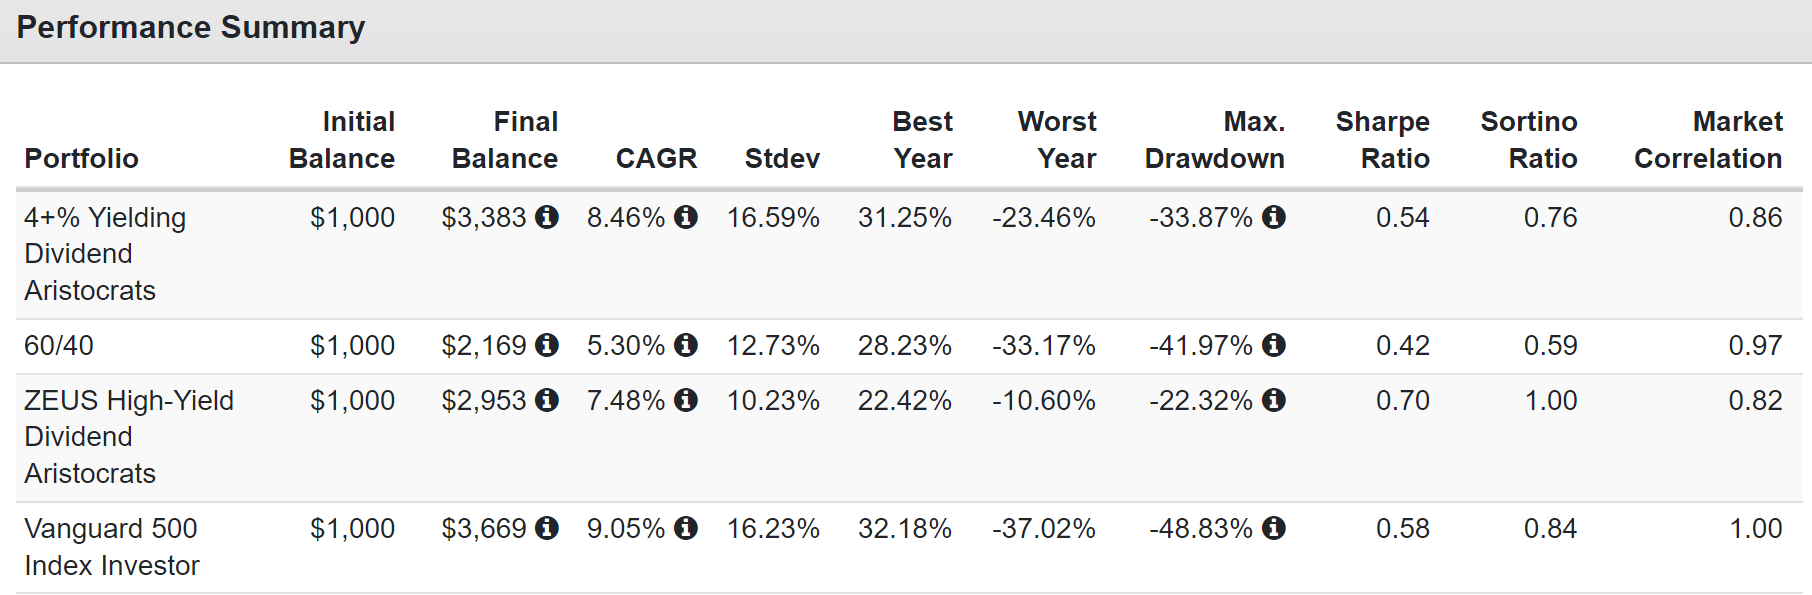
Superior returns to the 60/40 by 2% per year, with just 10% annual volatility, 40% less than the S&P, and a peak decline of 22%, just 50% of the 60/40’s.
- Peak-intraday decline for the 60/40 was -44% and -58% for the S&P 500
The Sortino ratio is negative-volatility-adjusted returns, and ZEUS was almost 2X better than the S&P 500 over the last 15 years.
(Source: Portfolio Visualizer Premium)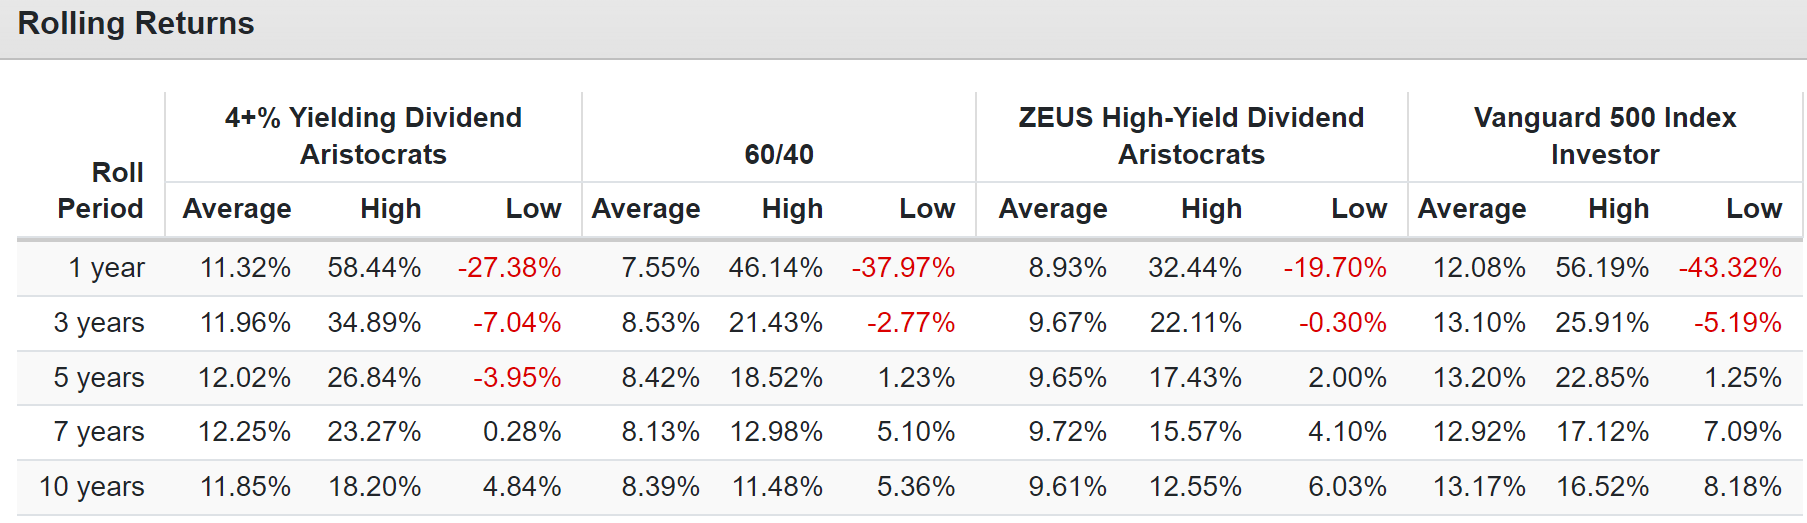
As analysts expect, long-term rolling returns of about 10% in the future.
(Source: Portfolio Visualizer Premium)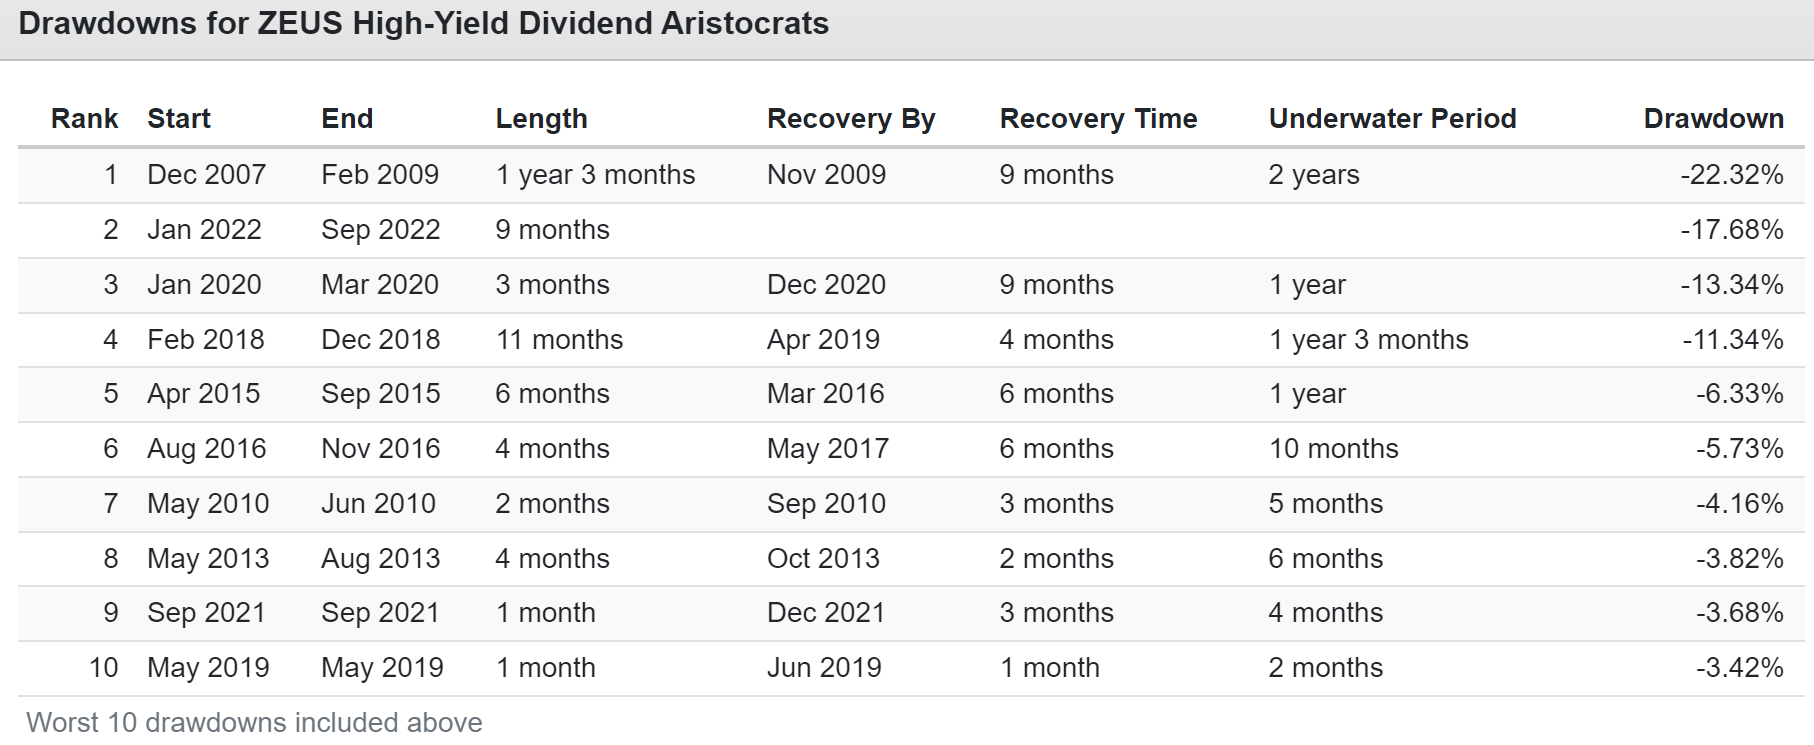
Remember that these aristocrats were chosen because they are the highest-yielding and most undervalued aristocrats on Wall Street. Many have fallen off a cliff this year, yet ZEUS was down a peak decline of 18%.
- Nasdaq: -35%
- S&P -28%
- 60/40 -21%
- ZEUS High-Yield Aristocrat -18%
ZEUS High-Yield Aristocrat During The Great Recession
(Source: Portfolio Visualizer Premium)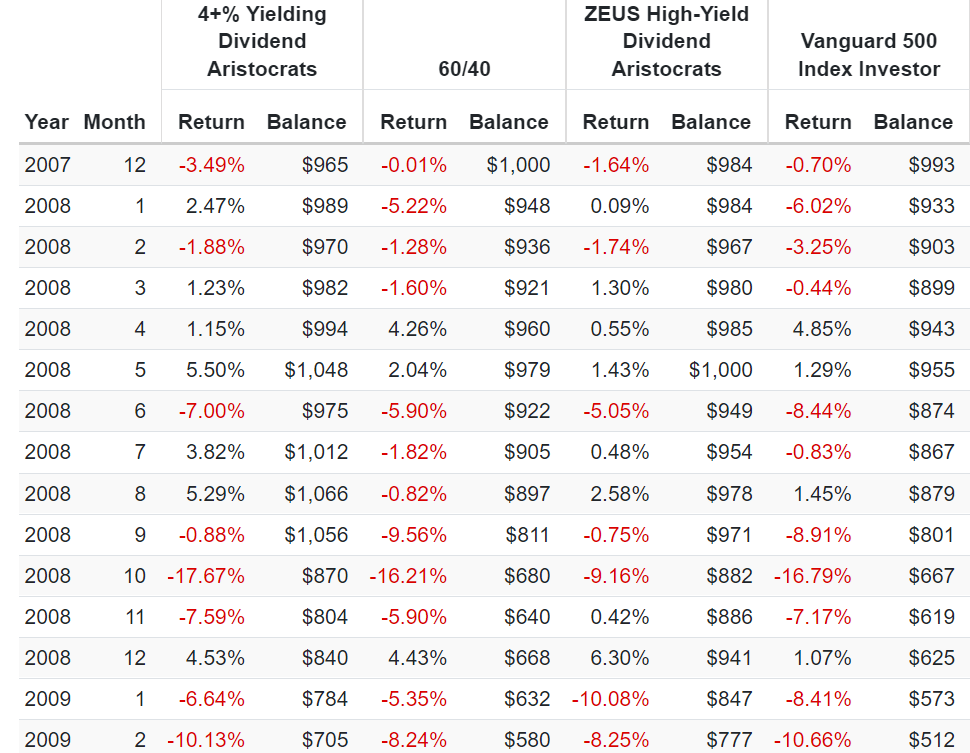
During the Great Recession, the S&P hit a peak decline of -58% and a 60/40 -44%, while ZEUS fell just 22%, including falling just 9% when the market fell 17% in October, and a 60/40 fell 16%.
ZEUS High-Yield Aristocrat During The 2011 Bear Market
(Source: Portfolio Visualizer Premium)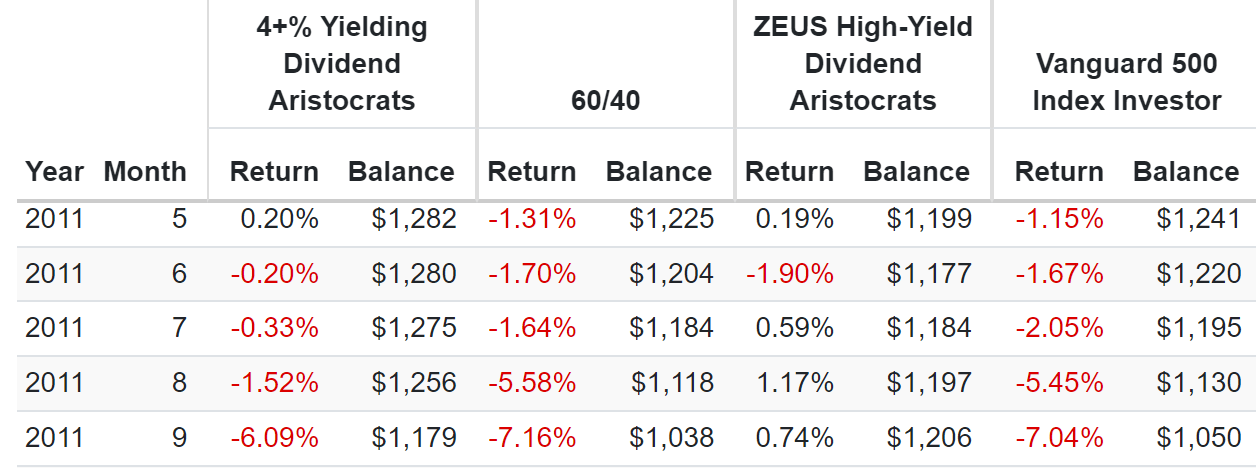
During the 2011 bear market, the S&P hit a peak decline of -22% and a 60/40 -16%, and ZEUS went up 1%. That includes rising 0.7% in September when the market and 60/40 fell 7%.
Like riding over a major market pothole in a hovercraft.
ZEUS High-Yield Aristocrat During The 2018 Bear Market
(Source: Portfolio Visualizer Premium)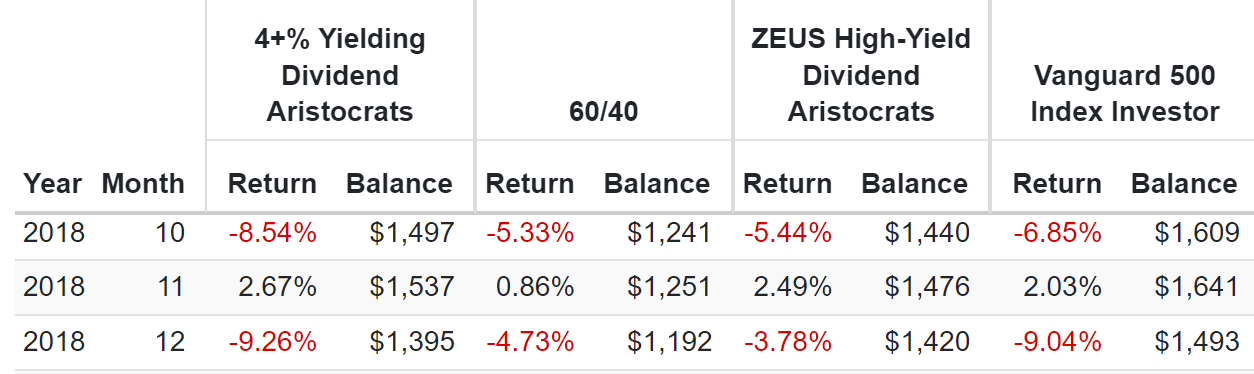
During the 2018 bear market, the S&P hit a peak decline of -21% and a 60/40 -9%, and ZEUS fell 9%. That includes falling less than 4% in December when the market fell 9%.
ZEUS High-Yield Aristocrat During The Pandemic Crash
(Source: Portfolio Visualizer Premium)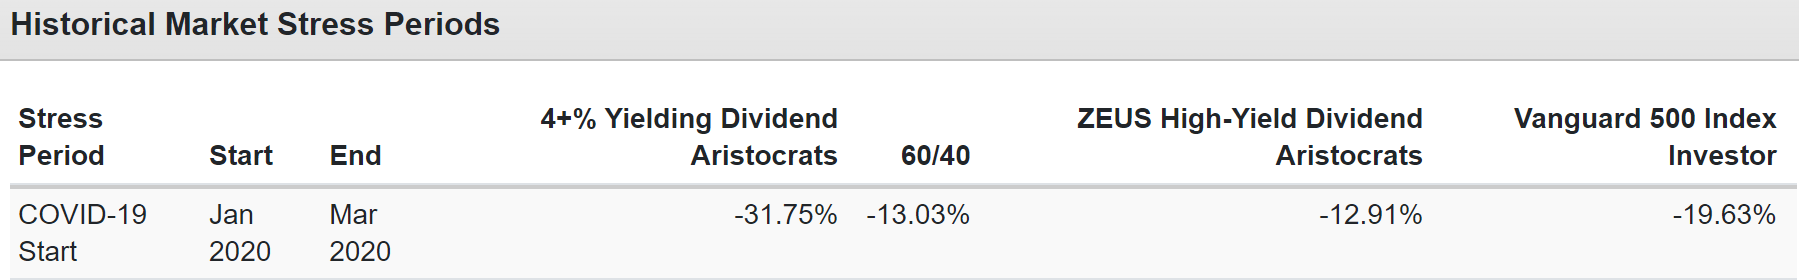
During the Pandemic crash, the S&P hit a peak decline of -34% and a 60/40 -13%, and ZEUS fell 13%. That’s compared to the aristocrats themselves, which fell 32%.
ZEUS High-Yield Aristocrat During The 2022 Bear Market
(Source: Portfolio Visualizer Premium)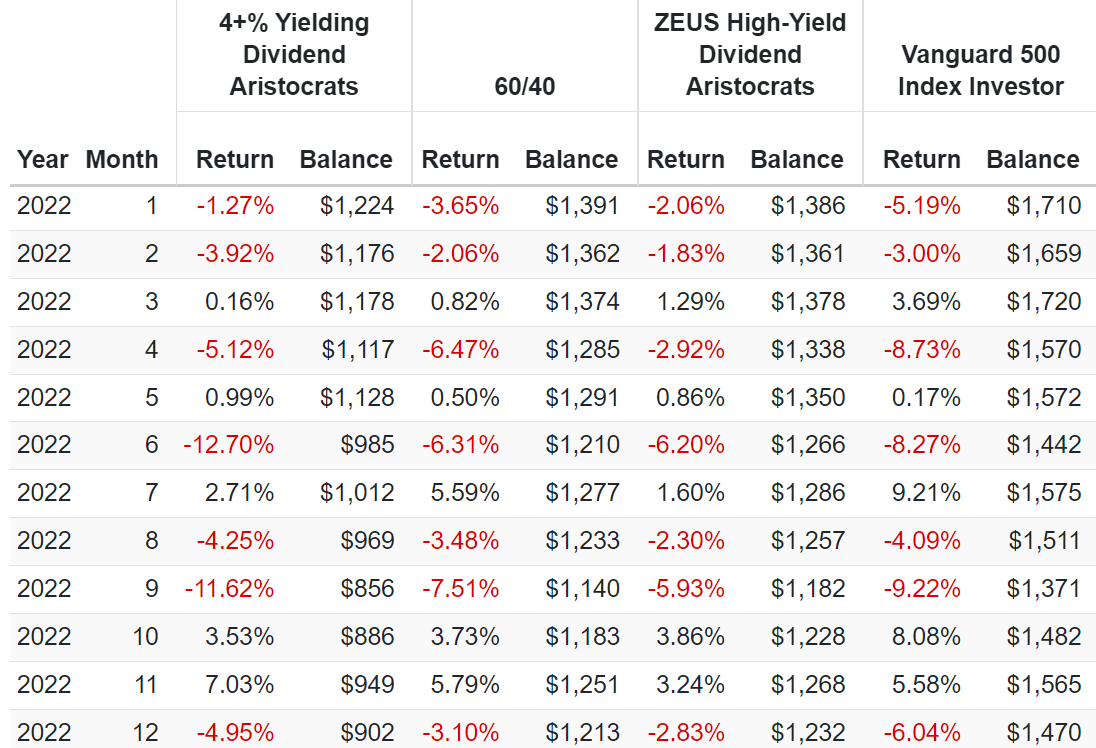
During the 2022 bear market, the S&P hit a peak decline of -28% and a 60/40 -21%, and ZEUS a peak of 17%. That includes falling 3% when the market fell 9% in April and falling 3% when the market is down 6% in December.
ZEUS Vs. 60/40 vs. S&P 500 Bear Market Summary
| Bear Market | ZEUS High-Yield Aristocrat | 60/40 | S&P |
| 2022 Stagflation | -17% | -21% | -28% |
| Pandemic Crash | -13% | -13% | -34% |
| 2018 | -9% | -9% | -21% |
| 2011 | 1% | -16% | -22% |
| Great Recession | -22% | -44% | -58% |
| Average | -12% | -21% | -33% |
| Average Decline vs. Benchmark | NA | 58% | 37% |
(Source: Portfolio Visualizer Premium)
ZEUS High-Yield Aristocrat averaged a 12% peak decline during every bear market of the last 15 years, 42% less than a 60/40 and 63% less than the S&P 500.
Stress Testing The Future
Every registered investment advisor, including Ritholtz Wealth Management, uses some version of Monte Carlo simulations when doing retirement planning.” – Ben Carlson
Monte Carlo Simulations are how economists also forecast their base-case economic and market forecasts.
- Long-term Monte Carlo simulation use statistics and past historical returns and volatility data to run thousands of simulations about what’s likely to happen in the future
- as long as the future isn’t more extreme than the last 15 years, this is the best way to estimate the probability of likely return ranges, volatility, and the probability of achieving your investment goals.
The last 15 years have seen:
- the two worst recessions since the Great Depression
- the 2nd worst market crash in history
- the fastest bear market in history
- the strongest 12-month rally-month history (70%)
- inflation ranging from -3% to 9%
- 10-year treasury bond yields ranging from 0.5% to 6%
- Fed funds rate from 0% to 4.25%
Unless you think the future will be more extreme than this, a 10,000 75-year Monte Carlo simulation is statistically the best way to forecast the likely future.
- a 75-year time horizon provides more extreme ranges of potential outcomes
- the ultimate stress test for a “forever portfolio.”
(Source: Portfolio Visualizer Premium)
If we define success as beating a 60/40’s consensus 7.2% over the next 50 years, then the probability of success with this portfolio is over 87%.
Bear Market Probabilities
| Bear Market Severity | Statistical Probability Over 75 Years | 1 In X Probability | Expected Every X Years |
S&P More Likely To Suffer X% Decline In Any Given Year |
| 20+% | 3.13% | 32 | 2,396 | 399 |
| 25+% | 1.17% | 85 | 6,410 | |
| 30+% | 0.24% | 417 | 31,250 | |
| 35+% | 0.06% | 1667 | 125,000 | |
| 40+% | 0.00% | Never | Never | Infinity |
(Source: Portfolio Visualizer Premium)
This portfolio is 400X less likely than the S&P 500 to suffer a bear market in any given year and infinitely less likely to crash 40+% in any given year. In fact, there is a statistically zero chance that it will fall 40+% in the next 75 years.
What do you call a 5% yielding portfolio that yields almost 2.5X more than a 60/40 that delivers S&P-like returns but with 63% smaller declines in even the most extreme market crashes?
A truly Zen Extraordinary Ultra SWAN high-yield aristocrat retirement portfolio.
Bottom Line: These Are The Best High-Yield Dividend Aristocrats For 2023 And Beyond
Let me be clear: I’m NOT calling the bottom in any of these aristocrats (I’m not a market-timer).
Super SWAN quality does NOT mean “can’t fall hard and fast in a bear market.”
Fundamentals are all that determine safety and quality, and my recommendations.
But if you’re worried about bear markets? Well, then, a ZEUS high-yield aristocrat portfolio might be just what you need ahead of a potentially painful start to 2023.
ZEUS Vs. 60/40 vs. S&P 500 Bear Market Summary
| Bear Market | ZEUS High-Yield Aristocrat | 60/40 | S&P |
| 2022 Stagflation | -17% | -21% | -28% |
| Pandemic Crash | -13% | -13% | -34% |
| 2018 | -9% | -9% | -21% |
| 2011 | 1% | -16% | -22% |
| Great Recession | -22% | -44% | -58% |
| Average | -12% | -21% | -33% |
| Average Decline vs. Benchmark | NA | 58% | 37% |
(Source: Portfolio Visualizer Premium)
ZEUS High-Yield Aristocrat averaged a 12% peak decline during every bear market of the last 15 years, 42% less than a 60/40 and 63% less than the S&P 500.
It’s 400X less likely than the S&P to suffer a bear market in any given year. All while delivering 3X the safe yield, long-term market-like returns, and 40% lower annual volatility.
If the market falls 20% in the first half of 2023, this portfolio could be expected to fall about 7% to 8%. If it falls 10%, ZEUS high-yield aristocrat is expected to fall about 3% to 4%.
That’s thanks to its incredible allocation to the world’s best high-yield blue-chip assets, including the best 4+% yielding aristocrats for 2023: MO, VFC, ENB, LEG, FLIC, FMS, SWK, FRT, and ESS.
- 5.5% very safe yield
- 42-year average dividend growth streak (since 1980, through seven recessions and eight bear markets
- BBB+ stable credit rating
- 6.9% long-term growth
- 12.3% long-term return potential (vs. 12.8% average annual returns for the last 26 years)
You need to be invested in stocks for the long-term if you want to retire rich and stay rich in retirement.
And there are no more dependable 4+% yielding dividend growth stocks than these Super SWAN aristocrats that you can buy right now.
And within a ZEUS portfolio, you truly can sleep well at night in 2023 and enjoy your holiday with your family. Because your hard-earned money is working hard for you so that one day you won’t have to.
From everyone at Dividend Kings and iREIT, I want to wish you and yours a safe, healthy, and joyous new year 🙂
Be the first to comment