

chapin31
Outside of the major restaurant chains that line every major street in the country and many streets across the globe, there exists a number of sizable chains that have the potential to generate attractive returns as they continue to grow and generate cash flows. One great example of this can be seen by looking at the Texas-themed restaurant giant Texas Roadhouse (NASDAQ:TXRH). With an emphasis on steak and other southern-style foods, the company has done well to carve out a nice niche for itself in recent years. Thanks to attractive growth in both its top and bottom lines, including recently during times of economic uncertainty, the company’s shares have also performed remarkably well. Long term, I fully suspect that the company will continue to perform nicely. But when we factor in where shares are priced today, I do think investors should be a bit more cautious moving forward. Because of this, I have decided to reduce my rating on the company from a ‘buy’ to a ‘hold’ to reflect my view that, instead of outperforming the broader market moving forward, shares should generate returns that would more or less match the broader market instead.
That was tasty
Back in October of 2021, I wrote an article that took a bullish stance on Texas Roadhouse. In addition to being a fan of the company’s food and aura, I found myself impressed with the financial performance of the business. Even though it experienced a difficult 2020 fiscal year because of the COVID-19 pandemic, the company was showing signs of recovery. On top of that, the stock also looked attractively priced. That led me to rate the company a ‘buy’. Since then, the firm has performed as I would have anticipated. While the S&P 500 is down 10.2%, shares of Texas Roadhouse have generated upside for investors of 13.2% inclusive of dividends.
Author – SEC EDGAR Data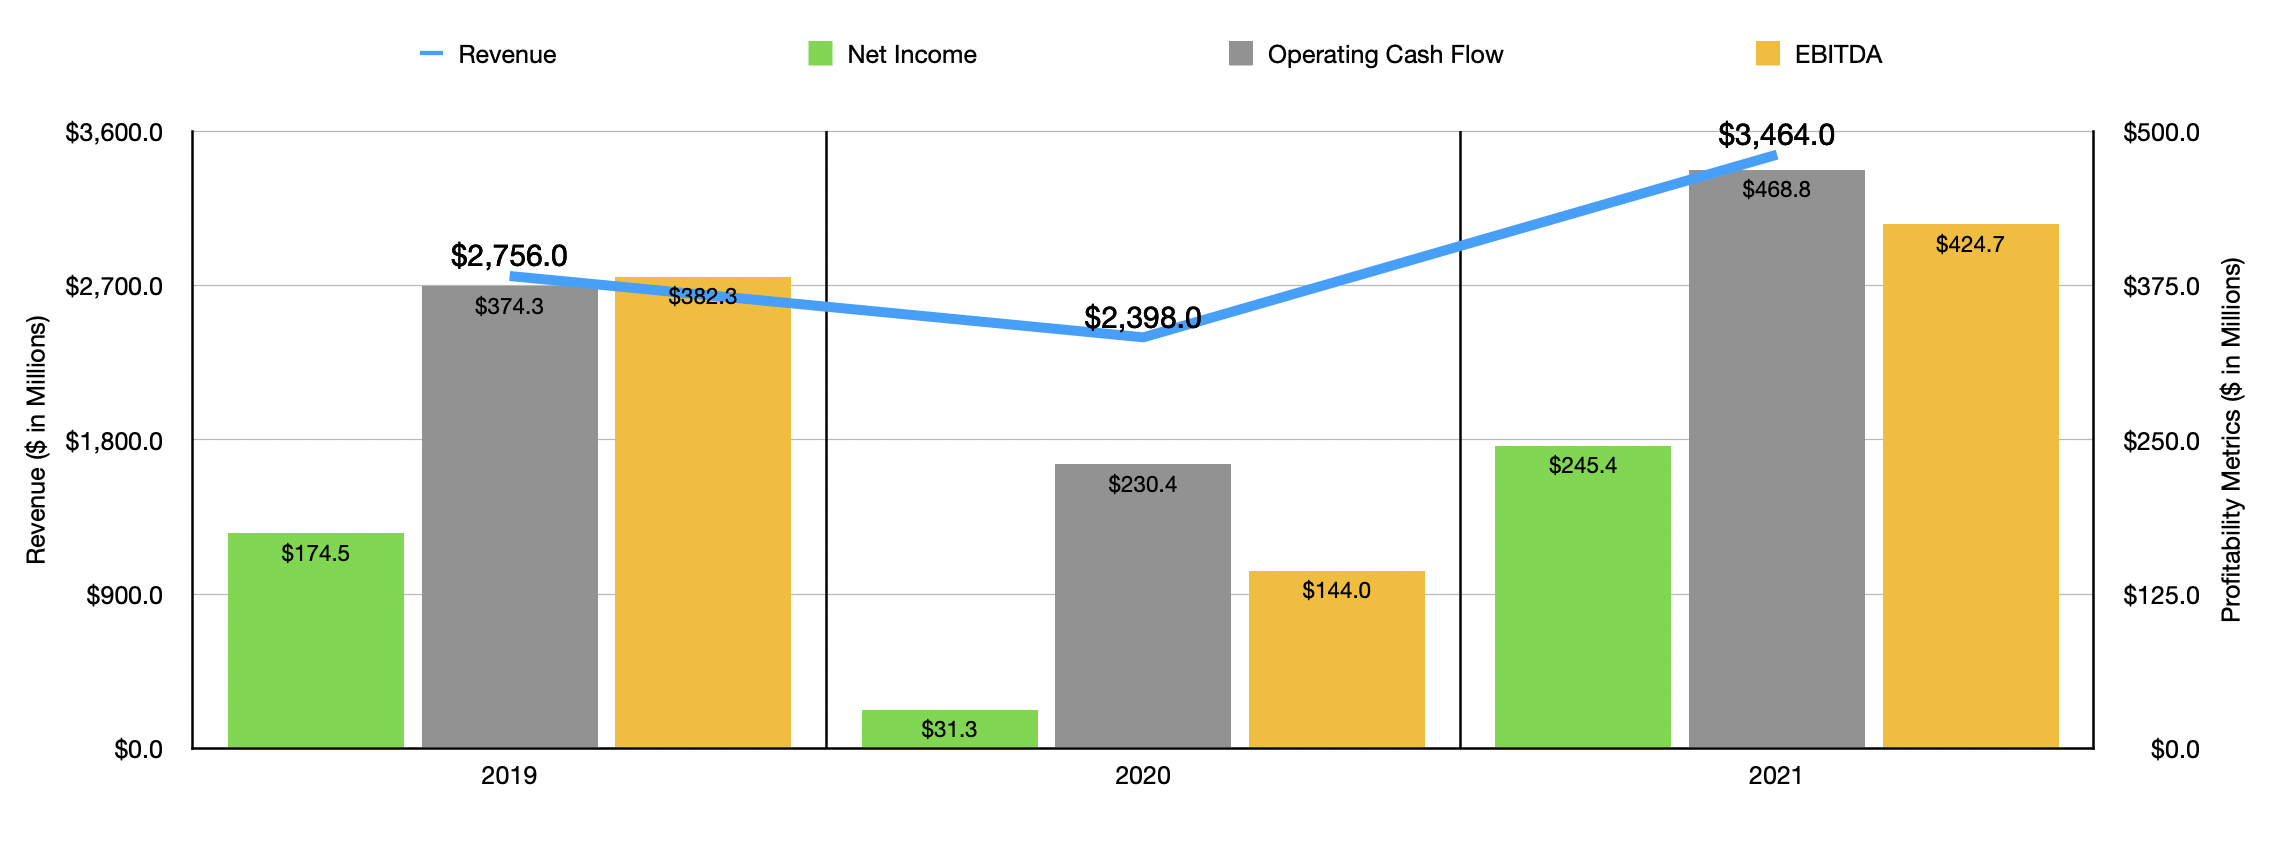
This return disparity has not been without cause. To see what I mean, we should first touch on how the company finished its 2021 fiscal year. During that year, sales came in at $3.46 billion. That’s 44.5% higher than the $2.40 billion generated in 2020 and it represents an increase of 25.7% over the pre-pandemic year of 2019 when the company generated sales of $2.76 billion. The company’s growth came largely as a result of two key factors. First and foremost, comparable store sales were rather robust. After a down year in 2020, comparable store sales jumped 37.8%. Meanwhile, the number of locations the company had in operation jumped to 667. That compares to the 634 the company had in 2020 and the 611 it had in 2019. In addition to growing organically, the company has engaged in acquisition activities. This includes of its own previously-franchised locations.
With this rise in revenue also came improved profits. Net income went from $31.3 million in 2020 to $245.4 million in 2021. Even in 2020, profits were nowhere near that high, totaling $174.5 million that year. Operating cash flow also improved, climbing from $230.4 million in 2020 to $468.8 million last year. Over that same window of time, we also saw EBITDA improve, climbing from $144 million to $424.7 million. By every measure on the profit side, the 2021 fiscal year was the single-greatest in the company’s history.
Author – SEC EDGAR Data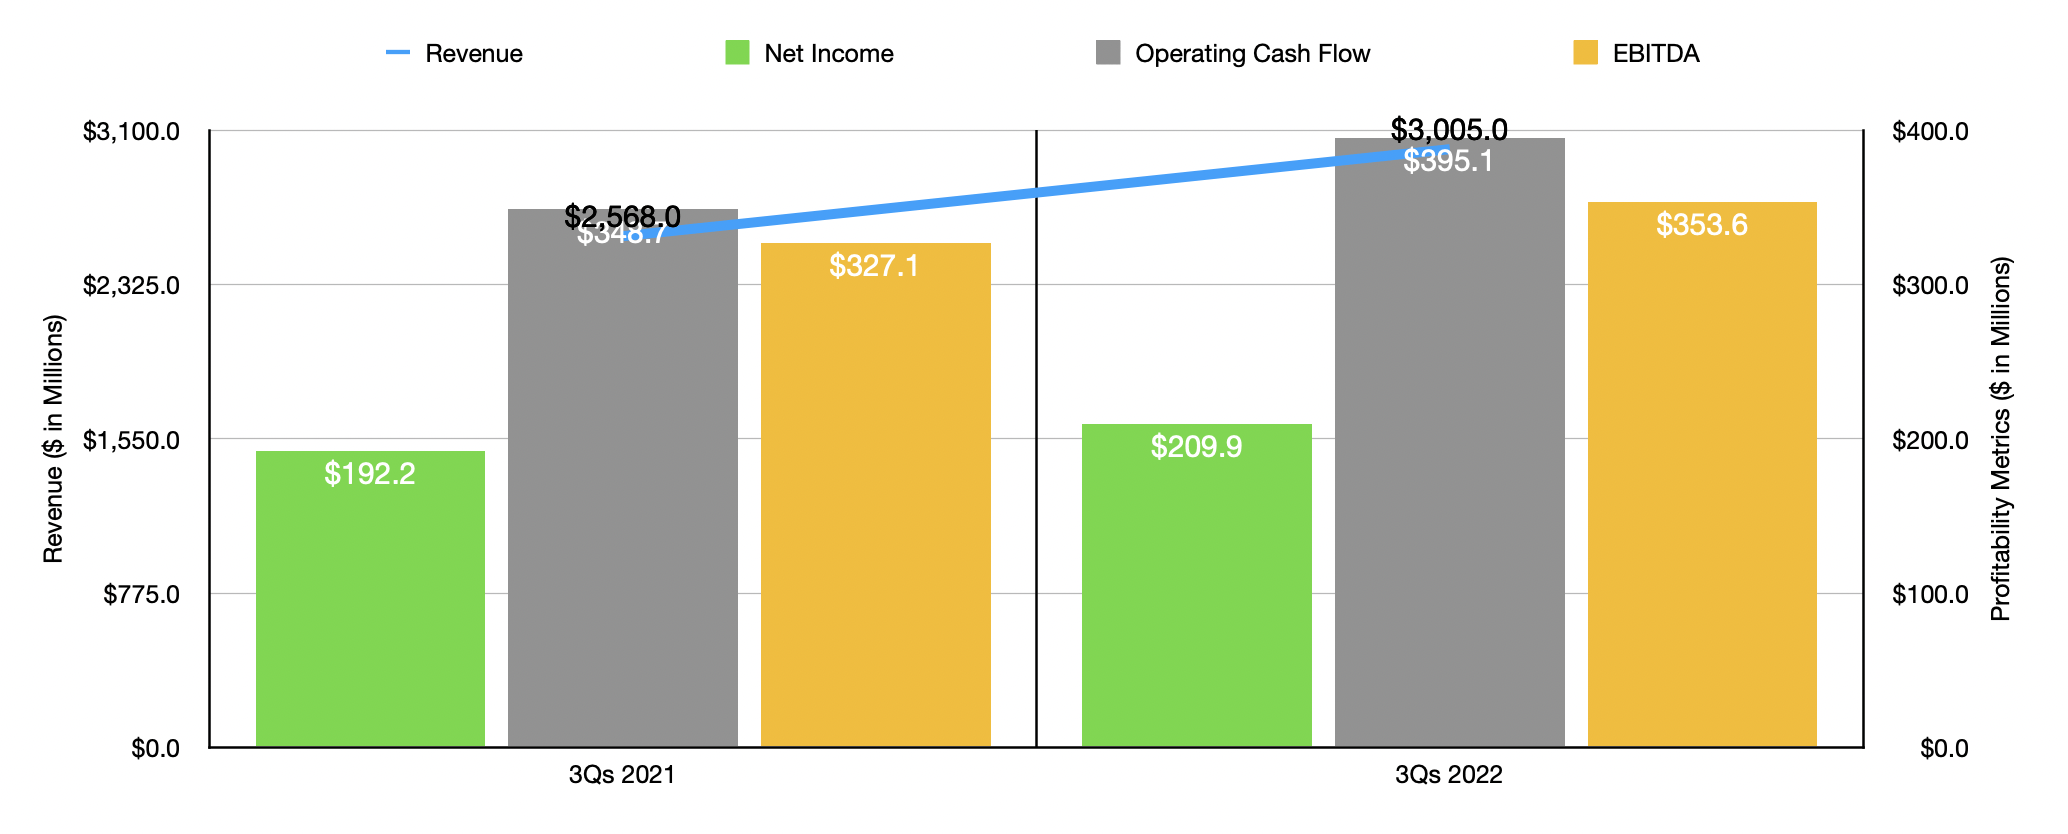
Even though management has done incredibly well in recent years, they have no intention to rest on their laurels. In the first nine months of the company’s 2022 fiscal year, sales came in strong, hitting $3.01 billion. That’s 17% above the $2.57 billion generated the same time last year. This increase was driven by two factors. For starters, the number of locations in operation hit 685. That compares to the 654 in operation only one year earlier. This came even as the number of franchised locations dropped from 99 to 98. And the second involved a 10.5% improvement in comparable store sales. This was driven by both higher traffic and higher spending at its locations. During this window of time, traffic grew by 2.2% at comparable locations, while the average check size jumped by 8.3%.
Naturally, this rise in revenue brought with it improved profits yet again. Although the company was faced with inflationary pressures affecting pretty much everybody everywhere, it still managed to see its net income grow from $192.2 million to $209.9 million. Operating cash flow during this window of time jumped from $348.7 million to $395.1 million. And over that same window of time, EBITDA grew from $327.1 million to $353.6 million.
When it comes to the 2022 fiscal year in its entirety, we don’t really know what to expect. Management has said that in the first four weeks of the final quarter they saw comparable sales grow by 8.3%, driven in part by a 2.9% price increase that was initiated in late October. In terms of actual store count, the company hopes to increase its footprint by a total of 23 locations this year. And in 2023, the company is anticipating 30 additional restaurant openings and positive comparable sales growth. But beyond that, anything that we put down here is pure speculation. When it comes to the current fiscal year on its own, simply annualizing the results experienced so far would give us net income of $268 million, adjusted operating cash flow of $531.2 million, and EBITDA of $459.1 million.
Author – SEC EDGAR Data
Based on these figures, the company is trading at a forward price-to-earnings multiple of 24.8. The forward price to operating cash flow multiple would be 12.5, while the EV to EBITDA multiple would come in at 14.3. To put this in context, the results using data from the 2021 fiscal year would be 27.1, 14.2, and 15.4, respectively. And when I last wrote about the company, those same numbers for the 2021 fiscal year came in at 24.6, 10.6, and 11.6, respectively. So as you can see, shares of the company have gotten a bit pricier from a valuation perspective. But they have also gotten more expensive relative to similar firms. As you can see in the table below, I priced the company against five similar firms using the three valuation approaches already mentioned. And in each of those cases, Texas Roadhouse was the most expensive of the group.
| Company | Price / Earnings | Price / Operating Cash Flow | EV / EBITDA |
| Texas Roadhouse | 24.8 | 12.5 | 14.3 |
| Dine Brands Global (DIN) | 13.6 | 10.2 | 9.6 |
| Darden Restaurants (DRI) | 20.2 | 12.3 | 12.2 |
| Cracker Barrel Old Country Store (CBRL) | 17.7 | 11.5 | 10.8 |
| Red Robin Gourmet Burgers (RRGB) | N/A | 2.8 | 6.5 |
| Bloomin’ Brands (BLMN) | 22.7 | 5.3 | 7.4 |
Takeaway
By all accounts, Texas Roadhouse has had a great run over the past year or so. This is what happens when you buy a quality company that continues to grow and you do so at a price that is cheap on an absolute basis. But all good things must come to an end. Don’t get me wrong. I have no doubt that the company will continue to fare well over the long haul. The brand is doing incredibly well and I just fully suspect that growth will continue over an extended timeframe. But I do think that shares have risen enough to make the company more or less fairly valued at this point. So because of that, I have decided to change my rating on the firm from a ‘buy’ to a ‘hold’.
Be the first to comment