

Media Whalestock/iStock via Getty Images
Introduction
There’s one common theme in the steel sector: make hay while the sun shines as the sentiment may change very fast. That’s what we are experiencing right now because after the record profits generated by steel producers in Q1 and Q2 of this year, investors will have to brace for much lower results in Q3 (and likely, Q4) as the steel price has dropped. Most steel companies played it smart and used the cash windfall to shore up their balance sheets. Ternium (NYSE:TX), a South America focused steel producer, generated about 25% of its current market cap in earnings in the first half of the year, thereby greatly reducing its balance sheet risk, but the company is also preparing for a decline in its earnings.
An exceptionally strong earnings performance by Ternium
As the steel price and production were relatively stable in Q1 and Q2 with an output of approximately 2.95 million tonnes of steel per quarter and an average sales price of just over $1400/t and $1471/t in Q1 and Q2, respectively, it makes sense to look at the company’s H1 performance as a whole.
The total revenue in the first semester of this year was almost $8.8B, an increase of almost 25% compared to the first semester of last year. Unfortunately, the COGS increased by about a third which meant the gross profit increased by just over 3% which is perhaps slightly disappointing. On top of that, the SG&A expenses increased by almost a third as well resulting in a decrease in the operating income by approximately 2%.
Ternium Investor Relations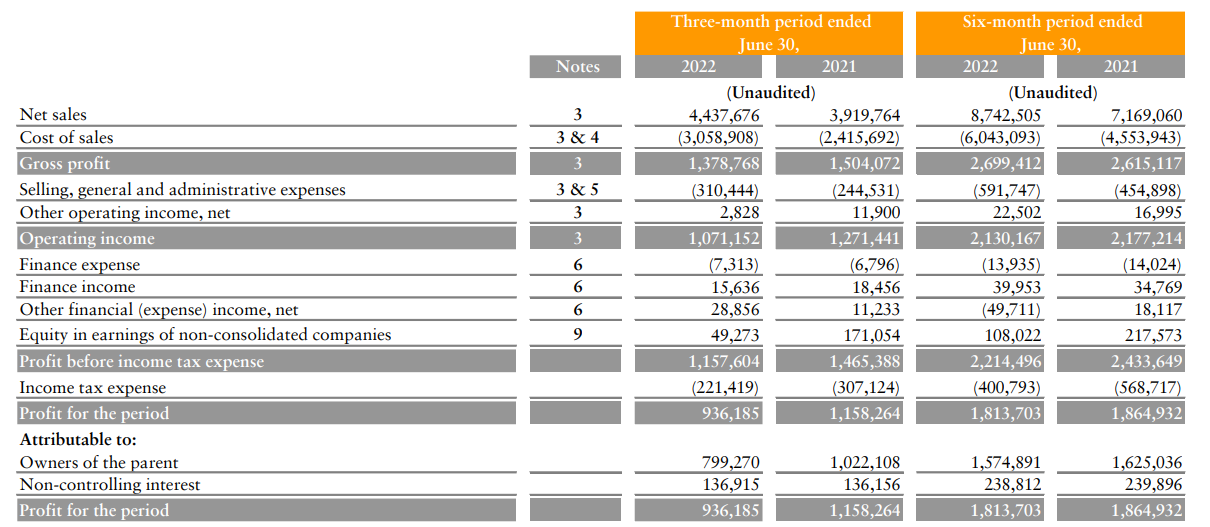
That’s still fine as Ternium obviously reports in US Dollar but incurs expenses and other items in the currency of the countries it is active in. So there is bound to be some fluctuation in the results. And with a pre-tax income of $2.2B and a net income of $1.81B, can we really be disappointed? Keep in mind a portion of the total net income is attributable to non-controlling interests and the net income attributable to the Ternium shareholders was $1.57B for an EPS of $0.80. Each ADS consists of 10 underlying shares, which means the EPS per ADS was $8 in the first semester. Slightly below the $8.3 in H1 2021, but obviously, this is still very decent.
That’s great, but we shouldn’t even think about the H2 results coming even remotely close to the H1 EPS and free cash flow (which I will discuss later in this article). Ternium is pointing to the rapidly changing circumstances and is expecting a tough combination of lower steel prices and higher operating expenses in the third quarter. This basically means the EBITDA and EBITDA margins will start to contract due to this ‘double whammy’. Unfortunately, Ternium hasn’t provided more details other than it is expecting ‘an EBITDA decrease’ due to these lower margins.
The free cash flow was mainly used to settle historical tax liabilities
As my previous investment theses, not just in the past few quarters but for the past few years, were focusing on free cash flow results, it’s important to make sure Ternium is still performing as planned.
The reported operating cash flow was $687M. This includes a $350M investment in the working capital position and more importantly, a $1.085B tax payment although only $400M is due based on the H1 results. The majority of these payments are related to what the company owes based on historical earnings. The adjusted operating cash flow (this time also including the $25M in lease payments) was approximately $1.7B.
Ternium Investor Relations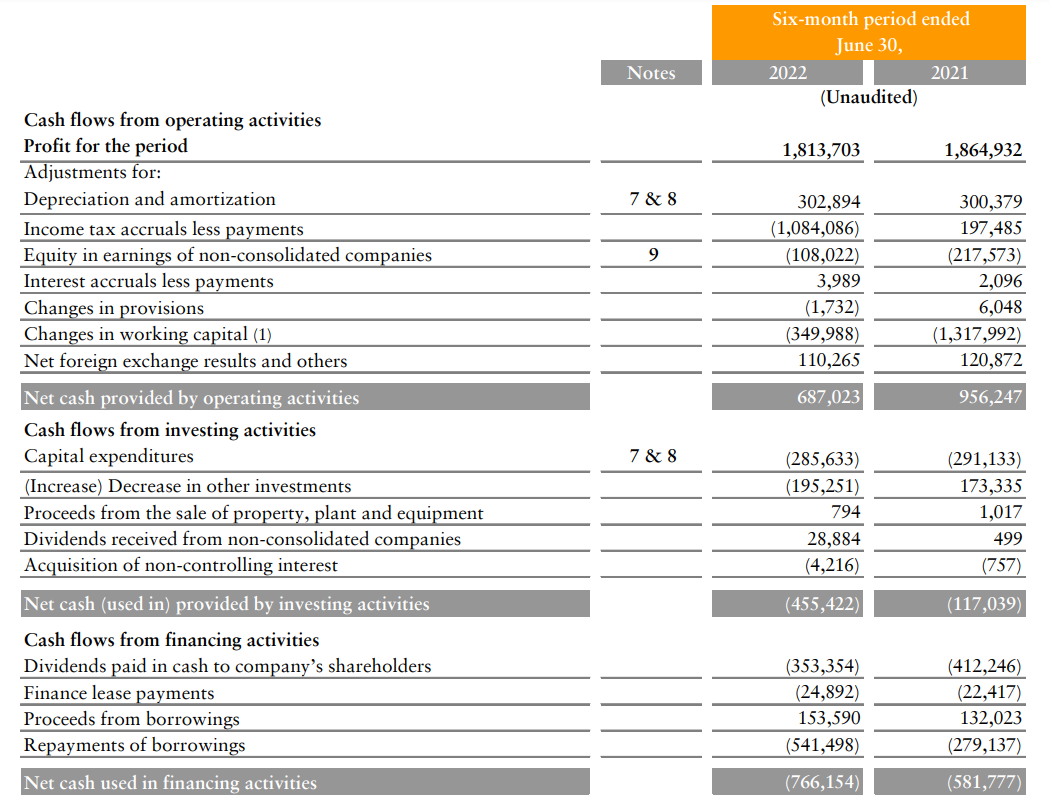
The total capex was $286M resulting in a net free cash flow of just over $1.4B and even if we would deduct the entire $239M attributable to minority interests, the adjusted free cash flow attributable to the Ternium shareholders in the first half of the year was approximately $1.15B.
Due to the payment of those historical tax liabilities, the net cash hasn’t changed much. As of the end of June, the company had about $2.05B in cash and ‘other investments’, offset by $1.1B in debt for a net cash position of approximately $950M. Of interest is the small increase in deferred tax assets (up $62M) and the rather sharp decrease in the non-current tax liabilities ($58M) and current tax liabilities (down $815M).
Ternium Investor Relations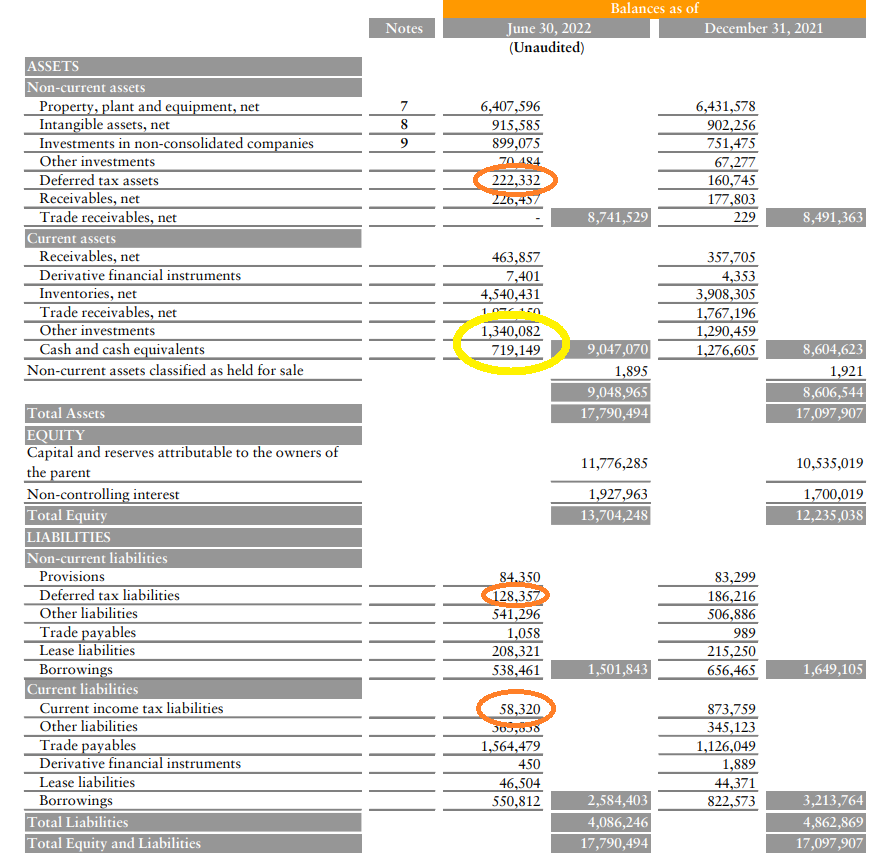
Considering there are just over 196M ADS outstanding, the $1.1B in net cash and investments represents just over $5.5/ADS, so about 1/6th of the current market cap is backed by cash and investments.
Investment thesis
It would have been more helpful if Ternium’s management would have been able to provide a more detailed EBITDA guidance. Considering the EBITDA guidance was just over $1.2B in both Q1 and Q2, how much of a decrease are we talking about? 20%? 50%? We know the US-based hot-rolled coil steel prices are just over $800, but it’s unfair to try to replicate that to the situation in Mexico and Argentina.
It is a little bit of a black box at this moment as the volatile situation in the steel market greatly reduces the earnings visibility. That makes Ternium (and steel producers in general) a bit more speculative in nature, but I like Ternium’s net cash + investments balance and the sharp reduction in the amount of taxes owed.
This means Ternium should be in a position to ‘ride out’ the storm. I will be looking to write some out-of-the-money put options on Ternium.
Be the first to comment