


xijian/iStock via Getty Images
Produced by Jason Appel of Stock Waves
This article will provide an update on the technical posture of NYSEARCA:TAN (Invesco Solar ETF). Action is heating up!
Please forgive the terrible pun.
Conditions are ripe for a sizable rally in solar stocks. Rising energy prices have been a persistent reality over the past two years. Crude oil, after going negative in the spring of 2020, has recovered all of its drop from the previous decade and recently exceeded the 2014 highs.
Also, geopolitical tensions surrounding energy have increased once again with Russia’s hostile invasion of Ukraine. The subsequent response from the West has increased energy prices. Additionally, with discussion of possible halts in Russian energy imports, prices could extend much further even near term.
Domestically, President Biden’s 2023 budget proposal contains $45 Billion in “new funding for climate change, clean energy and environmental justice programs.”
Lastly, the Build Back Better bill (which has yet to pass through Congress) includes billions in federal spending towards clean energy investment.
Considering rising energy prices, geopolitical issues with energy imports, and strong federal support, the conditions are very bullish for solar stocks.
Regarding the technical setup:
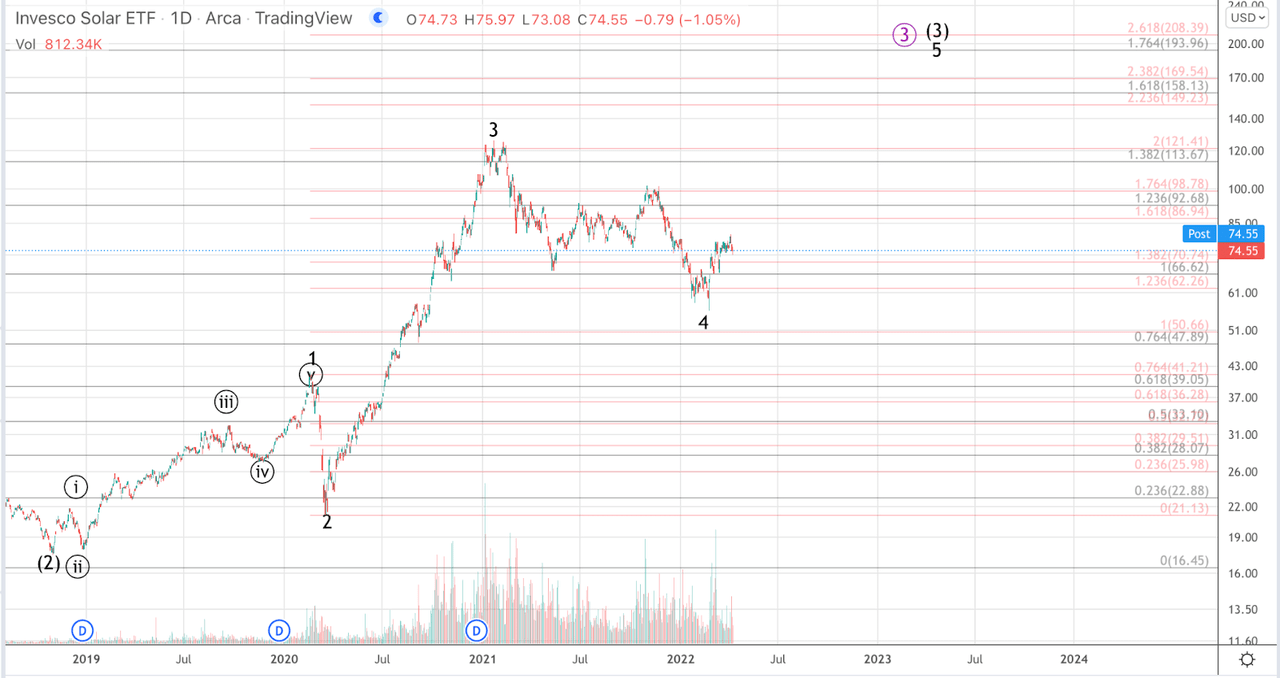
TAN has an impulsive Elliott Wave formation. By definition this is a trending 5 wave structure in which the motive subwaves – i.e., those that advance price in the direction of the prevailing trend (Waves 1, 3, 5 at the varying degrees), are themselves composed of 5 wave moves. Inside of impulses waves 1 and 4 do not overlap and wave 3 cannot be the shortest.
Thus far TAN has not only met the aforementioned basic definition of an impulse, but instead has more than fulfilled the typical proportions characteristic of an impulse. Wave 3s at all degrees are known to advance price in the strongest fashion. In particular wave 3 of (3) is typically the strongest and note the daily chart presented below the move from the 2020 low to the January high. This was essentially 9 months of vertical ascent without any meaningful pullbacks.
After such a rally in which price increased by nearly 500% TAN has spent the last year consolidating in the wave 4 of the larger wave (3) that began at the 2018 low. The pullback has done its job to shake off the frothy sentiment enabling weak hands to complete their selling. In a technical sense wave 4s should maintain above the 50% retrace of the wave 3 and so far TAN has done that forming a bottom at the February 2022 lows.
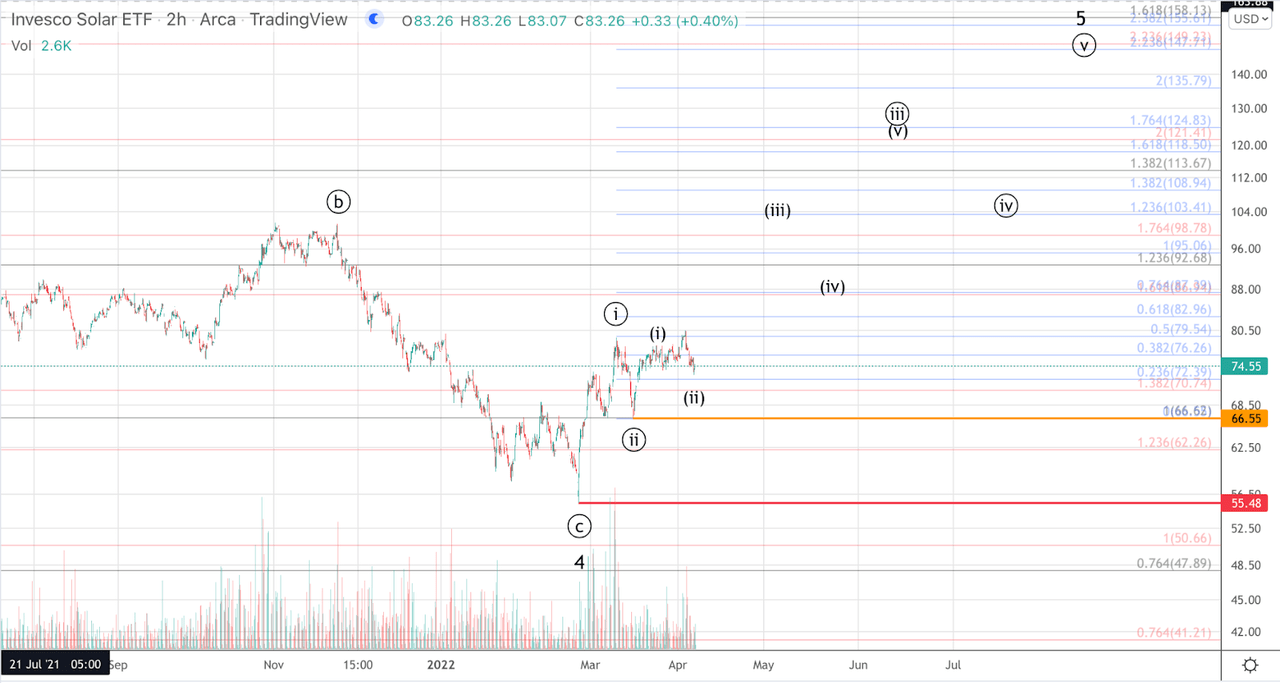
From the recent February 2022 lows, price has formed a micro impulse up into the March 9th high and held corrective support into the March 15th low. Since the March 15th low we can count another micro impulse.
This formation is called a i-ii, (i)-(II) setup and is visible in the accompanying two-hour chart. These are the strongest and most highly probable Elliott Wave setups. At the smaller degree, so long as price maintains above the March 15th low, $66.55, TAN is set up for a launch upwards in wave (III) which minimally targets the $95 to $103 region. Just that setup alone offers phenomenal risk to reward.
That said, on the larger degree, this setup has tremendously highly skewed risk to reward. This local i-ii, (i)-(II) represents the early stages or the base of the rally in wave 5 of (3). Based on the smaller degree action, $149 is expected but based on the larger degree Fibonacci extensions, I cannot rule price targeting the 1.764 level at $193.
Should price break the March 15 low, a bigger i-ii setup is still viable so long as the February low is holding. As such those playing with tighter stops may wish to cut prospective losses below the March 15th low. Even for those who intend to allow price to retrace down to the February lows, $55.48, before jettisoning positions, we see a very favorable opportunity here considering the risk to reward ratio and the overall technical setup.
*Please note, timing shown on charts is merely incidental and is not representative of analysts’ view regarding timing expectations.
TAN Daily Chart
Jason Appel (Stock Waves)
TAN 2h Chart
Jason Appel (Stock Waves)
Be the first to comment