

Richard Drury
The Consumer Is Still Spending
Since I reviewed Synchrony Financial (NYSE:SYF) last quarter, the stock has stabilized, up 6% compared to a slight loss for the S&P 500 (SPY). What I said then remains true: consumers are still spending. Purchase volume is up more than inflation in most of Synchrony’s segments and growth accelerated from last quarter in Digital, Health & Wellness, and Lifestyle. The company also grew the number of accounts on a core basis, almost offsetting the loss of 5.9 million accounts in the Gap (GPS) and BP (BP) programs that were sold earlier this year.
Synchrony Financial 3Q 2022 Earnings Slides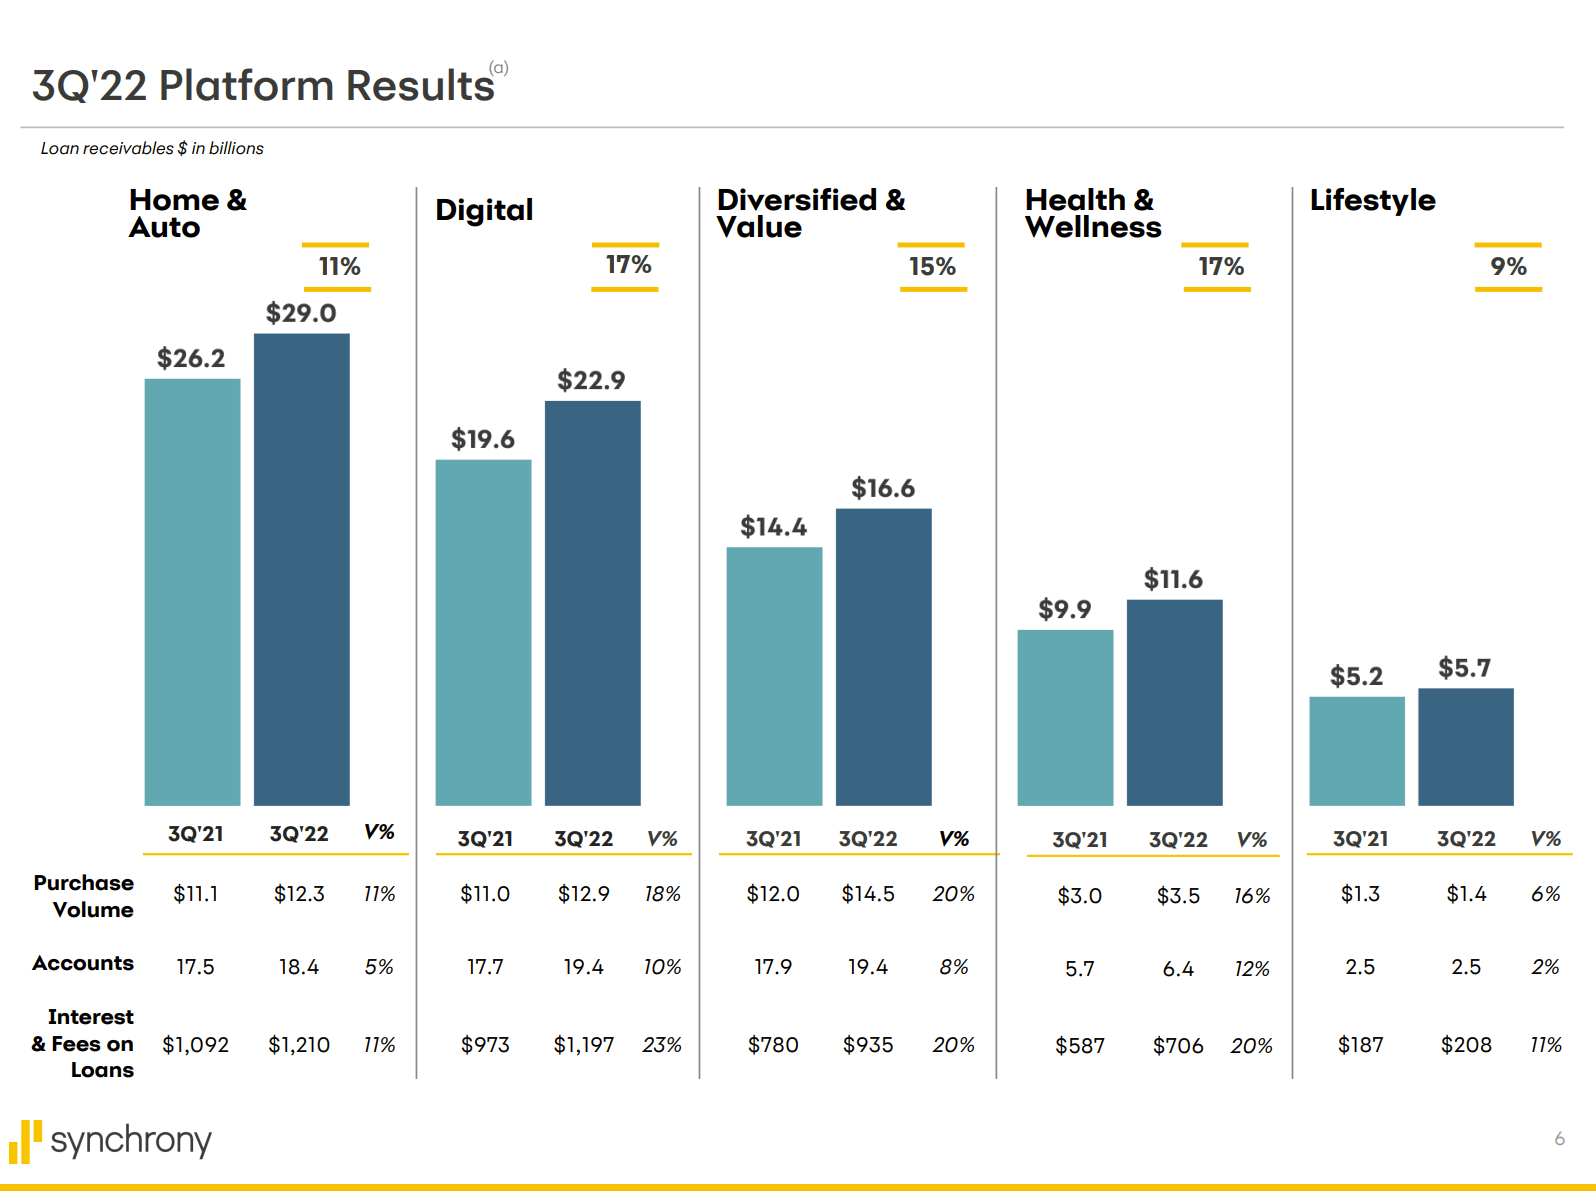
Inflation has caused a shift from discretionary to essential spending but has not resulted in lower spending overall. The company even noted this trend reversing a bit as gas prices have come down from peak levels. Employment remains strong and many consumers have still not spent all their government stimulus from 2021. Updated survey results noted on the earnings call indicate that the percentage of consumers who have spent the entire amount is now 40%, up only slightly from 38% last quarter. While delinquency and charge-off rates continue to trend higher, they are nowhere near the 5.5% charge-off rate that the company saw in 2019. Synchrony expects charge-offs to reach this level by the end of 2023. As I will show in the model below, this should result in only a minimal decline in earnings compared to 2022.
Synchrony Financial 3Q 2022 Earnings Release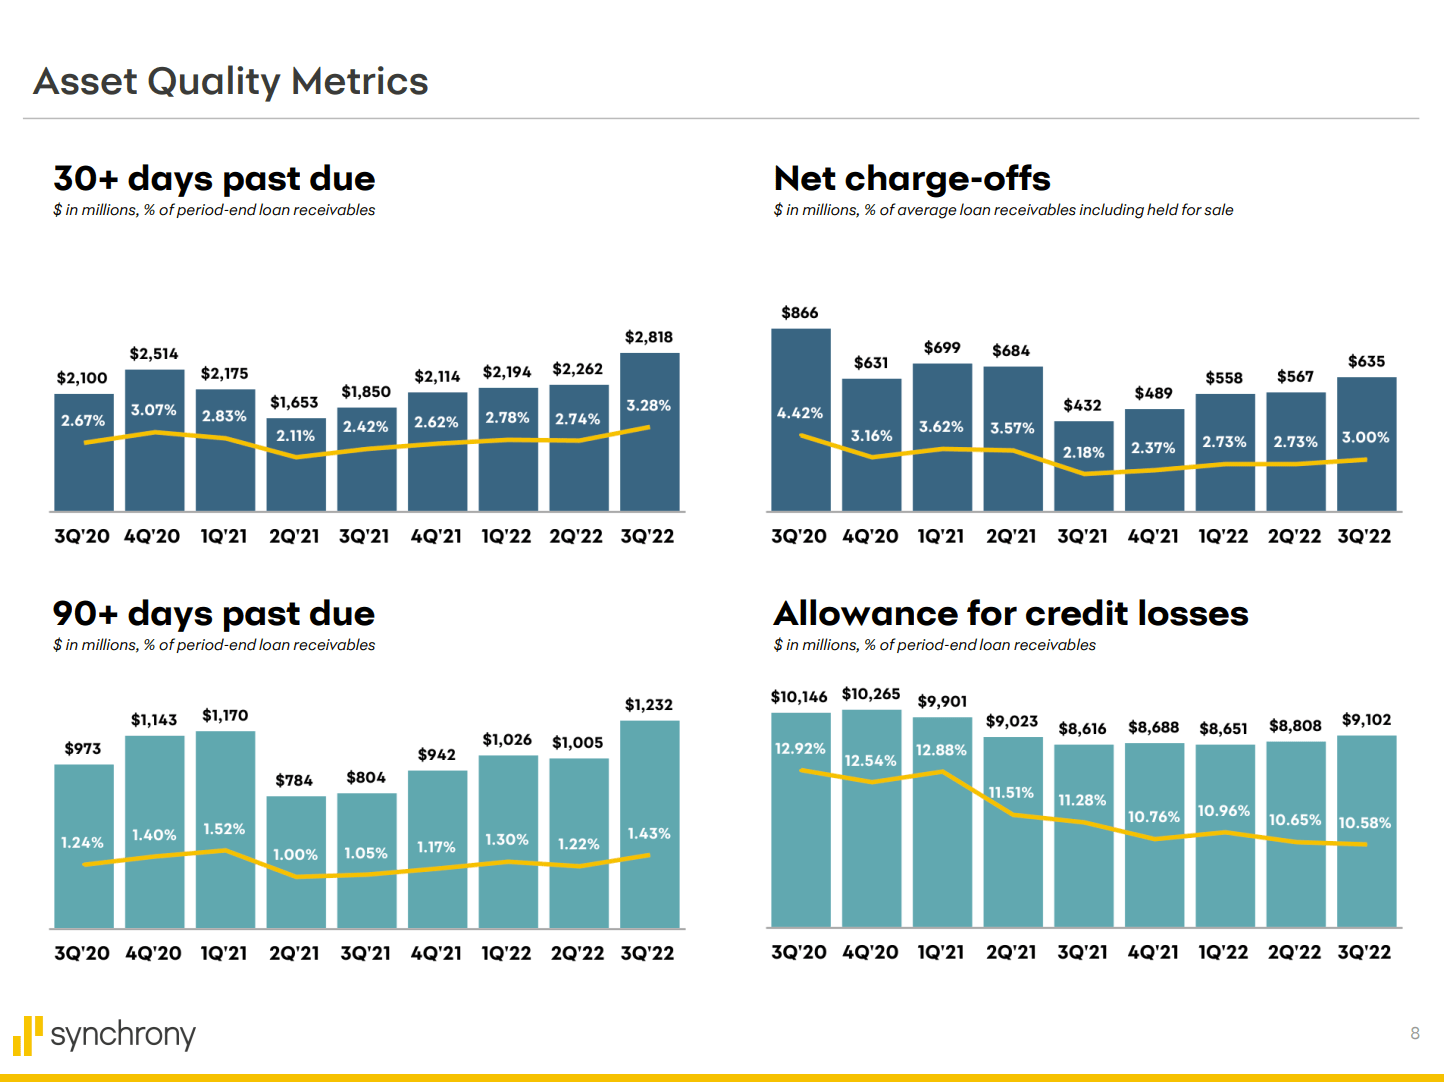
As I have stated in previous articles, when charge offs increase, the impact on Synchrony is partially mitigated by the reduction in incentive payments given back to card program partners known as Retailer Share Arrangements. RSA’s have averaged 5.27% of loan receivables year-to-date and the company lowered the full year RSA forecast to 5.1%, implying 4.5% in 4Q. The bank also continues to hold the line on operating expenses as a percent of interest income in spite of inflation.
Synchrony remains conservative with their dividend, increasing it by only $0.01 this past quarter to $0.23, which is a 2.6% yield thanks to the recent recovery in the share price. The bank continues to have a huge buyback program. Synchrony has now reduced share count by 13% since the end of 2021. Synchrony still has $1.4 billion of buybacks authorized through 2Q 2023. This would reduce share count by another 9.5%.
As you will see in the model below, I now expect Synchrony to earn $6.14 per share this year. The declines in credit quality are offset by decreases in RSA’s and share count while net interest income and costs remain stable. At $35, the stock has is still cheap with a P/E of 5.7, up only slightly from my estimate of 5.5 last quarter. I will show below that earnings should decrease only slightly in 2023 with even with planned declines in credit quality. However, in the event of a deeper recession, Synchrony remains well-capitalized with a 14.3% Common Equity Tier 1 capital ratio and 20.1% liquid assets including undrawn credit facilities. The low multiple remains unjustified making the stock a Buy.
Financial Model Update
With 3Q results, Synchrony provided improved guidance on key metrics for FY 2022 including loan receivables growth, net interest margin, charge-off rate, and RSA’s. This implies a strong fourth quarter and good momentum headed into 2023.
Synchrony Financial 3Q 2022 Earnings Slides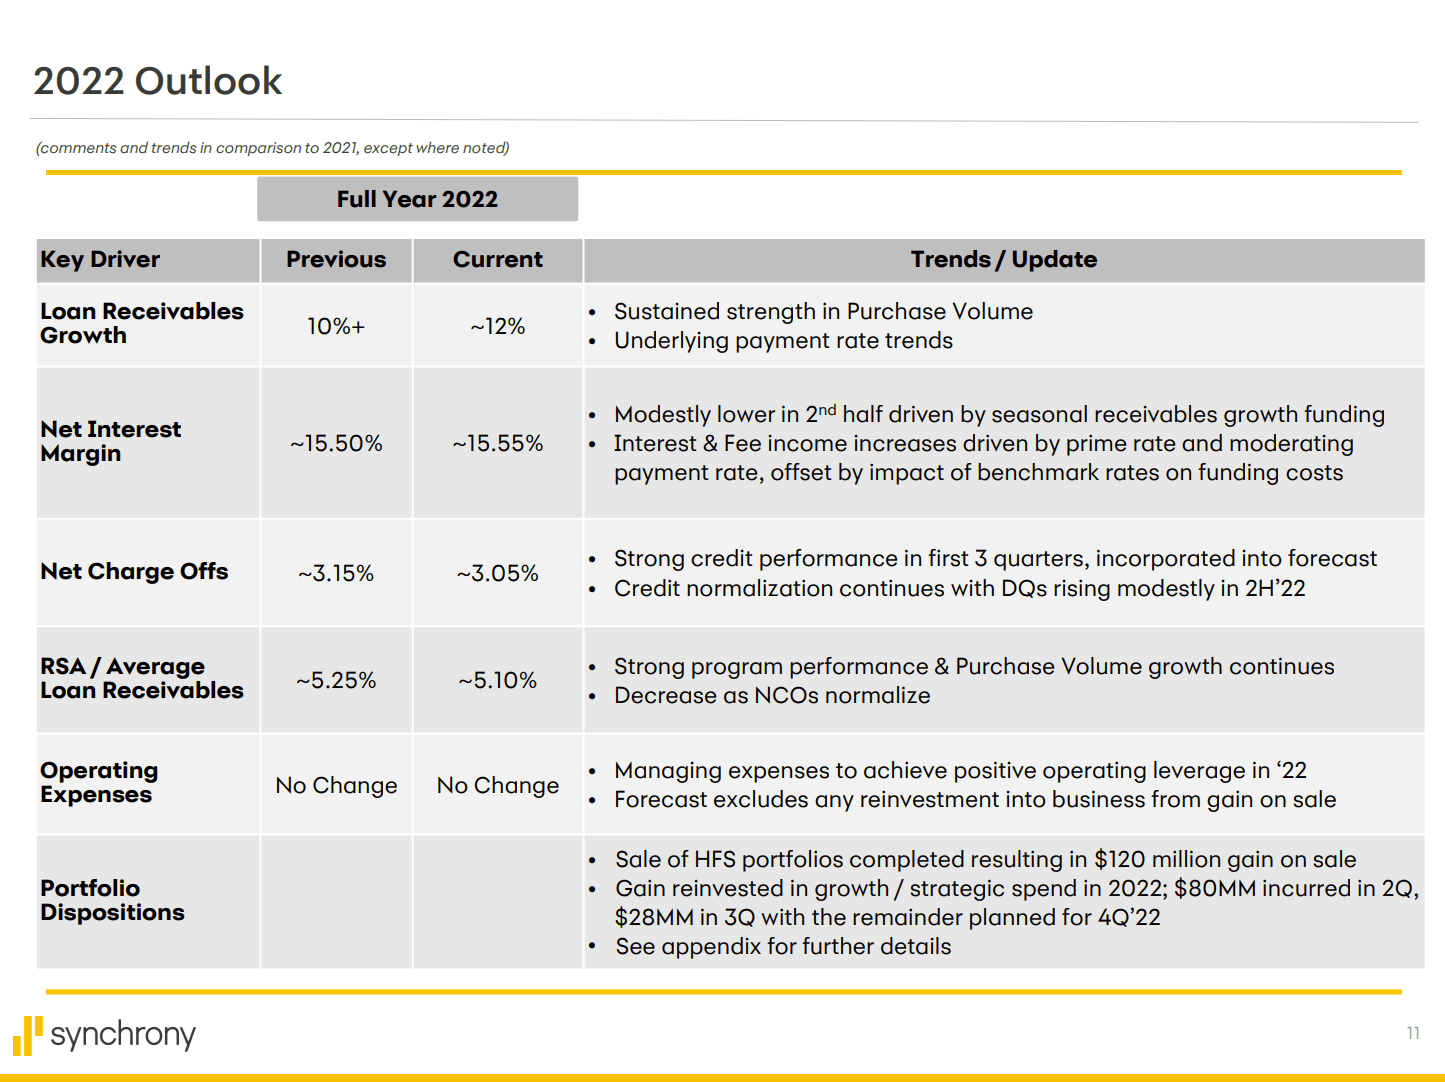
The bank did not provide any guidance for 2023 except that they stated they expect the charge-off rate to reach 5.5% by the end of 2023 compared to 3.0% last quarter. For loan receivables growth, I am assuming 6% which is half of this year’s level. In the event of a recession, spending may slow but account balances would likely increase as customers pay off balances more slowly. I am conservatively showing RSA’s at 4.5%, in line with 4Q 2022 even though they could decrease further as charge-offs increase. I am assuming net interest margins of 15%, also in-line with 4Q. The company stated that they were emphasizing 12-18 month CD sales to lock in deposits at current interest rates and avoid taking too many deposits at expected peak rates in early 2023. Finally, I am assuming efficiency ratio in line with 4Q 2022 and no change in tax rate.
Author Spreadsheet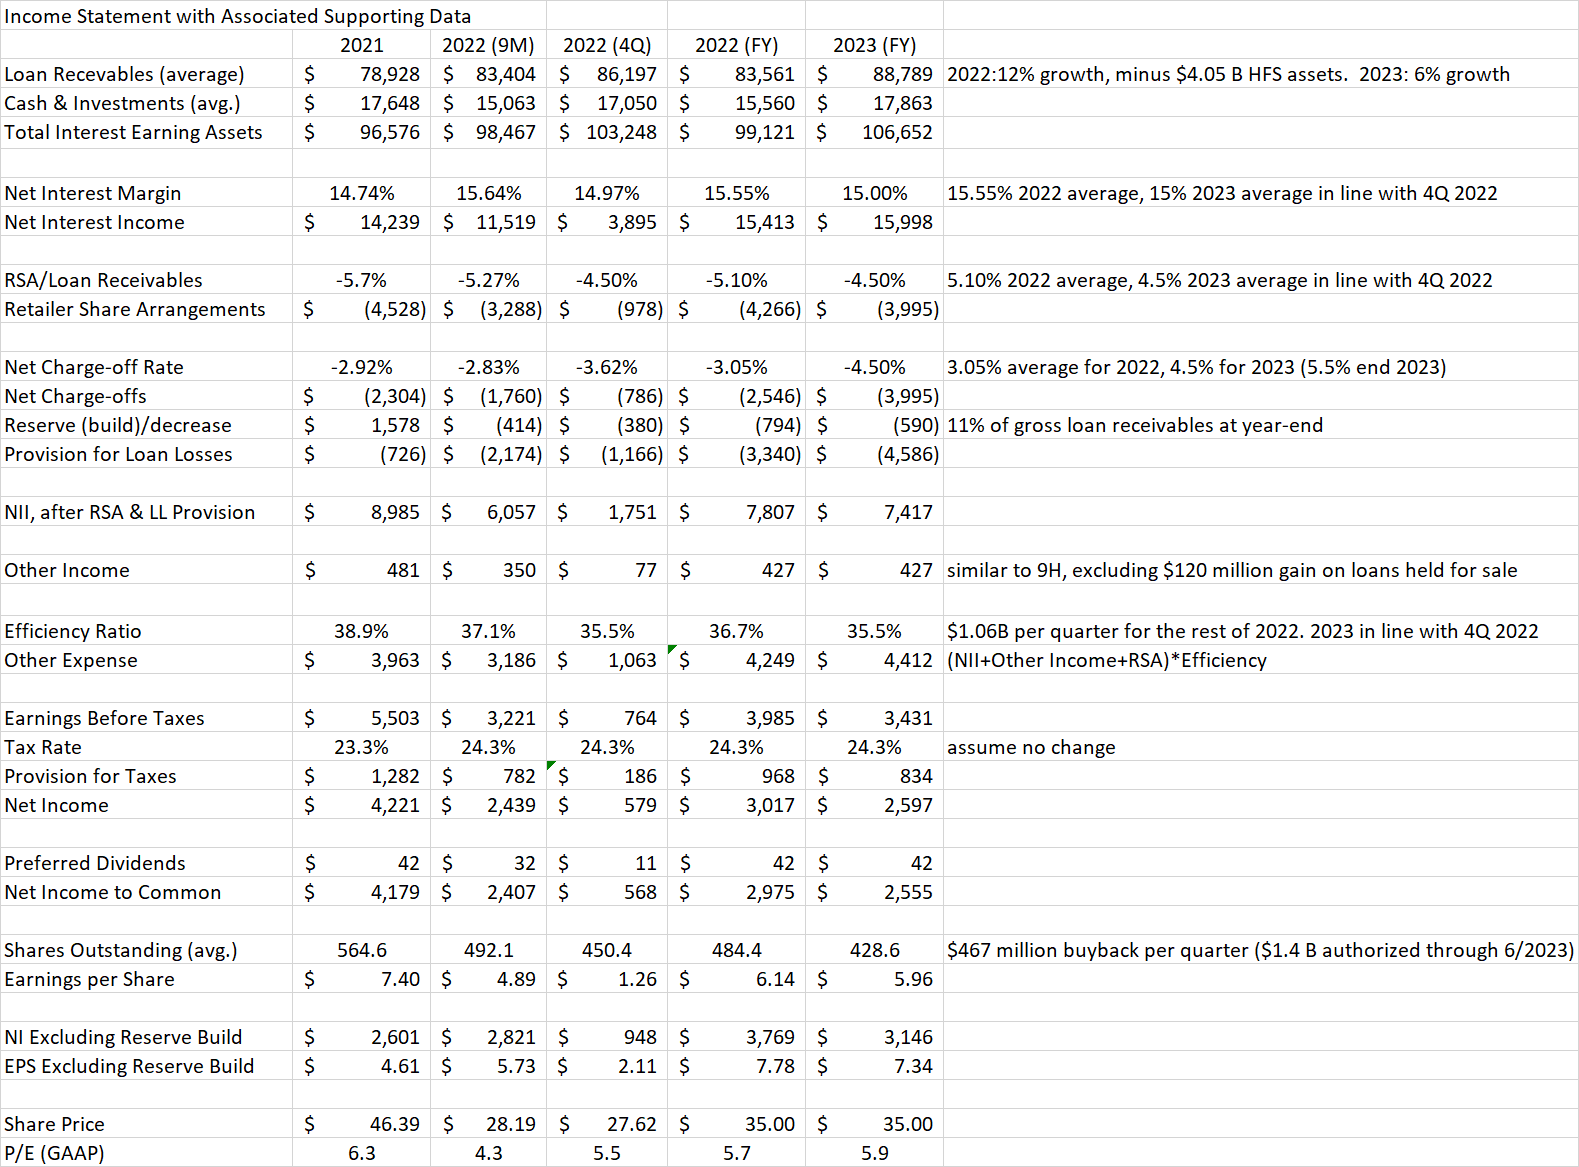
On the balance sheet, I show Synchrony increasing deposits in 2023 to maintain this funding source at a similar percentage of overall liabilities. The company returns capital to shareholders via buybacks of $467 million per quarter through 2Q 2023 and dividends at $0.23 per quarter currently, increasing to $0.24 in 2023.
Author Spreadsheet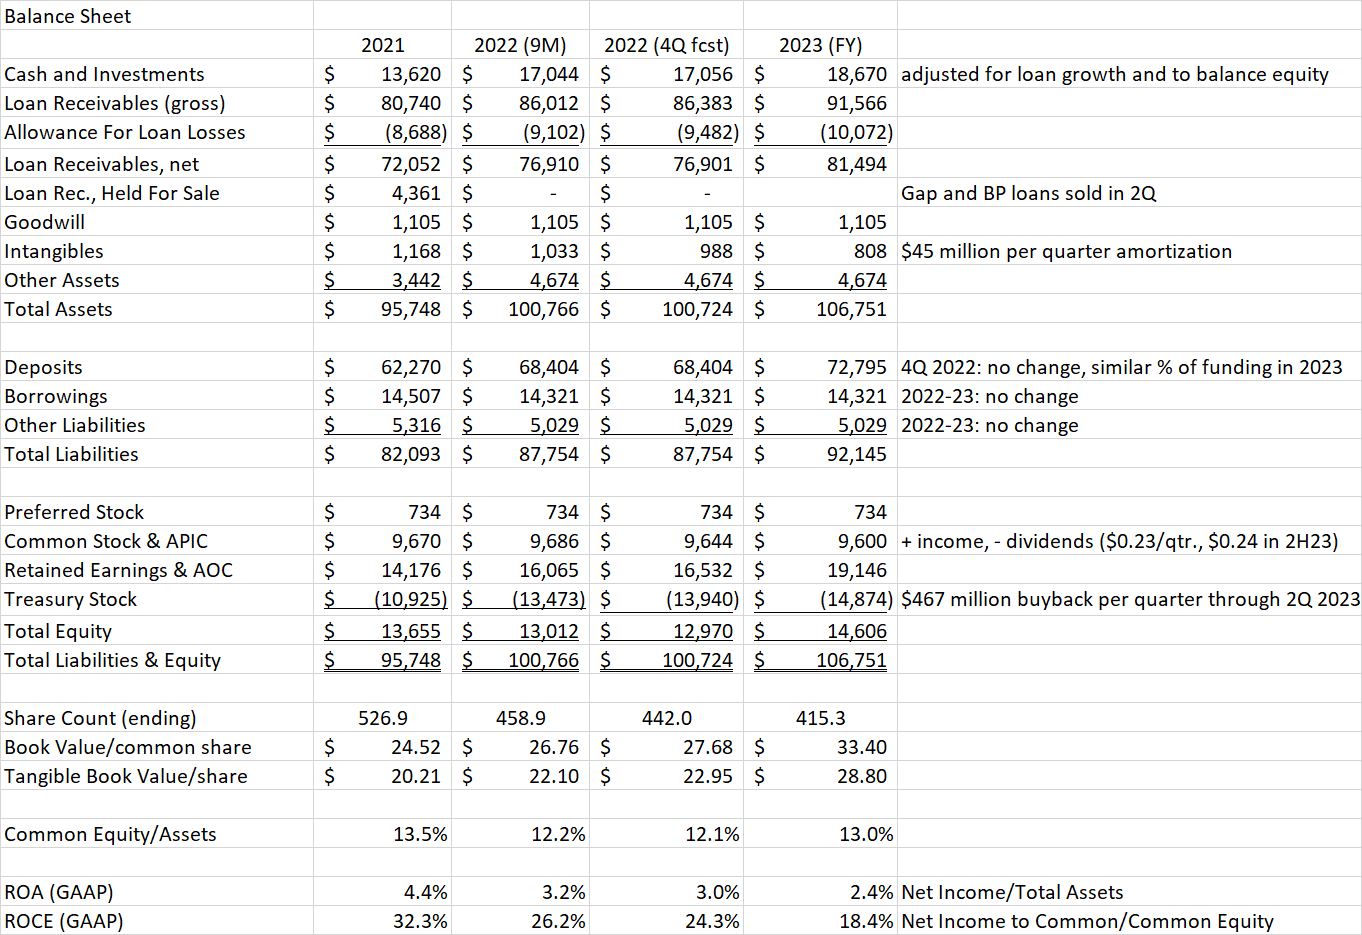
For 2023, increasing loan loss provision more than offsets growth in interest income and reduction in RSA’s leading to a decline in net income of around 14%. However, because of reduced share count from buybacks, EPS drops less than 3%. 2023 P/E is still cheap at 5.9 times. Again, this assumes no buybacks in 2H 2023 once the current authorization expires. As we see on the balance sheet model, forecasted cash at the end of 2023 is above current levels and common equity/assets is higher at 13% compared to 12.2% currently. The company could authorize additional buybacks next year which could result in EPS exceeding 2022 levels thanks to lower share count.
Preferred Stock and Bonds Also Look Better
Synchrony has a preferred issue (SYF.PA) with a 5.625% coupon that has gotten beaten up as interest rates increase. It now trades around $17.50 for a current yield of 8%. The preferred is callable starting on 11/15/2024 at par value of $25. While I wouldn’t expect a call in the current interest rate environment, it could happen if rates go down. With $734 million outstanding, the preferred is only around 5.6% of total equity. Also, preferred dividends are only about 1.4% of forecasted net income this year. The BB- rating from S&P seems too low given this excellent coverage.
Synchrony also has a number of bonds available with maturity dates from March 2024 (YTM 5.9%) to October 2031 (YTM 7.5%). These bonds are rated BBB- by S&P and are yielding about 150 basis points higher than they were when I wrote about them last quarter.
Charles Schwab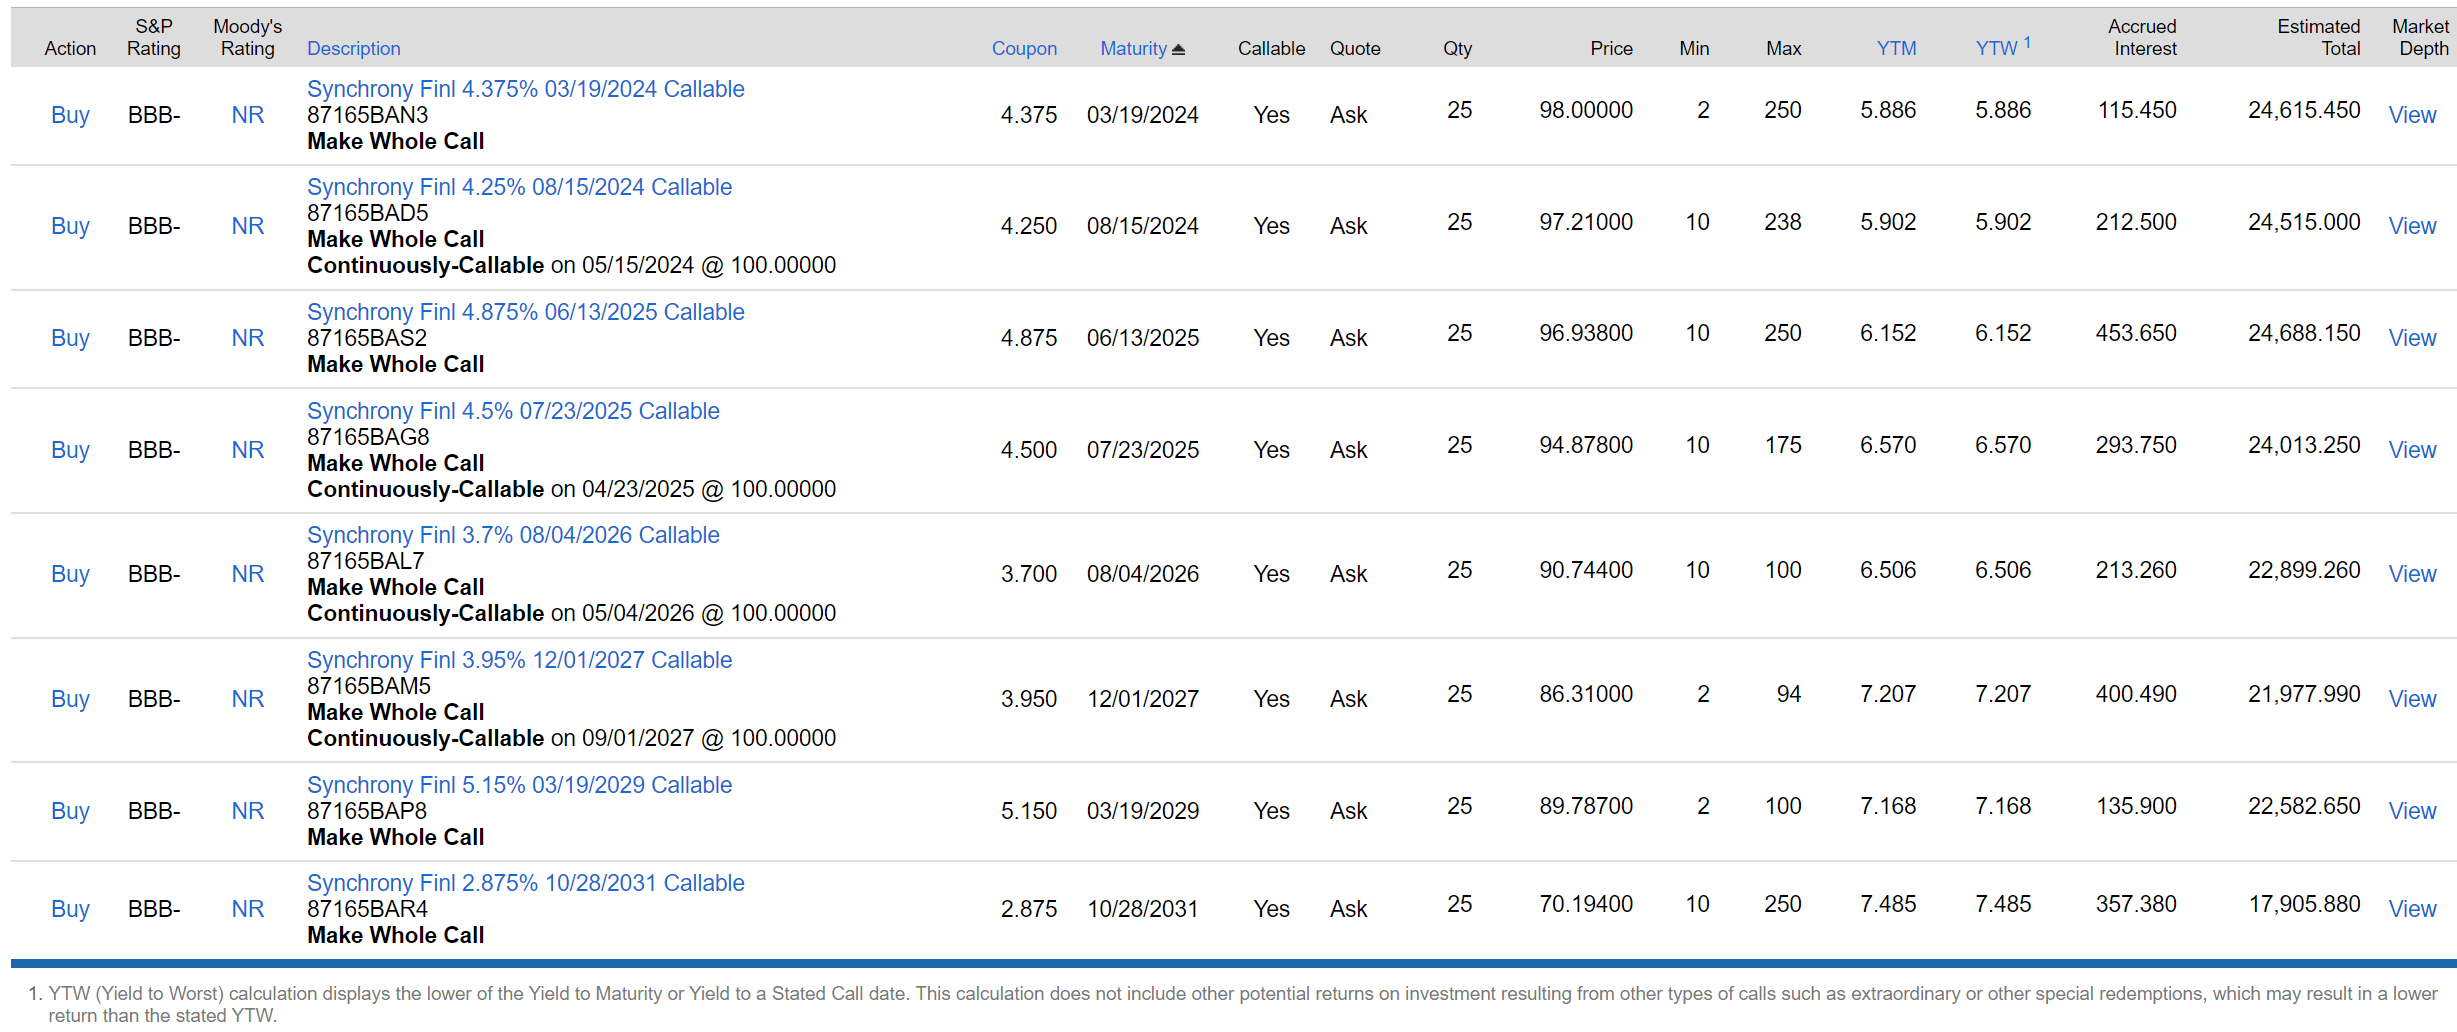
Conclusion
SYF share price has stabilized since last quarter as loan growth offsets worries about an upcoming recession having an impact on consumer spending. The consumer is still paying their bills on time, even as they are buying more and starting to carry a higher balance. The organic growth in loan receivables combined with new programs is more than offsetting the lost interest income from the recently sold BP and Gap loan portfolios.
The strong earnings enable Synchrony to continue buying back large quantities of shares, helping EPS and book value per share. This is true even with a more conservative estimate for loan loss reserve builds 4Q 2022 and FY 2023. I now expect the bank to earn $6.13 per share this year which puts the P/E at a still cheap 5.7 times 2022 earnings. For 2023, I expect the decline in earnings to be almost fully offset by further buybacks, valuing the bank at only 5.9 times 2023 earnings.
If earnings dip further in the event of a recession, the bank remains well capitalized with good liquidity to make it through. After rating SYF a Strong Buy last quarter, the shares have traded slightly higher. Nothing has changed about the company fundamentals. Nevertheless, sentiment risk could subject the stock to pullbacks in the months ahead. I now rate SYF a Buy. If you are still worried about the common stock, there are other securities higher up the capital structure that also offer attractive returns. The preferred stock and bonds remain safe and well-covered, and yields have improved further since last quarter.
Be the first to comment