

Swiss Franc, CHF, GBP/CHF, AUD/CHF, NZD/CHF – Talking Points
- GBP/CHF breaks through trendline support, 1.2200 level eyed for next support
- AUD/CHF breaking lower, as 50 DMA and key pivot zone fail to hold the pair
- NZD/CHF makes fresh 3-week low, Fibonacci support potentially eyed below
GBP/CHF Technical Analysis
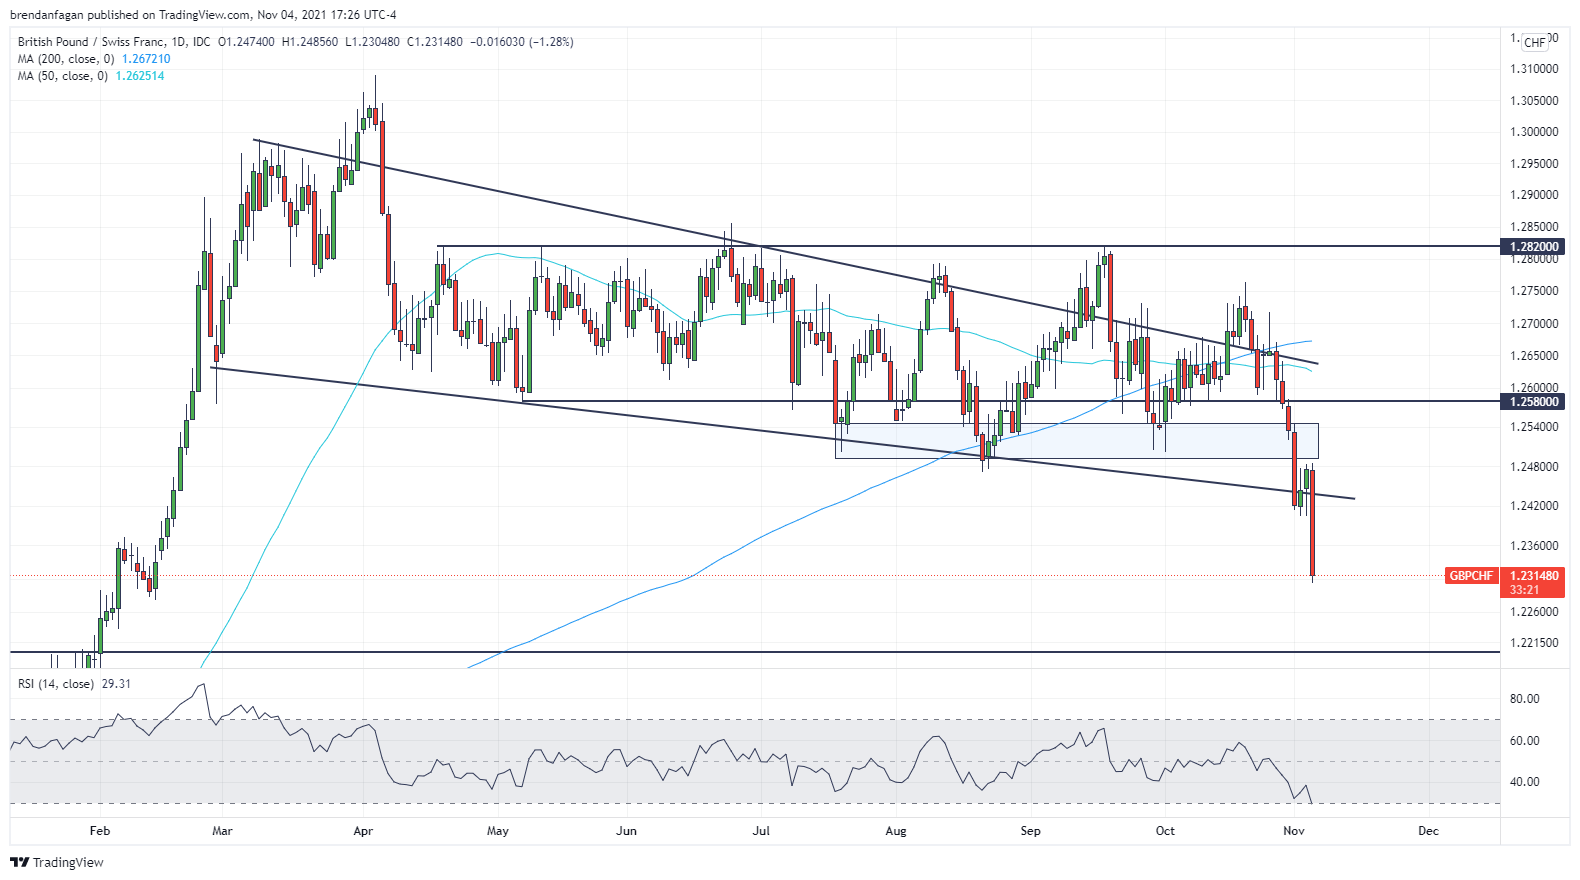
GBP/CHF took a nice leg lower on Thursday following the Bank of England’s decision to leave monetary policy unchanged, despite hawkish market pricing. That decision saw the cross break through multi-month trendline support, ushering in lows that have not traded since February. With the Sterling in free fall, market participants may remain wary of trying to catch a falling knife. Prior to Thursday’s sharp drop, the pair was already trending lower, with confirmation coming as the 50-day moving average fell below the 200-day moving average. Traders may look to the 1.2200 level for near-term support, should the decline continue from current levels.
GBP/CHF Daily Chart
Chart created with TradingView
AUD/CHF Technical Analysis
Following a prolonged period of strength, AUD/CHF was on the back foot for most of October, with the pair remaining under pressure in the early days of November. Further declines have materialized as the cross fell below its 50-day moving average. On top of this, selling pressure saw a key pivot zone around 0.6800 fail to hold as well. With price moving lower, traders may look to the upper bound of the pair’s previous channel for near-term support. A near-term bounce could see the pair re-test the 50-day moving average, but momentum and trend indicate that more pain may be ahead.
AUD/CHF Daily Chart

Chart created with TradingView
NZD/CHF Technical Analysis
Mirroring the Aussie cross, NZD/CHF has also taken a leg lower of late, with the pair breaking through the key 0.618 Fibonacci level at 0.6510. Thursday’s decline also sees the pair fall below both the 50-day and 200-day moving averages, further adding pressure to the pair. Market participants may look to see the cross trade down to support at the 0.5 Fib level at 0.6431 before bouncing. The relative strength of the cross also highlights fading momentum, potentially painting a picture of further losses for NZD/CHF. Anear-term reprieve of pressure may see a retest of the 0.6500 psychological level, and with that the 200-day moving average.
NZD/CHF Daily Chart
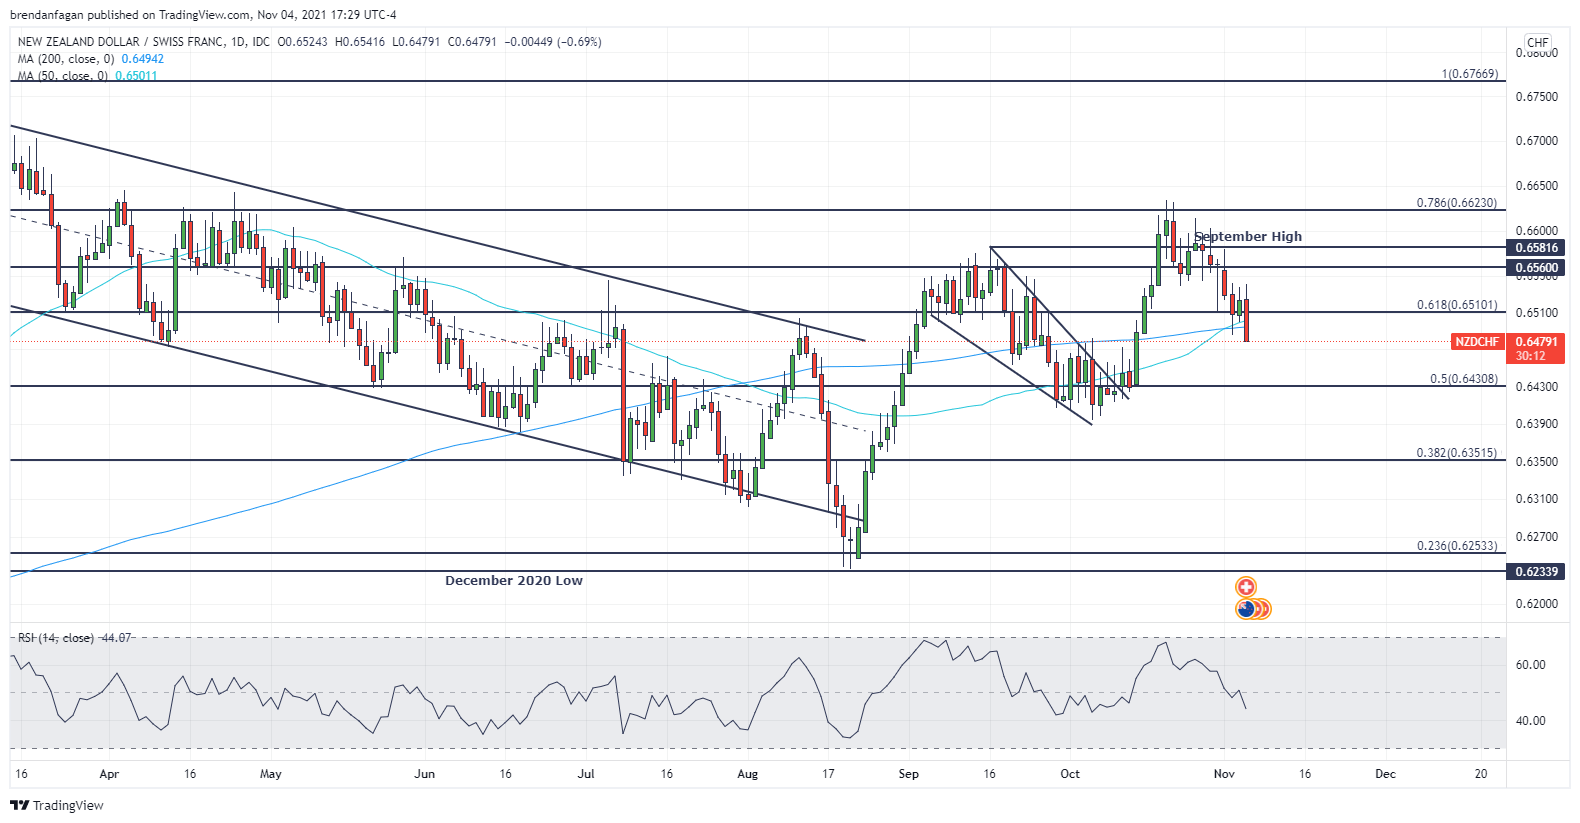
Chart created with TradingView
Resources for Forex Traders
Whether you are a new or experienced trader, we have several resources available to help you; indicator for tracking trader sentiment, quarterly trading forecasts, analytical and educational webinars held daily, trading guides to help you improve trading performance, and one specifically for those who are new to forex.
— Written by Brendan Fagan, Intern
To contact Brendan, use the comments section below or @BrendanFaganFX on Twitter
Be the first to comment