

sankai
The outlook for future dividends per share of the S&P 500 (SPX) improved since our previous mid-season snapshot at the midpoint of 2022-Q2. The following chart shows those expectations as of Thursday, 11 August 2022:
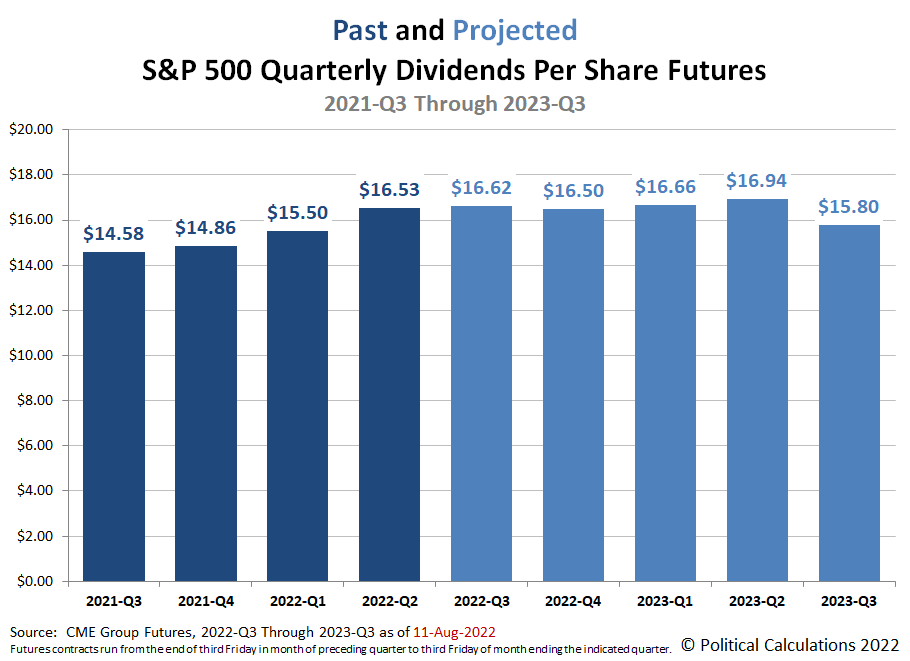
Here’s how investor expectations for the S&P 500’s future dividends per share changed for each of the upcoming quarters shown in the first chart since our last snapshot three months ago:
- 2022-Q3: Up $0.07 per share
- 2022-Q4: Up $0.45 per share
- 2023-Q1: Up $0.56 per share
- 2023-Q2: Up $0.54 per share
- 2023-Q3: Down $0.45 per share
These increases across most future quarters point to an improved outlook for the S&P 500’s dividends over the past three months, with the exception of 2023-Q3, where dividend futures point to a sharp reduction. But there’s an important factor to consider about this latter development.
These figures are based on dividend futures data that tends to be the most stable for the nearest term future quarter and the most volatile for the most distant future quarters. As it is, we’re pushing the limits in showing the expected future for 2023-Q3, the expectations for which are the least well established at this writing. That will settle down as time passes, but right now, it’s very early days for dividend futures data for this quarter!
Analyst’s Notes
Six weeks ago, we started tracking what the S&P 500’s quarterly dividend futures look like about a week after the end of each dividend futures contract expiration date to capture changes in expectations that investors update during these busy options trading periods. Our next update on dividend futures will be in late September 2022 and will present how they’ve changed from 27 June 2022 through 26 September 2022.
More About Dividend Futures
Dividend futures indicate the amount of dividends per share to be paid out over the period covered by each quarter’s dividend futures contracts, which start on the day after the preceding quarter’s dividend futures contracts expire and end on the third Friday of the month ending the indicated quarter. So for example, as determined by dividend futures contracts, the “current” quarter of 2022-Q3 began on Saturday, 17 June 2022 and will end on Friday, 16 September 2022.
That makes these figures different from the quarterly dividends per share figures reported by Standard & Poor’s, who reports the amount of dividends per share paid out during regular calendar quarters after the end of each quarter. This term mismatch accounts for the differences in dividends reported by both sources, with the biggest differences between the two typically seen in the first and fourth quarters of each year.
Reference
The past and projected data shown in this chart was taken from the CME Group’s S&P 500 quarterly dividend index futures on the indicated dates. The past data reflects the values reported by CME Group on the date the associated dividend futures contract expired, while the projected data reflects the values reported on 11 August 2022.
Editor’s Note: The summary bullets for this article were chosen by Seeking Alpha editors.
Be the first to comment