

In an often controversial recent article entitled “Why You Failed to Buy the Dip“, I examined the psychological and behavioral reasons why some investors failed to add additional risk amidst the sharp drawdown in share prices. Research has shown that many individuals fear losses even more than they like gains, and can experience an aversion to ambiguity amidst a widening distribution of potential outcomes. The historically sharp equity market selloff amidst an unprecedented drop in economic activity had some paralyzed by fear into inaction.
While the ultimate downside in this public heath and economic crisis will be bound by the ability to corral the spread of the virus, the dual barrel firepower deployment of record fiscal stimulus and a “whatever it takes” approach to supporting market liquidity by the Federal Reserve seems to have stabilized share prices. The Fed activity in particular should provide enough corporate liquidity to ensure that short-term liquidity challenges from the virus-induced shutdown do not turn into solvency challenges for good businesses.
Timing the bottom is always a challenge, but we do know what strategies have worked the best from previous bottoms when the market has recovered. In the next several articles, I am going to illustrate some of those strategies for readers and cover their historical performance after past periods of equity market stress.
The first strategy I will cover in this inaugural article is simply equal-weighting stocks. If our benchmark is a capitalization-weighted index like the S&P 500, then an equal-weighted version of that index should outperform in the aftermath of the bottoming out for stocks. The reason for this outperformance is that equal-weighted strategies use contrarian rebalancing to buy those stocks that have underperformed in the sell-off and reduce those companies that have held up better.
You can see the historical outperformance of this strategy in the last cycle. From the point at which stocks peaked on October 9th 2007 through their lows on March 9th, 2009 the S&P 500 had a total return of -55%. In this article, we are going to comp the capitalization-weighted S&P 500 versus the equal-weighted S&P 500 over the year after stocks bottomed. You can see from the chart below that equal-weighting dramatically outperformed. The S&P 500 soared 72% from the bottom in stocks over the next year, but the equal-weight version of those same constituents rallied 107%.
Prior to the Global Financial Crisis, the previous stress period for stocks was the deflation of the Tech Bubble in the early 2000s. From the peak for stocks on March 24th, 2000 through the trough on October 9th, 2002, the S&P 500 had a total return of -47%. Given that the collapse was dominated in tech-heavy large caps, you might have expected the capitalization-weighted index to outperform in the recovery. Like the Financial Crisis episode, the equal-weighted index sharply outperformed in the recovery. Over the next year from the 2002 bottom, the S&P 500 rallied 36%, but the equal-weight index rallied 58%.
 Source: Bloomberg
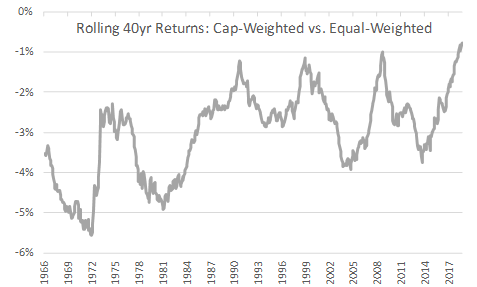
While equal-weighting tends to outperform early in a recovery, some readers might question whether the strategy outperforms over a full cycle. In April 2019, I published Rolling Returns: Equal-Weighted vs. Cap-Weighted that showed that as holding periods extend that equal-weighting is more likely to outperform cap-weighting in a broad subset of the U.S. stock market. Using a 90-year dataset, equal-weighting had outperformed in every rolling 40-year period – roughly the length of time from early adulthood saving to disinvestment during retirement. Over that full dataset, equal-weighting beat cap-weighting by 2.7% per year.
(Interestingly, capitalization-weighting had experiences its best relative performance into the current market correction, the 2008 correction, the early 2000s tech bubble, and the 1991 recession. The performance of equal-weighting vs. capitalization-weighting certainly did not predict a global health crisis, but this relationship has been a signal for previous market corrections.)
Part of this long-run outperformance for equal-weighting is driven by its sharp outperformance during recovery periods. This post-crisis outperformance is driven by the contrarian rebalancing in the fund, and a tendency towards higher weights in smaller capitalization stocks. For investors looking for a broadly diversified way of playing the recovery, equal-weighting the S&P 500 through the Invesco S&P 500 Equal Weight ETF (RSP) might be something to consider. You get both the tactical bent of a strategy that should outperform as markets recover, and the strategic overweight of a strategy that has outperformed over long-time intervals. Look for additional “recovery strategies” to be featured in near-term articles.
Additional disclosure: Disclaimer: My articles may contain statements and projections that are forward-looking in nature, and therefore inherently subject to numerous risks, uncertainties and assumptions. While my articles focus on generating long-term risk-adjusted returns, investment decisions necessarily involve the risk of loss of principal. Individual investor circumstances vary significantly, and information gleaned from my articles should be applied to your own unique investment situation, objectives, risk tolerance, and investment horizon.
Disclosure: I am/we are long RSP. I wrote this article myself, and it expresses my own opinions. I am not receiving compensation for it (other than from Seeking Alpha). I have no business relationship with any company whose stock is mentioned in this article.
Be the first to comment