

Galeanu Mihai
In the case of strategic allocation, we will look at two 60/40 portfolios both with 60% in SPY ETF (SPY), one with 40% in TLT ETF (TLT), and the other with 40% in AGG ETF (AGG). Both strategic allocations are rebalanced annually.
The TLT ETF has a duration of 17.7 years and a convexity of 4.06. The AGG ETF has a duration of 6.4 years and a convexity of 0.63, as of January 19, 2023 (Source: Blackrock). As a result of longer duration and higher convexity, the TLT ETF is much more sensitive to changes in yields. The choice of the bond ETF in the 60/40 allocation depends on the risk profile and impacts performance, as will be shown below.
In the case of market timing strategies, we look at the popular 10-month moving average cross in SPY ETF, long-only, and long-short. More details are provided below.
The strategic allocations and market timing strategies chosen offer a perspective of performance. There are many possible strategies and variations.
All backtests are in the daily timeframe to yield a realistic maximum drawdown and Sharpe ratio. The backtest period for the 60/40 allocations is from 01/02/2004 to 01/20/2023. For the market timing strategies, the backtest period is from 01/29/1993 to 01/20/2023.
In all cases below, the top chart shows the yearly returns of the allocation or strategy. The next chart shows the equity curve (red line). The black line is the equity curve for SPY ETF buy and hold in the same period. The stats on the chart refer to the allocation or strategy. The next chart shows the drawdown profile, and the last chart shows the daily returns.
Case 1. 60/40 Portfolio with SPY and AGG ETFs
Yearly Performance and Equity Curve Of 60/40 Portfolio in SPY and AGG, Annually Rebalanced (Price Action Lab Blog – Norgate Data)
The 2022 yearly loss of 16.1% has not been the largest. In 2008, this strategic allocation fell by 19.1%. In the period considered, the annualized return is 6.7% and the maximum drawdown is 33.8%. This strategic allocation has underperformed SPY ETF buy and hold annualized return by a wide margin of 230 basis points but has outperformed on a risk-adjusted basis with a Sharpe ratio of 0.61 versus 0.47 for SPY ETF buy and hold.
This particular strategic allocation is up 2.6% year-to-date (based on the opening prices for the year).
Case 2. 60/40 Portfolio with SPY and TLT ETFs
Yearly Performance and Equity Curve Of 60/40 Portfolio in SPY and TLT, Annually Rebalanced (Price Action Lab Blog – Norgate Data)
The 2022 yearly loss of 23.2% in the test period has been the largest. In 2008, this strategic allocation fell by 8.7%. The annualized return is 7.8% and the maximum drawdown is 28%. This strategic allocation has underperformed SPY ETF buy and hold annualized return by a margin of 120 basis points but has outperformed on a risk-adjusted basis with a Sharpe of 0.75 versus 0.47 for SPY ETF buy and hold. This particular strategic allocation is up 3.3% year-to-date (based on the opening prices for the year).
Despite the large loss in 2022, this strategic allocation in SPY and TLT ETFs has a better historical performance than the one in SPY and AGG ETFs and has tracked more closely the SPY ETF buy and hold but with a better risk-adjusted performance. The past is not a good guide for the future due to market regime changes, but this strategic allocation may perform better if the scenarios of a quick normalization of inflation and interest rates materialize, due to the higher duration and convexity of TLT ETF. However, higher risks are present in case of a resurgance of inflation.
Case 3. Long-only 10-Month Momentum with SPY ETF
Yearly Performance and Equity Curve Of 10-Month Long-Only Momentum in SPY (Price Action Lab Blog – Norgate Data)
The 10-month momentum strategy goes long SPY when the price is above the 10-month simple moving average and exits when the price falls below the average. There are many variations of this strategy but in this article, we consider the simplest one.
The 21.7% loss of this strategy in 2022 was the largest by a significant margin since the SPY inception. This 2022 loss was about three times larger than the largest loss before that in 2018 of 7.5%. In other words, this strategy had an extreme left-tail event in 2022. Despite the large loss in 2022, the annualized return since SPY ETF inception is 8.4% and 120 basis points lower than the ETF buy and hold annualized return. The maximum drawdown is half that of buy and hold and the Sharpe ratio is higher, at 0.66 versus 0.51 for buy and hold. The return this year is 0.5% due to the strategy exiting on the first day of the year and has since remained flat.
Market timers have good reasons to be skeptical about this strategy. Although during the dot-com and GFC bear markets the strategy behaved well, in 2022 it failed due to a momentum regime change. The failure could be due to crowding or a random path that produced a left-tail outlier. The performance going forward could deteriorate further and it is also sensitive to the choice of moving average period. For example, a 12-month moving average generated a loss of 13% in 2022, which is still the largest loss in the period considered. One problem with these momentum strategies is that the optimum lookback period is a random variable and is never known in advance but only in hindsight.
Case 4. Long-short 10-Month Momentum with SPY ETF
Yearly Performance and Equity Curve Of 10-Month Long-Short Momentum in SPY (Price Action Lab Blog – Norgate Data)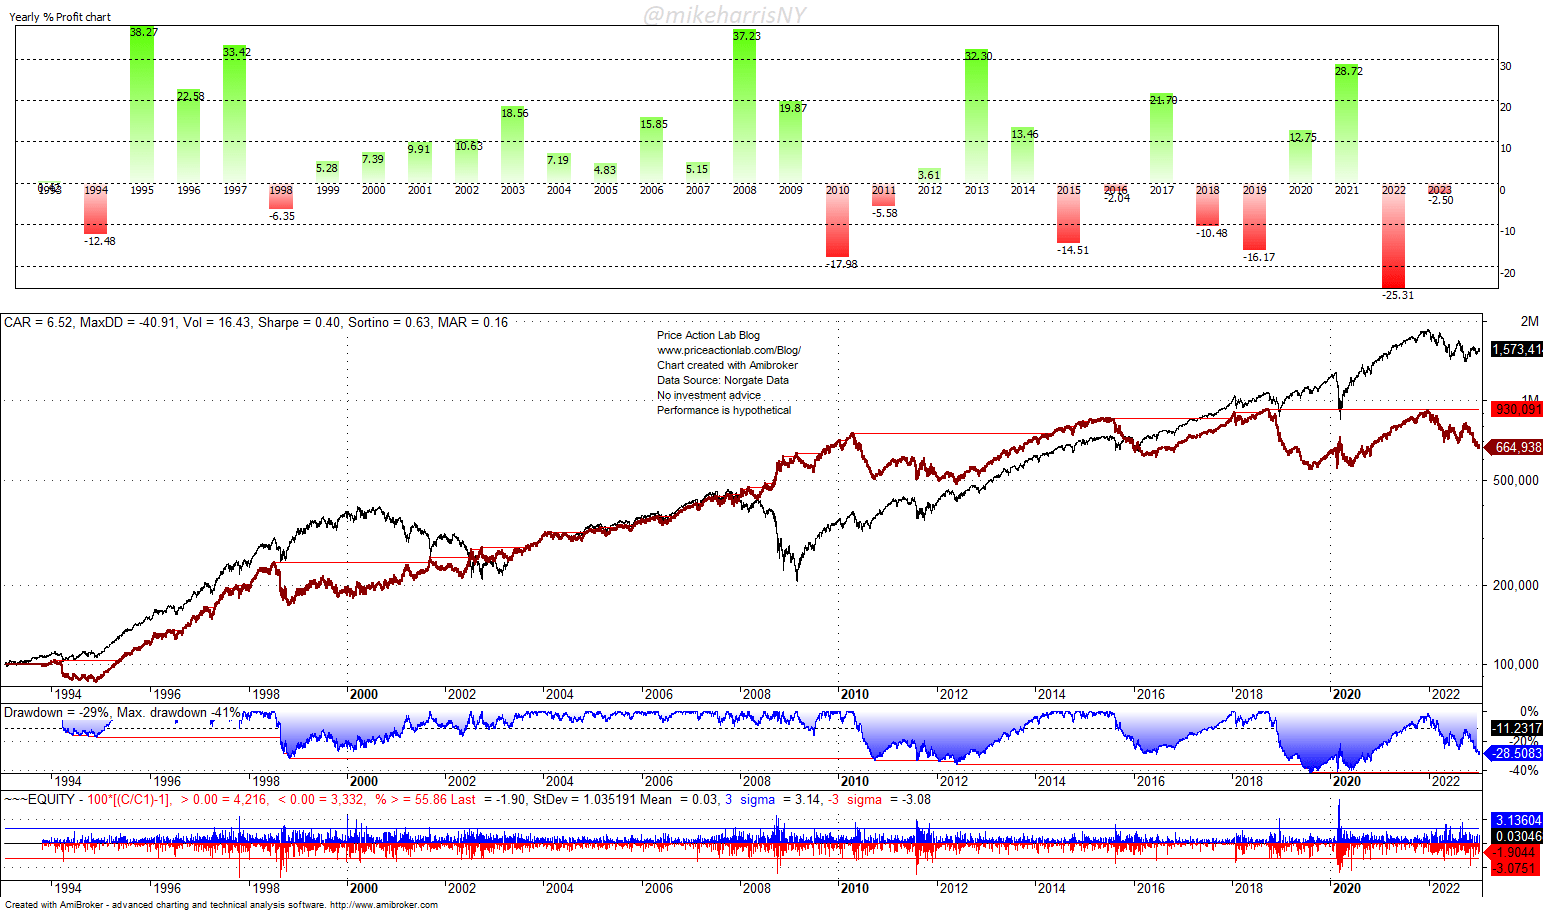
If long-only momentum failed in 2022, a reasonable expectation would be that long-short momentum gained. Unfortunately, long-short momentum did even worse and this is a reflection of the hostile market conditions last year for momentum, long or short.
This 10-month momentum strategy goes long SPY when the price is above the 10-month simple moving average and reverses to short when the price falls below the average. There are many variations of this strategy, as is the case with the long-only version, but in this article, we consider the simplest one.
Although this long-short strategy had excellent returns during the dot-com and GFC bear markets, it failed in 2022. This is to serve as a reminder that strategies fail when market regimes change. In 2008, this strategy generated a return of 37.2% before transaction costs due to a short position in SPY ETF. In 2022, the strategy went short twice, with both trades ending in the red. The cause of the short trade losses was the relief rallies, and in turn, the cause of the long losses was the bull trap formations and the test of the lows.
The large drawdown of the long-short strategy at 40.9% and the low Sharpe at 0.40 are a reason to ignore it. A Sharpe below 0.5 is a source of risk. As a first-order approximation, the recovery time in years after a drawdown is proportional to the inverse of the Sharpe ratio: the lower the Sharpe ratio, the longer the recovery takes.
It is possible in the future the long-short strategy will provide convexity during a bear market, but the risks of underperformance are high. The long-only version may provide better returns and the convexity during bear markets can be achieved by investing in alternatives, for example, in managed futures. See this SA article and also this SA article for more details.
Conclusion
The strategic allocation in SPY and AGG had the smallest loss but may underperform going forward in an environment of falling inflation and rates.
The strategic allocation in SPY and TLT had a large loss but may outperform going forward in an environment of falling inflation and rates.
Momentum market timing had a disappointing performance in 2022. Long-short momentum performed worse than long-only due to a regime change. Going forward, these momentum strategies pose higher risks than strategic allocations if the regime change persists. In addition, in the case of an extended consolidation in the stock market, momentum strategies can generate significant losses of up to 50% depending on the duration.
Finally, although some momentum strategies may have performed better due to a “lucky” choice of the moving average period, the same values may fail to perform well in the future. The randomness resulting from parameter value selection is one reason these strategies are often considered inferior to strategic allocations.
Be the first to comment