

da-kuk
It’s been about five and a half months since I took my profits on Clearwater Analytics Holdings Inc. (NYSE:CWAN) and since then the shares have dropped about 25% against a loss of about 11.6% for the S&P 500. I have a few reasons to return to this narrative and write about this company. First, and most important by far, is that doing so gives me a chance to brag, and I never want to pass up such an opportunity. Second, I’m obviously comfortable taking a long position here, and a stock trading at $15.80 is, by definition, less risky than the same stock when it’s trading at $21. I want to work out whether or not it makes sense to buy again by reviewing the most recent financial performance, and by looking at the stock as a thing distinct from the underlying business. Finally, the puts I sold way back in February are about to expire, and I’m champing at the bit to write about that trade, too. I’ll be writing about it because it’ll give me yet another opportunity to brag, but you may gain some insight about the risk reducing, yield enhancing potential of short puts as an unintended consequence.
I can imagine that the opening paragraph of this article has induced some eye rolling from the readership. I admit that there are few things worse than a braggart, and I’ve bragged twice already, so it may get tiresome. This is one of the reasons why I write thesis statement paragraphs for the readers. It gives them a chance to get into the article, learn my perspective, and then get out before they are exposed to too much of my odiousness. You’re welcome. Anyway, while I appreciate the fact that the shares are cheaper, they’re not cheap enough to buy in my estimation. Revenue has increased nicely, but net income has dropped precipitously. I would remind readers that owners of businesses aren’t compensated by revenue. We’re compensated by whatever’s left over after employees, suppliers, various governments, bond holders etc. are paid. Thus, rising sales are great, but net income pays the bills. That said, the capital structure is incredibly strong, and I’d be willing to buy at the right price. Finally, the puts I wrote previously have done well, but they remain technically unprofitable in spite of the fact that they’re about 23% out of the money and have one week before they expire. I consider puts to be powerful investments for reducing risk and enhancing returns, but I think investors should be aware of these potential eccentricities. I’d be happy to buy Clearwater again at the right price. Unfortunately, we’re far above that price at the moment.
Financial Snapshot
I’d characterise the most recent financial results here as “troublesome.” Although revenue and gross profit were about 22.4% and 16.2% higher during the first six months of 2022 relative to the same period a year ago, income from operations and net income fell off the proverbial cliff. The reason for this relates to the fact that the growth in costs outstripped revenue growth by a wide margin. In particular, G&A and sales and marketing expenses were troublesome for having grown by 56% and 63% respectively. This prompts the obvious question “if growing sales doesn’t grow profits, what does?” I frequently need to remind investors that we owners are not compensated by revenue, but by whatever’s left over after every employee, supplier, and government is paid.
It’s not all bad news over at Clearwater, though. Specifically, the capital structure remains very strong. Specifically, there’s about $2.75 of cash and equivalents for every $1 of liabilities at the firm. This suggests to me that the company has the capacity to sustain continuing losses for quite a long while. For this reason, I’d be willing to take another speculative position in this company at the right price.
Clearwater Analytics Financials (Clearwater Analytics investor relations)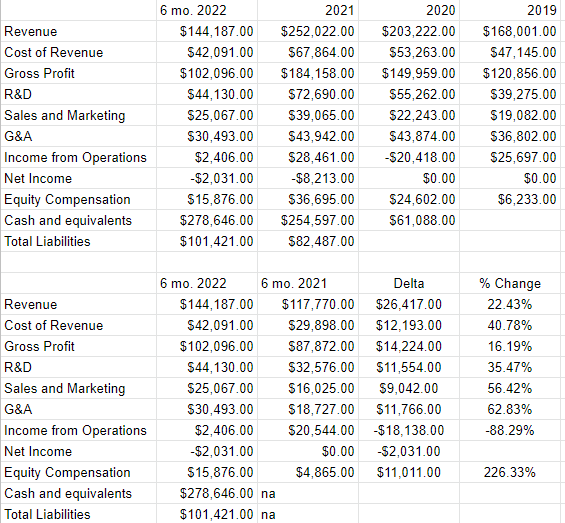
The Stock
If you read my stuff regularly you know what time it is. It’s the time where I turn into a bit of a financial “hall monitor”, where I remind everyone that a company is distinct from its stock. The company buys inputs and sells them hopefully eventually at a profit. In the final analysis, that’s all any company is. The stock, on the other hand, is a piece of paper that gets traded around in a public market and is influenced by a great many factors, many of which are only peripherally related to the underlying business. For instance, the stock price is certainly impacted by the company’s recent financial performance. It’s also impacted by the crowd’s ever-changing views about the company’s future financial performance. It’s also potentially impacted by the changing moods of an influential analyst. Finally, the stock is influenced by the crowd’s ever-changing perspectives on the relative merits of “stocks” as an asset class. To use this stock as an example, the market lost 11.5% of its value during the time the stock lost 25% of its value. It’s impossible to prove this definitively, but I think it’s reasonable to suggest that part of this 25% loss is a function of softness in the overall market. For all of these reasons, the stock is a much more volatile thing than the underlying business. While this is tiresome, it is potentially profitable. If we can spot the discrepancies between the crowd’s take on a given business, and the assumptions embedded in the price, we can earn a profit.
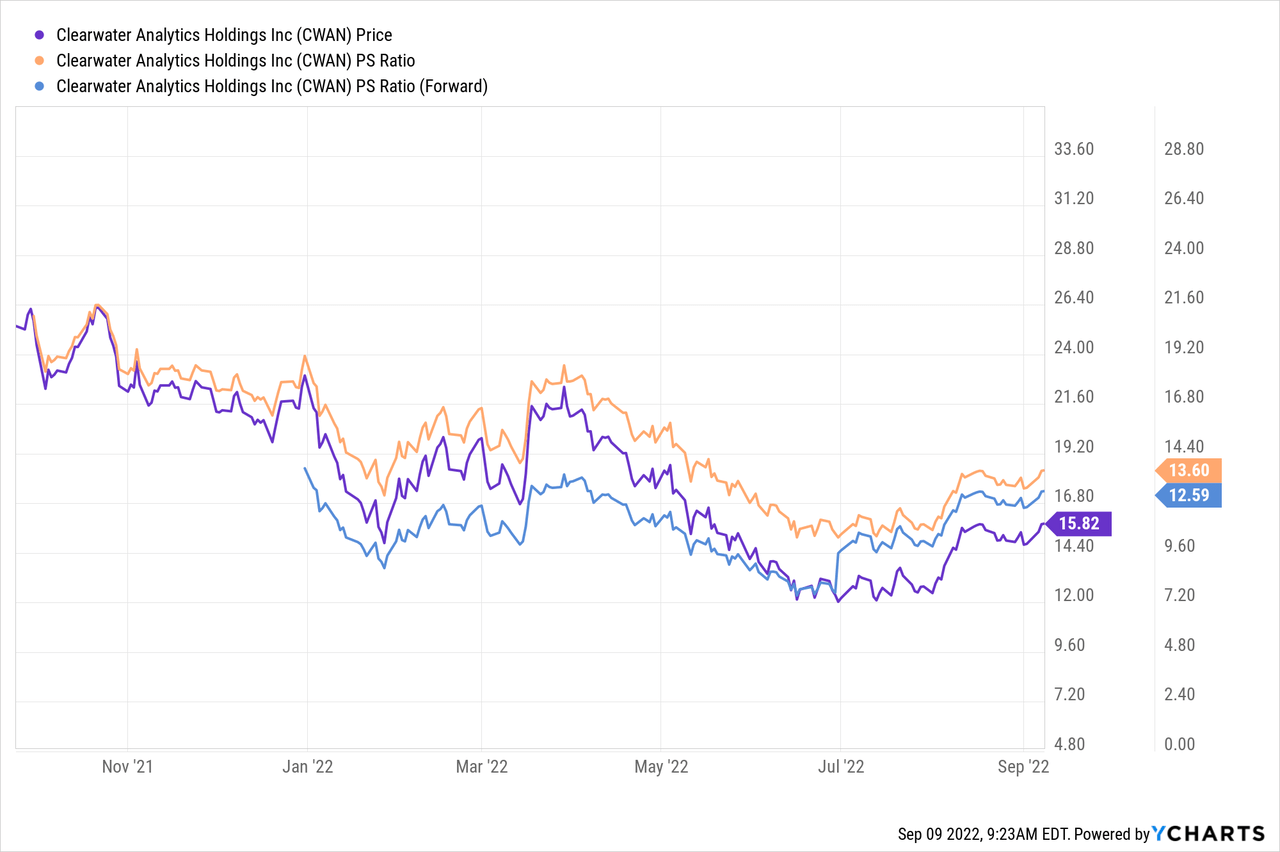
Finally, I’ve found that cheaper stocks offer a higher risk-adjusted return, so I like to buy shares when I consider them to be cheap and eschew them when they get expensive. If you’re one of my regular readers/victims you know that I measure the cheapness (or not) of a stock in a few ways, ranging from the simple to the more complex. On the simple side, I look at the ratio of price to some measure of economic value like sales, earnings, free cash flow, and the like. Ideally, I want to see a stock trading at a discount to both its own history and the overall market. In my previous missive, I took profits here because the price to sales ratio hit 16.8 and the forward price to sales hit 12.5 times, both of which were about 25% more expensive than when I went long the stock. Fast forward to the present and this is the current state of the world:
Source: YCharts
Although the shares are cheaper now than when I abandoned the name, they’re not objectively cheap in my estimation.
If you’re one of my regulars, you know that in addition to looking at simple ratios, I want to try to understand what the market is currently “assuming” about the future of a given company. If you read me regularly, you know that I rely on the work of Professor Stephen Penman and his book “Accounting for Value” for this. In this tome, Penman walks investors through how they can apply the magic of high school algebra to a standard finance formula in order to work out what the market is “thinking” about a given company’s future growth. This involves isolating the “g” (growth) variable in a fairly standard finance formula. Some people have complained that Penman is a bit dense for them. Another great introduction to this idea of using the stock price itself as a rich source of information to work out expectations is “Expectations Investing” by Mauboussin and Rappaport. The duo has recently written an update, and it is excellent in my estimation.
Anyway, applying this approach to Clearwater at the moment suggests the market is assuming that this company will grow at about 9%, which I consider to be very optimistic. Given all of the above, I can’t recommend buying back in yet.
Options Update
Way back in February, in addition to buying shares I sold 10 of the September puts with a strike of $12.50 for $0.50 each. I considered this 4% return on deep out of the money puts to be a very good risk adjusted return. Although I took a paper loss on these as the shares fell below $12.50, I was never exercised and the probability is very high that they’re about to expire worthless. This should give us a sense of what to expect from short put options. Their price movements can be volatile, especially if they’re thinly traded. In fact, they last traded hands at $0.90, so I’m showing a loss on the puts in spite of the fact that they’re 23% out of the money and will expire in a week. In my view, it’s well for readers to remember that these can show paper losses even when the stock is well above the strike price. In the end, though, they are a powerful way to reduce risk and earn the investor some extra return. This is especially the case if the investor is willing to be exercised at the strike price.
While I’m a fan of selling put options obviously, the premia isn’t great on these at the moment and so I can’t recommend this path either. For instance, the bid on March 2023 puts with a strike of $12.50 is currently $0. The act of selling puts isn’t worth it at the moment in my view, and thus I’ve got to sit around and simply wait for shares to fall further in price before potentially buying back in.
Be the first to comment