DjelicS/iStock via Getty Images
Investment Thesis
Stanley Black & Decker Inc. (NYSE:SWK), the well-known hand and power tools company, was one of the post-pandemic high-flyers as its stock price nearly tripled from the March 2020 low of $75. However, fears of a recession, a weakening housing market and ongoing supply chain disruptions led to a 50% decline since May 2021. As a result, SWK is now trading at a non-GAAP P/E ratio of below 11, well below its historical median of 18. The company is a dividend king with 54 years of dividend increases, meaning Stanley has been able to increase its dividend during eight recessions, starting with the 1969 to 1970 recession and including the brief recession in 2020.
This article follows on from my previous article in which I explained why I personally do not consider the recent earnings restatement to be too problematic, although I realize that the event could continue to weigh on the share price and has likely impaired trust in management. However, as a dividend-oriented investor, I don’t mind an extended period of stagnant share prices, as I can then buy shares without haste. Such periods often lead to above-average returns if growing dividends are consistently reinvested, as Prof. Siegel explains in his highly recommended book, “The Future for Investors: Why the Tried and the True Triumphs Over the Bold and the New.” Stanley definitely fits the bill of “Tried and True”, as it is an industrial company which roots date back to 1843.
In this article I want to share with you why I finally got around to investing in this company. I bought my first tranche when the stock dropped to $100 a few weeks ago, and I plan to add to my position in the coming months. However, Stanley will not become a core position in my portfolio – in part because of the earnings restatement and related deficiencies in internal controls, but also for other reasons discussed in this article.
Company Overview
Stanley Black & Decker is a diversified global manufacturer of hand tools, power tools, outdoor products and related accessories, engineered fastening systems and products, services and equipment for oil & gas and infrastructure applications, and automatic doors. The company operates through two segments, Tools & Storage ((T&S)) and Industrial. Stanley’s T&S segment consists of the Power Tools Group, Hand Tools, Accessories & Storage, and Outdoor Power Equipment businesses accounted for nearly 84% of SWK’s sales in 2021. Understandably, the Industrial segment is pretty cyclical and its operating margin is also weaker (10% in 2021, compared to 15% for the T&S segment). The Industrial segment had an operating margin of almost 14% before the outbreak of the pandemic, but its performance has already started to recover.
SWK is relatively focused on the U.S., where it generated 60% of its 2021 sales, while Europe, emerging markets, Canada and other regions accounted for 17%, 14%, 5% and 4%, respectively. Sales in emerging markets grew in line with global sales, as the segment already accounted for 14% of sales in 2018. Stanley’s tools face significant competition from well-known competitors such as Bosch, Makita, more specialized brands, as well as private label brands from home improvement retailers such as Lowe’s (LOW) and The Home Depot (HD). The two retailers are also important customers of SWK, with a sales contribution of 15% (down 2% YoY) and 15% (up 1% YoY), respectively, in 2021.
Growth & Profitability
Figure 1 shows Stanley Black & Decker’s sales performance since 2006 and includes the most recent analyst consensus estimate for 2022. SWK has grown its top-line at a compound annual growth rate (CAGR) of more than 6% over the past decade. Since 2006, the company has grown sales at a CAGR of more than 10%. I think this is a great performance for a company that sells mostly products that are typically not replaced very often. During the Great Recession, sales declined 1% in 2008 and 16% in 2009. Operating profit declined by 29% and 9%, respectively, during those years, confirming that SWK is indeed a fairly cyclical company with considerable operating leverage.
It should be borne in mind that the company’s strong sales growth is partly due to SWK’s growth strategy of acquiring other companies from time to time. For example, The Stanley Works (SWK’s former name) acquired Black & Decker in 2009/10, adding not only the well-known power tool brand to the portfolio, but also Black & Decker’s professional range sold under the DeWalt brand. Recent acquisitions include the remaining 80% stakes in MTD Holdings Inc. and Excel Industries, which establish SWK as the world’s leading supplier of outdoor products and complement its position as the fastest growing supplier of cordless power tools for outdoor use. Given the increasing importance of non-petrol-powered gardening tools, I consider these acquisitions to be very smart and timely.
Figure 1: Stanley Black & Decker’s net sales since 2006 (own work, based on the company’s 2007 to 2021 10-Ks and the 2022 consensus sales estimate as published on Seeking Alpha)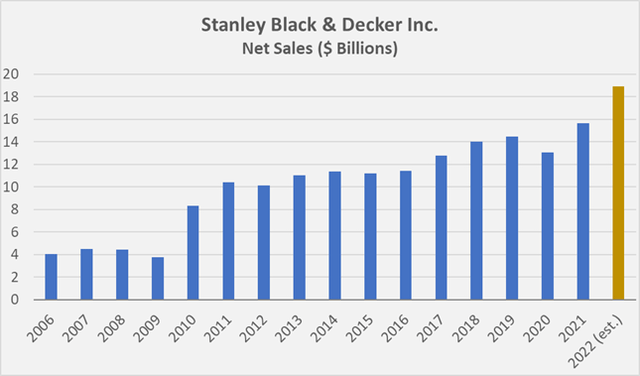
SWK also sells underperforming or out-of-fit assets from time to time, most recently its security business to Sweden’s Securitas AB (OTCPK:SCTBF, OTC:SCTBY) for $3.2 billion in cash. Personally, I view this divestiture positively, as it leaves SWK as an industrial company focused on hand and power tools, apart from its automatic doors business which was not part of the deal.
Stanley’s growth model entails the risk of impairment charges, as acquisitions sometimes prove less profitable than originally planned. Besides impairments, restructuring-related charges are also regularly recorded (Figure 2). Restructuring and impairment charges are certainly significant, amounting to nearly $1.4 billion since 2006, compared to $8.1 billion the company spent on acquisitions during those years (i.e., 17%).
Figure 2: Stanley Black & Decker’s restructuring and impairment charges since 2006 (own work, based on the company’s 2007 to 2021 10-Ks)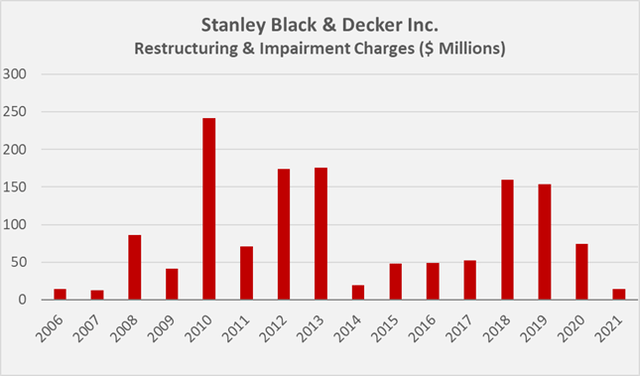
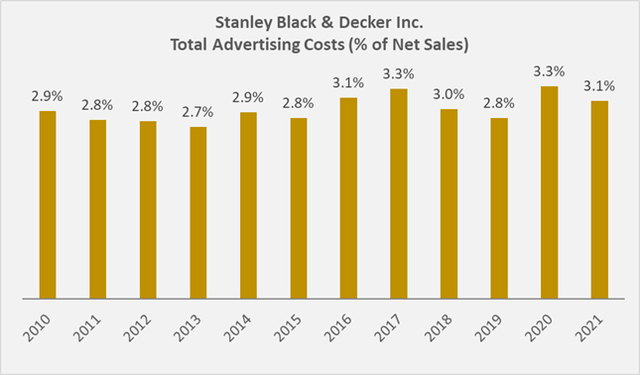
While impairment and restructuring costs are certainly not insignificant, the company has nevertheless managed to grow operating profit even faster than sales (10- and 15-year CAGRs of 7.4% and 11.5%, respectively). This performance can be attributed to the gradual reduction in selling, general and administrative ((SG&A)) expenses (Figure 3). It could be hypothesized that SWK is underinvesting in advertising, but this seems unlikely given its strong sales growth (which is, of course, partly due to SWK’s pronounced M&A activity). However, as shown in Figure 4, SWK continues to invest responsibly in advertising.
Figure 3: Stanley Black & Decker’s selling, general & administrative expenses since 2010 in % of net sales (own work, based on the company’s 2011 to 2021 10-Ks) Figure 4: Stanley Black & Decker’s advertising costs since 2010, in % of net sales (own work, based on the company’s 2011 to 2021 10-Ks)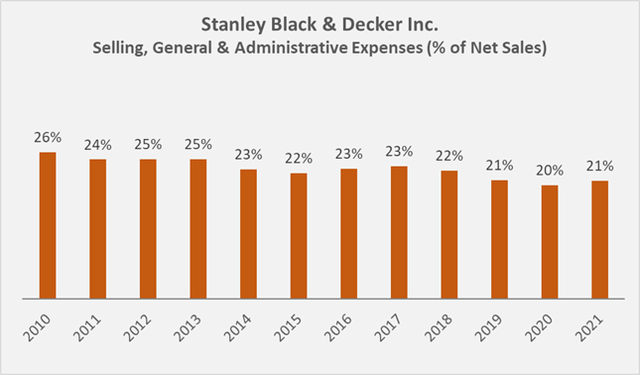
While SWK’s sales and earnings growth is certainly very healthy, the company is not overly profitable, as underscored by its ROIC (based on net operating income after tax) and CROIC (based on normalized free cash flow), which at times are equal to or below the company’s weighted average cost of capital (WACC, based on a 7% risk premium). It should be noted that the comparison with WACC is not entirely correct in an academic sense, as profitability ratios based on free cash flow should be compared with the cost of equity. In this way, SWK’s relatively weak CROIC looks even worse.
Figure 5: Stanley Black & Decker’s (cash) return on invested capital and its weighted average cost of capital based on a 7% equity risk premium (own work, based on the company’s 2011 to 2021 10-Ks)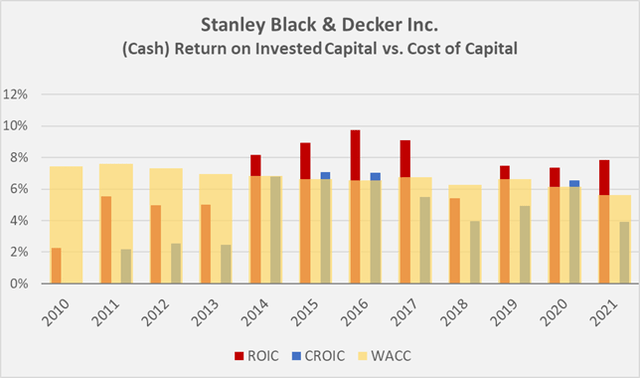
In addition to improving acquisitions and integrating acquired businesses (i.e., reducing restructuring costs and avoiding impairments), Stanley could likely increase its CROIC through better working capital management. Days sales outstanding declined from more than 50 days in the early 2010s to 32 days in 2021, and inventory days increased from about 70 days to 142 days. The company was partially able to mitigate these effects by extending payment terms with its suppliers, as evidenced by a more than two-fold increase in days payables outstanding. It should also be noted that 2021 was an exceptional year in which many companies had to significantly increase their working capital (especially inventories), and SWK is no exception, with cash flow related to increasing inventories of nearly $2 billion. Note, however, that the weak CROIC in 2021 is only marginally due to this effect, as I have normalized free cash flow with respect to working capital movements.
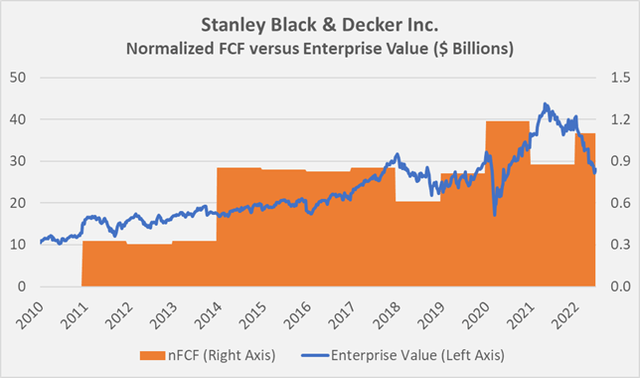
All of this sounds quite negative, but it seems worth noting that SWK remains a company with relatively strong normalized free cash flow ((nFCF)), which it has been able to grow at a 10-year CAGR of more than 11%. An illustration of SWK’s nFCF relative to its share price and enterprise value can be found at the end of this article in Figures 8 and 9. Note that restructuring and impairment charges and stock-based compensation expenses have been deducted from the calculations. Speaking of which, I personally consider SBCs relatively material at SWK, at typically around 10% of pre-compensation nFCF. Anyone interested in the topic and a comparison with several other companies should read my recent article.
Financial Stability And Dividend Safety
Particularly for cyclical industrial companies, I believe a solid balance sheet is a prerequisite for sound long-term investing. Stanley has maintained a relatively low interest coverage ratio over the past decade, at typically three to six times pre-interest nFCF. During a recession, the coverage is understandably even weaker, but I consider the fact that Stanley is an A-rated company and has been able to increase its dividend during several recessions to be an important indicator of long-term financial stability. In 2008 and 2009, the company increased its dividend by 3% per year, in line with previous years. I can imagine that SWK will continue to increase its dividend even in the event of an upcoming recession (with an associated significant decline in free cash flow), as the company’s payout ratio in relation to nFCF is typically around 50%. However, given the current share repurchase program and the likely onset of a recession, I expect near-term dividend growth to be below the 2006-2021 average growth rate of 6%.
Stanley’s upcoming debt maturities according to the 2021 10-K are very reassuring as just over $2 billion of the company’s long-term debt mature over the next ten years (Figure 6). Therefore, the company appears to be reasonably protected against rising interest rates. At the end of 2021, SWK’s weighted average interest rate on its long-term debt was approximately 3.75%.
Figure 6: Stanley Black & Decker’s upcoming maturities of its long-term debt at the end of 2021 (own work, based on the company’s 2021 10-K)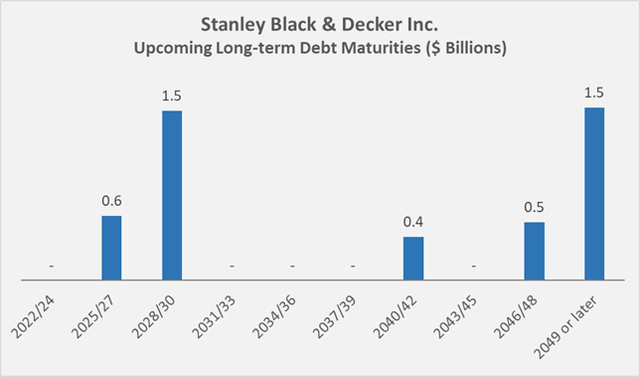
The company plans to buy back $4 billion worth of shares by 2023. While I think these buybacks are very well timed from a valuation perspective, the debt on SWK’s balance sheet has become very significant. As SWK’s short-term debt has increased from $2.2 billion at the end of 2021 to $5.1 billion at the end of Q1 2022, the company will likely refinance most of this debt over the longer term, also from the perspective of maturity matching. Therefore, SWK is certainly less protected against rising interest rates than the maturity profile of its long-term debt would suggest.
SWK’s current ratio has declined from its long-term average of 1.3 to below 0.9 in Q1 2022. The company had to increase its working capital by nearly $1.3 billion during the quarter, due to the seasonality of the business and the nature of SWK’s inventory management. Therefore, the decline should not be overinterpreted. Generally speaking, and leaving business seasonality aside, a current ratio of around 1 (or even less) is not necessarily a warning signal and is often a sign of efficient capital utilization.
I appreciate management’s good timing with respect to share repurchases (something rarely seen these days), but I nonetheless find the increase in debt somewhat concerning and hope the company can quickly refinance its short-term debt at still relatively low interest rates. After all, the current net debt is more than nine times the expected nFCF for 2022.
While this all sounds pretty negative, it seems worth noting that over the long term, SWK has not been one of those companies that has sacrificed the quality of its balance sheet through debt-fueled share buybacks. Since 2010, the company has generated nearly $8 billion in normalized free cash flow, but has only spent about $7 billion on share buybacks and dividends.
Post-retirement benefits are very manageable and amounted to $474 million, or 1.7% of total liabilities and shareholders’ equity at the end of 2021. In 2010, these liabilities were also barely worth mentioning at 4.2% of total liabilities and shareholders’ equity, but were nevertheless more significant.
Valuation
From a historical perspective, Stanley Black & Decker’s shares are certainly anything but expensive, with a P/E ratio of below 11 and an EV/EBITDA multiple of 11. Stanley’s current normalized free cash flow yield is 6%, well above the historical average of 3.4%.
The extent of undervaluation is probably best illustrated by the FAST Graphs charts in Figure 7. However, I would be cautious about over-interpreting the expected earnings growth for 2023 and 2024, as analysts’ forecast accuracy has been far from optimal in the past – after all, SWK is still a moderately cyclical company.
Figure 7: FAST Graphs chart for SWK, based on adjusted operating earnings (obtained with permission from FAST Graphs)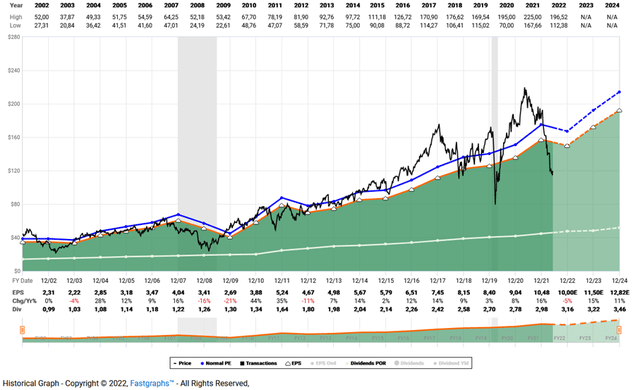
The undervaluation of the share is also reflected in Figure 8, which sets the share price in relation to normalized free cash flow per share. Figure 9 is a more conservative, but in my view also more meaningful, approach to putting SWK’s share price into perspective, as it takes the company’s entire capital structure into account. Accordingly, the extent of undervaluation appears less pronounced given SWK’s high level of debt.
SWK is not a deep-value stock, and it could still see considerable downside if we experience a prolonged recession and the company misses analysts’ quite rosy earnings estimates, but I believe the risk/reward ratio at $100 is already quite favorable.
Figure 8: Overlay of Stanley Black & Decker’s share price and normalized free cash flow (nFCF) per share; note that Stanley’s 2010 nFCF was negative (own work, based on the company’s 2010 to 2021 10-Ks and the weekly closing share price of SWK) Figure 9: Overlay of Stanley Black & Decker’s enterprise value and normalized free cash flow (nFCF); note that Stanley’s 2010 nFCF was negative (own work, based on the company’s 2010 to 2021 10-Ks and the weekly closing share price of SWK)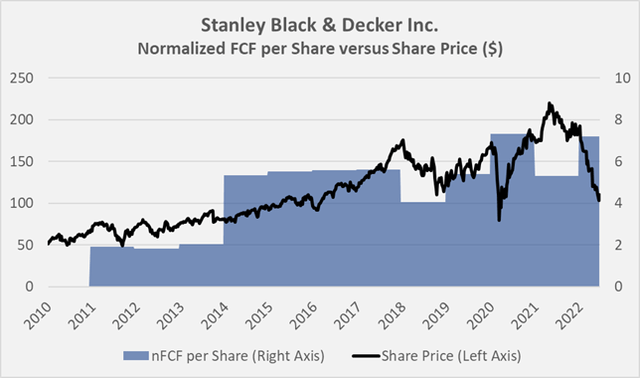
Conclusion
Stanley Black & Decker is a moderately cyclical industrial company with a portfolio of hand and power tools that will make any man’s mouth water. It is a dividend king, and given its relatively modest payout ratio and market-leading position, I don’t expect the company to break with its tradition. However, given that we are most likely approaching a recession, near-term dividend growth is likely to be in the low single digits, also in light of the recent and certainly substantial share repurchases. Stanley has pricing power, as evidenced by its relatively stable gross margin in the low 30% range. Free cash flow, as conventionally reported, is down significantly in 2021, but will recover over time as the company works down its substantially increased working capital.
The company’s dividend growth streak, which has defied eight recessions, is certainly an important indicator of Stanley’s long-term financial stability. Recently, debt has increased substantially due to unfavorable working capital movements and share repurchases. I am somewhat ambivalent about management’s opportunistic but debt-fueled share buybacks and personally would have preferred a more modest approach. I would generally like to see management improve the integration of acquired businesses – returns on capital are relatively weak and impairment and restructuring charges are the rule rather than the exception. Trust in management has been impaired by the meanwhile disclosed deficiencies in SWK’s internal control mechanisms. This are the main reasons why I do not see much near-term upside.
Stanley is a great company with a strong history, but it certainly has its weaknesses, which is why it will remain an ancillary position in my portfolio. I am in no hurry to build my position for the aforementioned reasons and because I consider it likely that the company will miss analysts’ relatively rosy estimates this year or next. As an income-oriented investor, I take a long-term view and welcome extended periods of undervaluation that allow me to build my positions without haste.
Thank you very much for taking the time to read my article. In case of any questions or comments, I’m very happy to read from you in the comments section below.


Be the first to comment