

ProfessionalStudioImages
With almost 290 million vehicles on the road in the US alone, it stands to reason that there would be significant demand for replacement parts for when things go wrong. One company dedicated to offering premium replacement parts in the maintenance, repair, and service of vehicles in the automotive aftermarket is Standard Motor Products (NYSE:SMP). Of course, the company also sells its products to other parts of the world, including parts of Central America, Europe, and Asia. And it has a variety of customers ranging from warehouse distributors, to original equipment manufacturers, and more. Recently, the market has not been particularly kind to this business. Although revenue achieved by the company continues to climb, profits have taken something of a beating. In the near term, this trend is likely to persist. But even factoring in some of the pain the company has experienced, shares don’t look to be unreasonably priced. Although I do think that the company warrants a more cautious approach than when I last wrote about it, I still do believe that it offers some upside potential moving forward. Because of that, I’ve decided to keep the ‘buy’ rating I had on it previously.
Tough times
Back in early July of this year, I wrote a bullish article discussing the prospects and potential upside of Standard Motor Products. I found myself impressed with the company’s historical track record, even though the firm was showing some minor signs of weakness so far in the 2022 fiscal year (with results only through the first quarter of the year available). Despite that minor weakness, sales growth was still impressive and shares were priced at a level that looked cheap to me. This led me to rate the company a ‘buy’, reflecting my belief at the time that shares should outperform the broader market moving forward. Since then, things have not gone as smoothly as I would have hoped. With bottom line results scaring investors, the stock has taken a beating, falling by 12.1% at a time when the S&P 500 is up by 4.6%.
Author – SEC EDGAR Data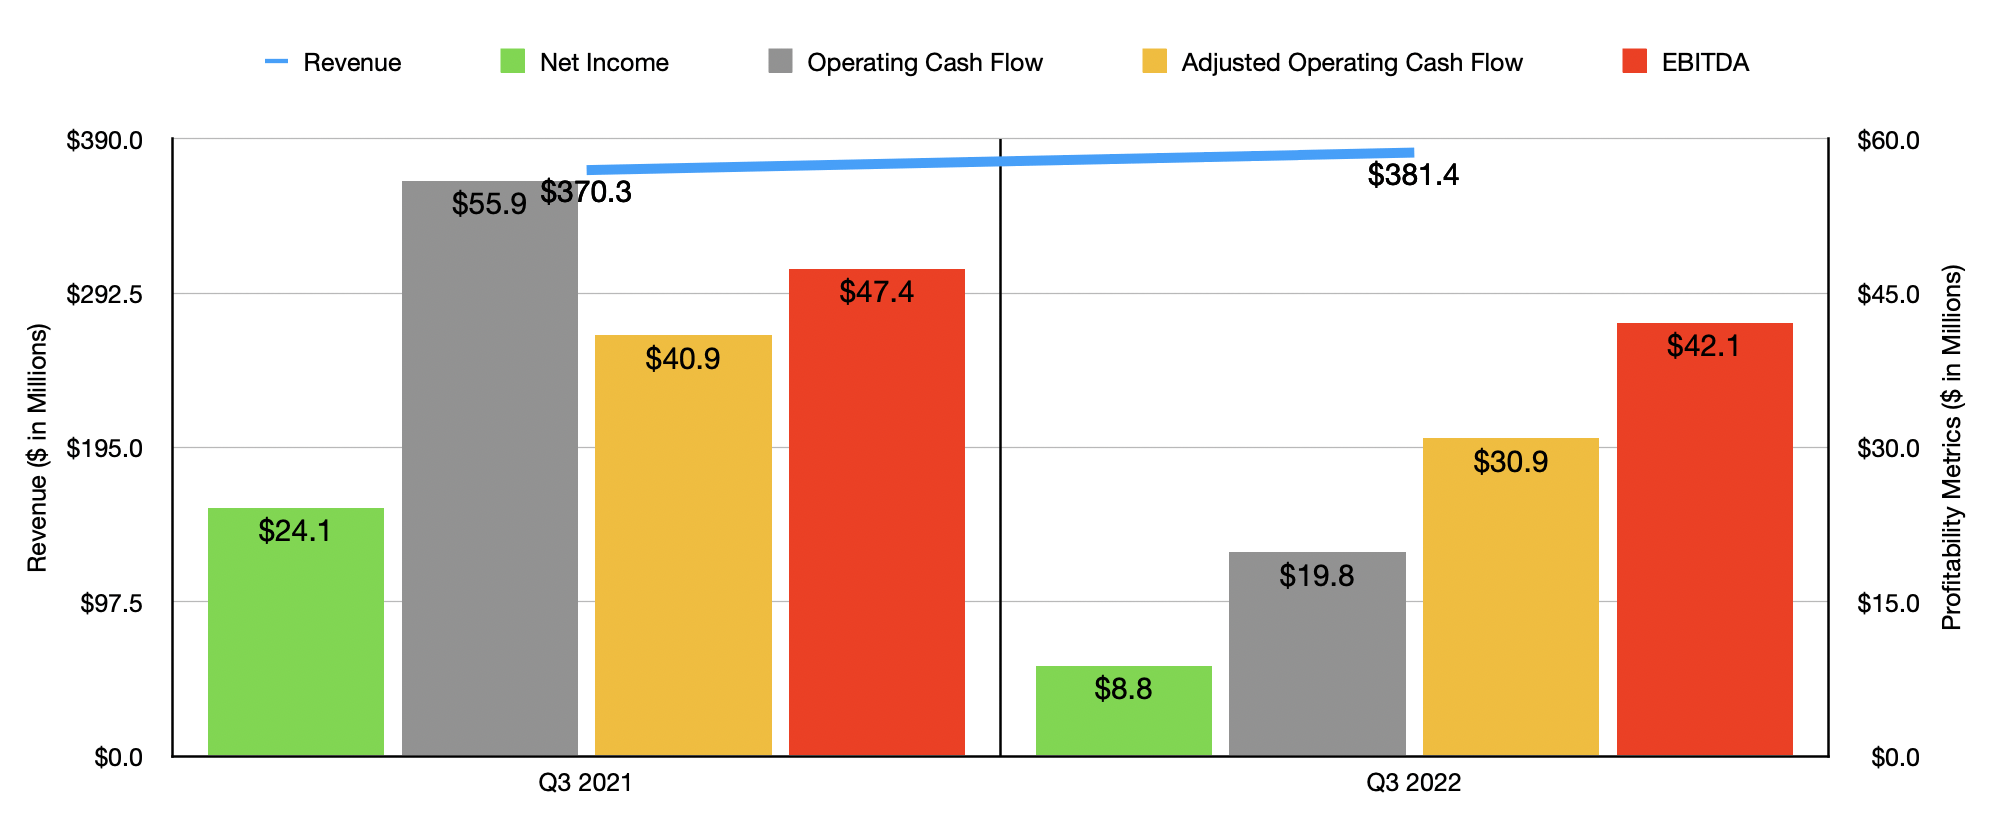
To be clear, there has been some data that has still been bullish in the grand scheme of things. For instance, looking at the third quarter of the company’s 2022 fiscal year, we can see that sales came in at $381.4 million. That’s 3% higher than the $370.3 million the company reported for the third quarter of its 2021 fiscal year. Under the Engine Management segment, sales for the company were impacted favorably by strong consumer demand and price increases implemented so far this year. Meanwhile, under the Temperature Control segment, price increases helped the company, as did strong demand that was driven by POS sales and record heat across the US.
You would think that, with sales rising, profits would follow suit. Sadly, that was not the case. Net income for the firm fell from $24.1 million in the third quarter of 2021 to $8.8 million the same time this year. Interestingly, inflationary pressures impacted the company only marginally when it came to its gross profit margin. Even though the Engine Management segment reported a decline in its gross profit margin from 27% to 26.2%, the Temperature Control segment saw an improvement in its profitability that resulted in total gross profit for the enterprise declining by only 0.4% year over year. The bigger problem related to a rise in selling, general, and administrative costs. These went from 18% of sales to 19.2%, driven by higher interest rate related costs incurred as part of the company’s supply chain financing arrangements. This makes sense when you consider that interest rates are rising because of the desire to offset inflation. It shouldn’t be much of a surprise then to know that other profitability metrics followed a similar trajectory. Operating cash flow, for starters, fell from $55.9 million to $19.8 million. If we adjust for changes in working capital, it would have fallen more modestly from $40.9 million to $30.9 million. Perhaps the most modest decline came from EBITDA, with the metric decreasing from $47.4 million to $42.1 million.
Author – SEC EDGAR Data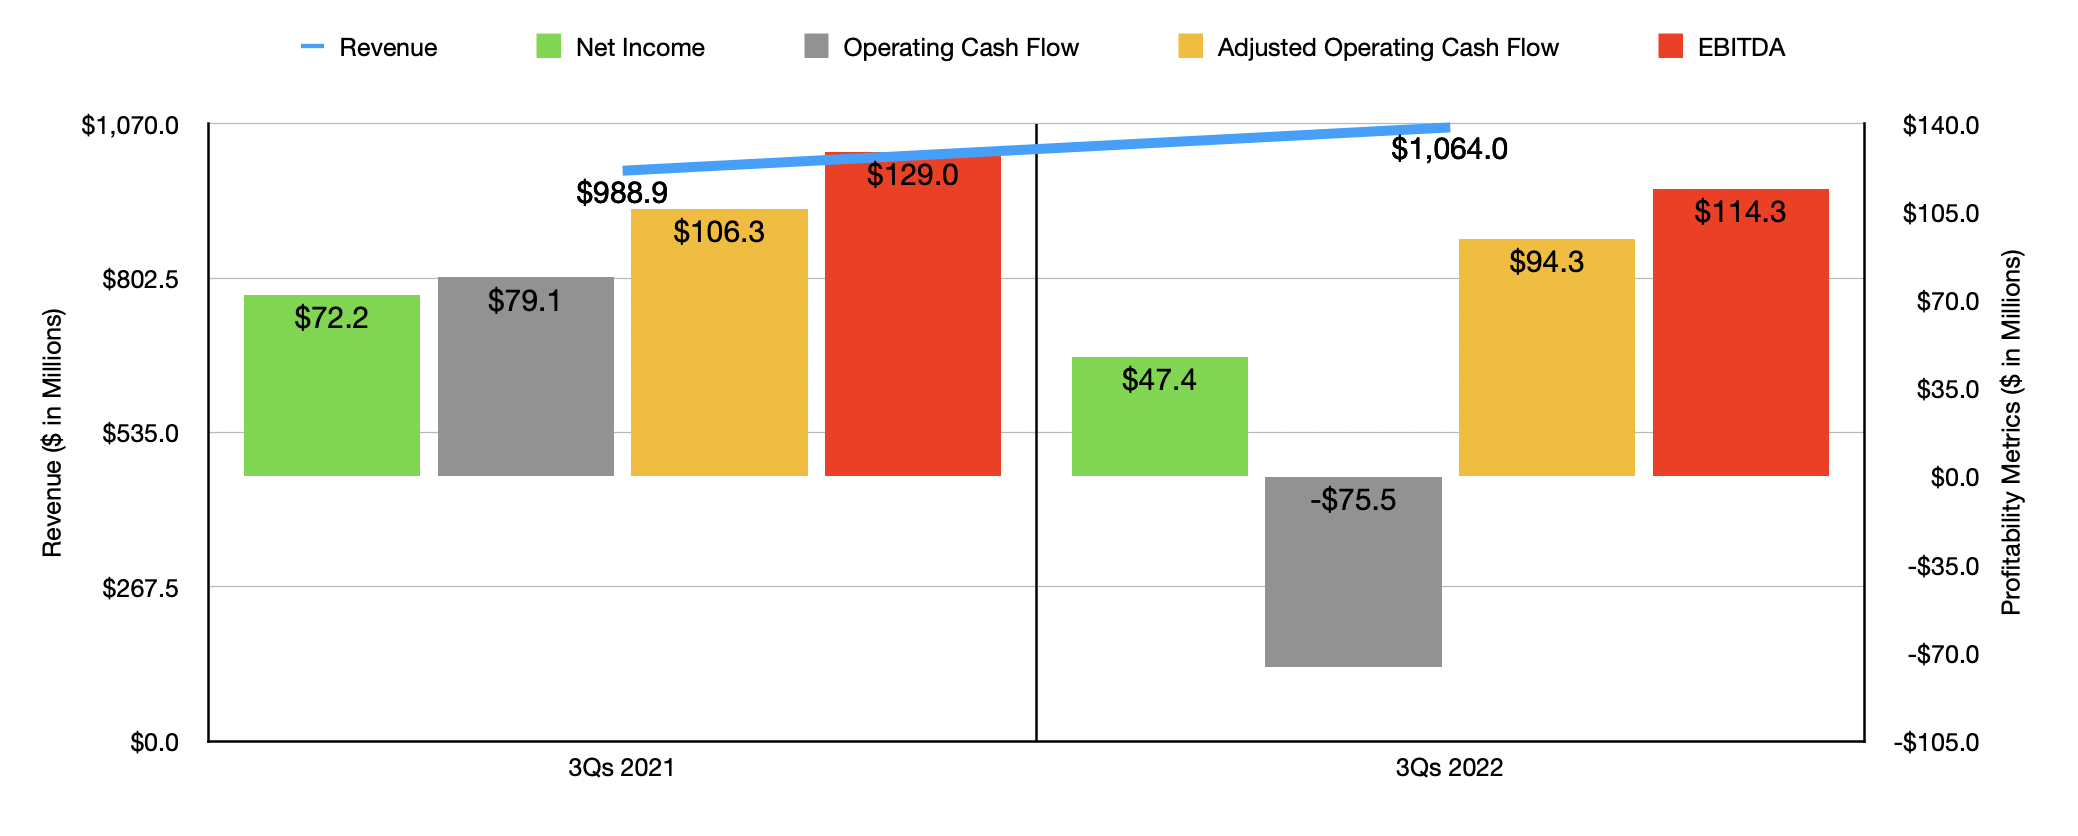
The third quarter of the 2022 fiscal year was certainly painful. But it’s not the only quarter that has been problematic. As I wrote about in my prior article on the company, results in the first quarter were only marginally lower this year than last. But the first three quarters of the company’s 2022 fiscal year as a whole have been rather painful. Yes, revenue is still climbing, with sales of $1.06 billion coming in 7.6% above the $988.9 million reported the same time last year. But as you notice, the company has seen a deceleration in revenue growth as the year has progressed. In the first quarter of this year, for instance, sales growth compared to the same time last year was an impressive 16.7%. In addition to this, profits are also down year over year. Net income has fallen from $72.2 million to $47.4 million. Operating cash flow plunged from $79.1 million to negative $75.5 million, while the adjusted figure for this dropped from $129 million to $114.3 million. Even EBITDA has fallen, dropping from $106.3 million to $94.3 million.
Author – SEC EDGAR Data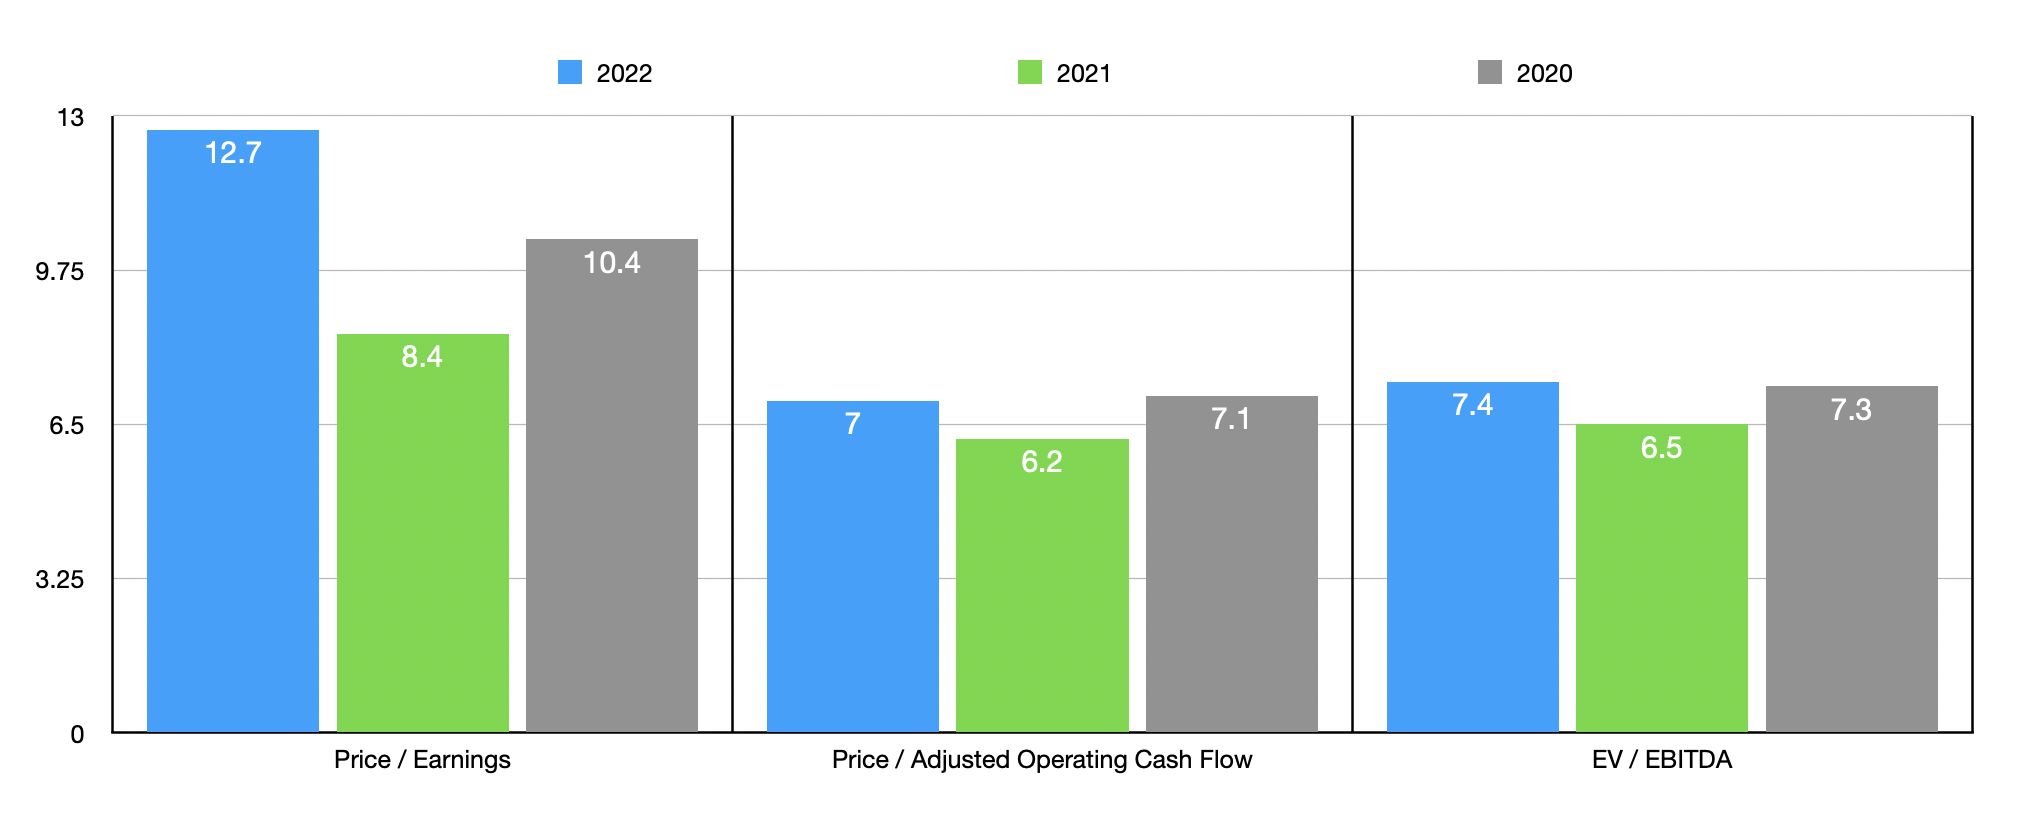
When it comes to the 2022 fiscal year in its entirety, we don’t really know what to expect. If we simply annualize results experienced so far for the year, we would anticipate net income of $65.3 million, adjusted operating cash flow of $119 million, and EBITDA of $148.7 million. These numbers would imply a forward price to earnings multiple of 12.7, a forward price to adjusted operating cash flow multiple of 7, and a forward EV to EBITDA multiple of 7.4. As you can see in the chart above, this pricing is higher than what the company saw in 2021. But with the exception of the price-to-earnings multiple, it’s nearly identical to what the company would be trading at if we used data from 2020. These numbers are not particularly high. And compared to similar companies, they are within the range of what you would expect. This can be seen in the table below, where the company is cheaper than three of its peers using the price-to-earnings approach and the price to operating cash flow approach. When it comes to the EV to EBITDA approach to valuing the firm, three of the companies are cheaper than it, while another is tied with it.
| Company | Price / Earnings | Price / Operating Cash Flow | EV / EBITDA |
| Standard Motor Products | 12.7 | 7.0 | 7.4 |
| American Axle & Manufacturing Holdings (AXL) | 1,050.0 | 2.9 | 5.6 |
| Patrick Industries (PATK) | 3.8 | 3.9 | 3.9 |
| XPEL Inc. (XPEL) | 44.8 | 224.1 | 30.4 |
| Tenneco (TEN) | 43.8 | 37.1 | 7.4 |
| LCI Industries (LCII) | 5.2 | 7.1 | 4.4 |
Takeaway
What we are seeing today is a slowing down in the growth of Standard Motor Products, coupled with declining profitability. This is clearly the result of unfavorable market conditions for the firm. In the near term, I wouldn’t be surprised to see these troubles worsen. For investors who are cautious and are not focused on the long haul, this may well be a good time to look for opportunities elsewhere. But given how cheap the stock is, even assuming a return to the levels of profitability seen in 2020, I do think that it’s a reasonable long-term ‘buy’, but one that investors should continue to monitor closely as time goes on.
Be the first to comment