

niphon
In this month’s article I outline why I am increasing my December’s allocation to the SPDR S&P 500 ETF (NYSEARCA:SPY) to 60% with the other 40% of my assets in cash. First let me review my pension plan performance in November. The market, as measured by the S&P 500 index, gained 5.38% for the month. As for my pension plan assets, I underperformed the index as my investment allocation gained 2.43%. My investment objective of preserving my capital was met as I did make money. I did not meet my second investment objective which is beating the S&P 500 index. Table 1 below shows my returns and allocations for the month of November and Table 2 below shows my returns for the past 12 months.
I have made changes to Table 2 below after I received a comment from a reader. Table 2 shows new columns to better (more accurately) reflect my investment results. The third column, $100K Hypo, is what my returns would be if I started my account with $100,000 in my first article of this series and followed the allocation recommendations from my articles. The fifth column, $100K SPY, shows the returns of just investing $100,000 and keeping it all allocated to SPY. The percentage returns in the last row show that my strategy returned a negative 8.43% for the last 12 months and simply investing in SPY would have returned a negative 9.14% for the last 12 months. Therefore, I have outperformed SPY for the last 12 months by 0.71%.
Table 1 – Investment Returns for November
Author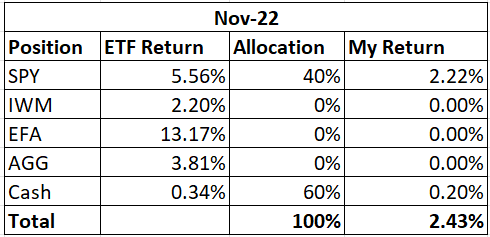
Table 2 – Investment Returns Last 12 Months
Author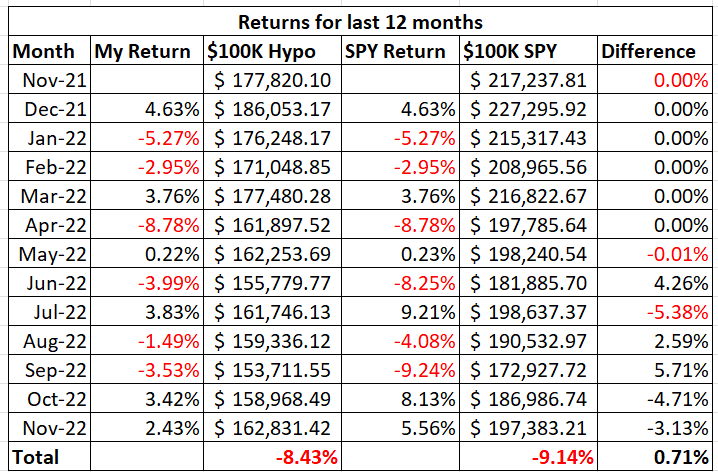
To review the purpose of this series of articles, my retirement account only allows me to buy the following four ETFs: iShares Core U.S. Aggregate Bond ETF (AGG), SPDR S&P 500 ETF (SPY), iShares Russell 2000 ETF (IWM), and iShares MSCI EAFE ETF (EFA). I can also have my money in cash. The question is how to decide where and when to allocate money to these various ETFs.
I use my moving average crossover system combined with relative strength charts to determine how to allocate my pension plan assets. My moving average crossover system uses the 6 month and the 10- month exponential moving averages to identify which of the four ETFs are in position to be bought. If the 6-month moving average is above the 10-month moving average, then the ETF is a buy. I call this setup being in bullish alignment. When the 6-month moving average is below the 10-month moving average the setup is referred to as a bearish alignment. When a bearish alignment happens, I don’t want to hold that asset. See Chart 1 below for a long-term look at the S&P 500 index using my moving average crossover system.
Chart 1 – Monthly SP 500 Index with 6/10 Moving Averages
www.stockcharts.com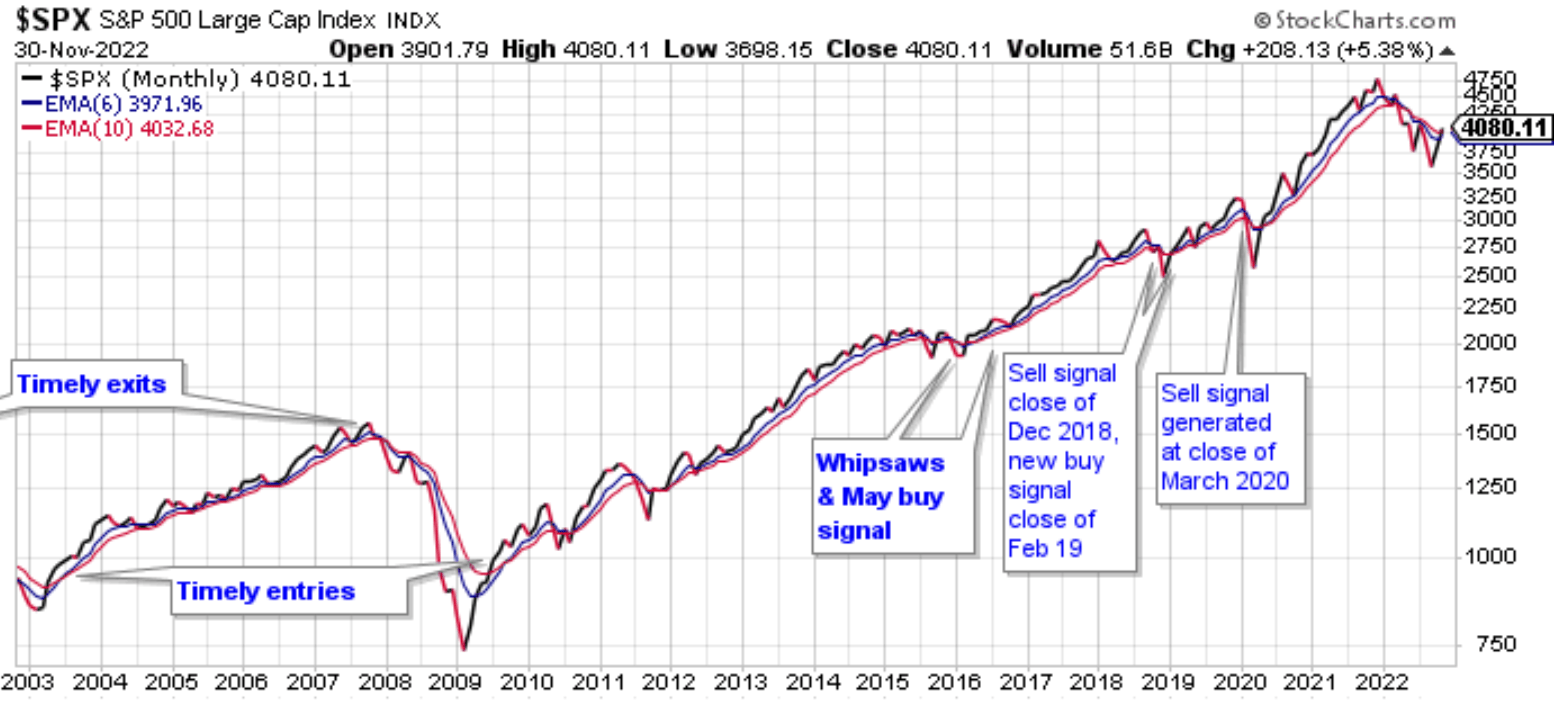
You can see that the moving average crossover system provided some excellent long term buy and sell signals that would have allowed investors to capture long duration moves in the index; while avoiding costly drawdowns. Avoiding these costly drawdowns allows me to meet the objective of capital reservation.
I employ this strategy because I do not want to experience a large drawdown with my pension assets. During the 2008 – 2009 market crash many people didn’t even look at their retirement statements because they were afraid of what they would find. I submit that if those people would have used a market strategy like what I outline in this series of articles, they would have been able to avoid much of the decline during the bear market and consequently would have had less emotional stress during that time period.
The following charts show the current status of the ETFs that I am allowed to buy in my retirement account.
Chart 2 – Monthly SPY with 6/10 Moving Averages
www.stockcharts.com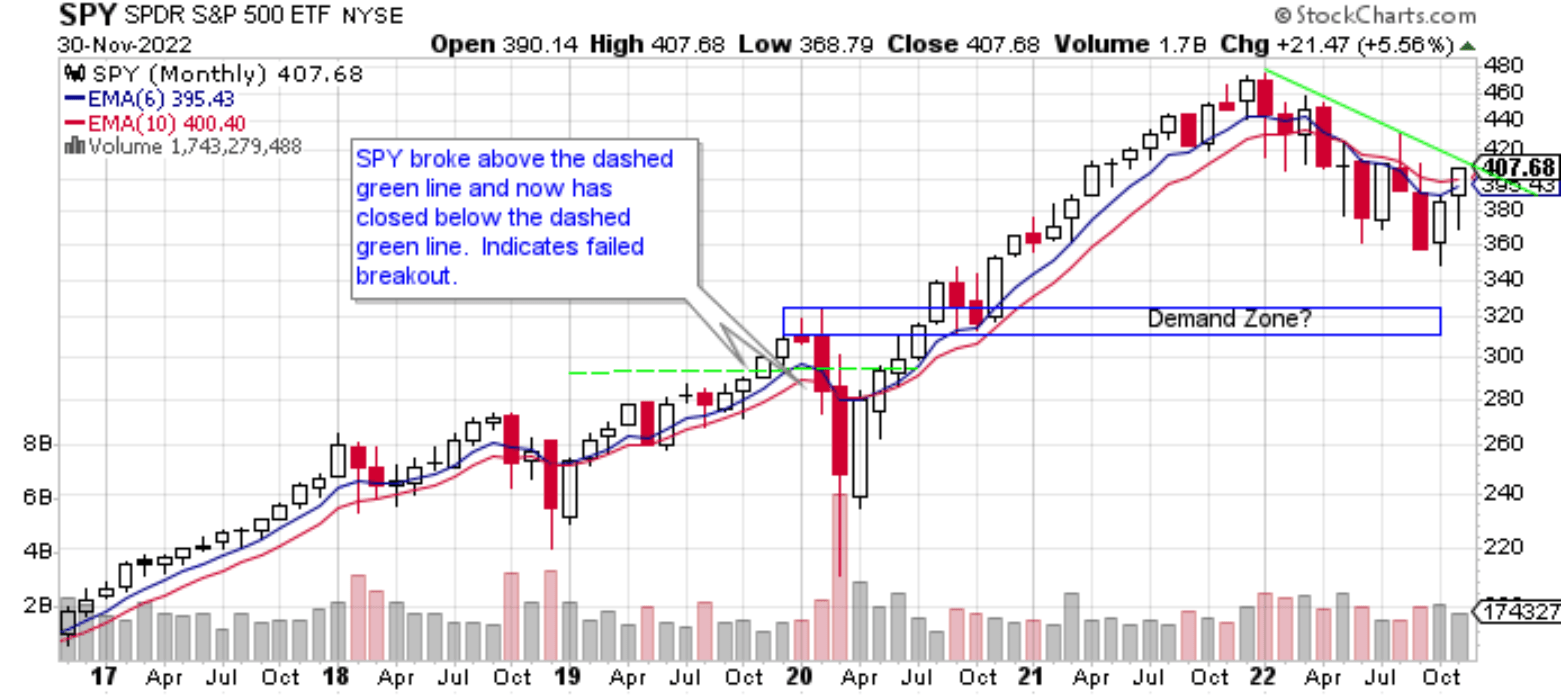
Chart 2 shows that SPY had a nice gain of 5.56% in November. Volume was less than last month. SPY closed the month at the high of its range. This is a very bullish candle. With that bullish candle, SPY closed above its red 10-month moving average. That is the first time that has happened since early this year. Even though SPY has had two strong months in a row, SPY still hasn’t reached bullish alignment yet because the blue 6-month moving average is still below the red 10-month moving average. I respect the fact that SPY closed above the red 10-month moving average. Because of that, I will increase my exposure to SPY to 60%. The remaining 40% of my retirement assets will remain in cash. That is because the 6-month moving average is still below the 10-month moving average. Once those two moving averages get in bullish alignment, I will consider increasing my exposure in SPY to above 60%. That development could happen next month as we are in the seasonally bullish period for the stock market.
Chart 3 – Monthly IWM with 6/10 Moving Averages
www.stockcharts.com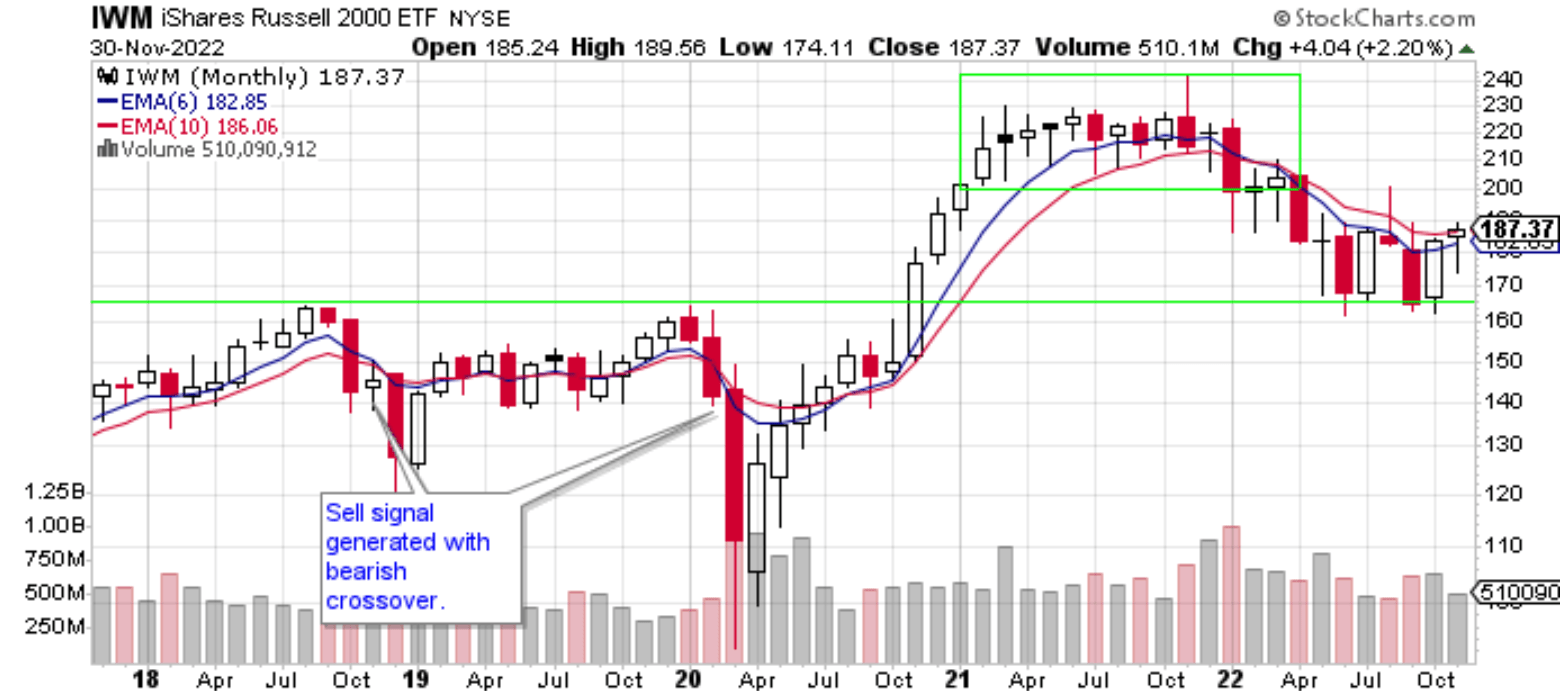
Chart 3 shows that small cap stocks gained 2.20% in November. Volume was less than the previous month. Like SPY above, IWM closed above its red 10-month moving average. IWM is not in bullish alignment as the blue 6-month moving average is still below the red 10-month moving average. We will see if this close above the 10-month moving average leads to a long-term rally in IWM.
Chart 4 – Monthly IWM:SPY Relative Strength
www.stockcharts.com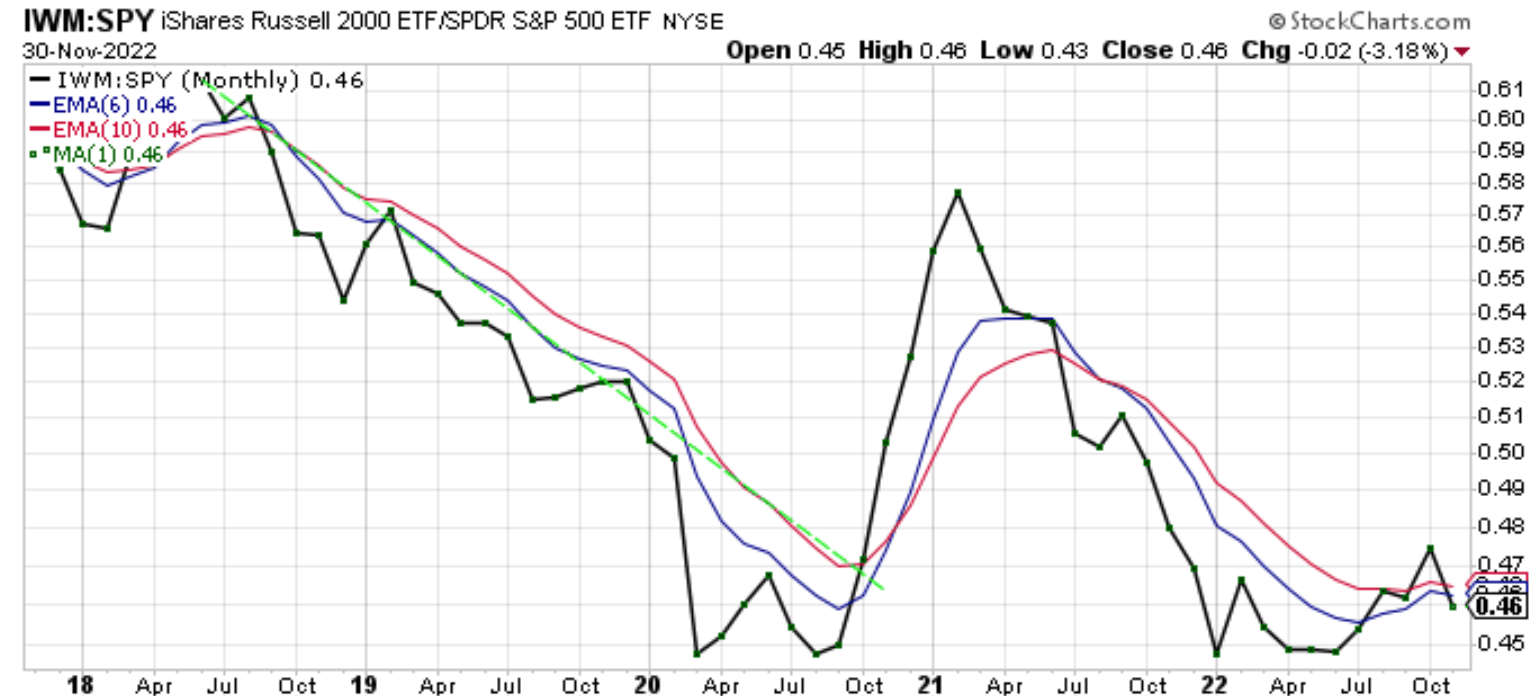
Chart 4 shows that the IWM:SPY ratio is perhaps bottoming. With the underperformance of IWM to SPY in November I am interested to see if the recent bottom in June holds. The fact that the IWM:SPY ratio lost 3.18% in November is the reason I am not allocating money to IWM as the ratio remains in bearish alignment.
Chart 5 – Monthly EFA with 6/10 Moving Averages
www.stockcharts.com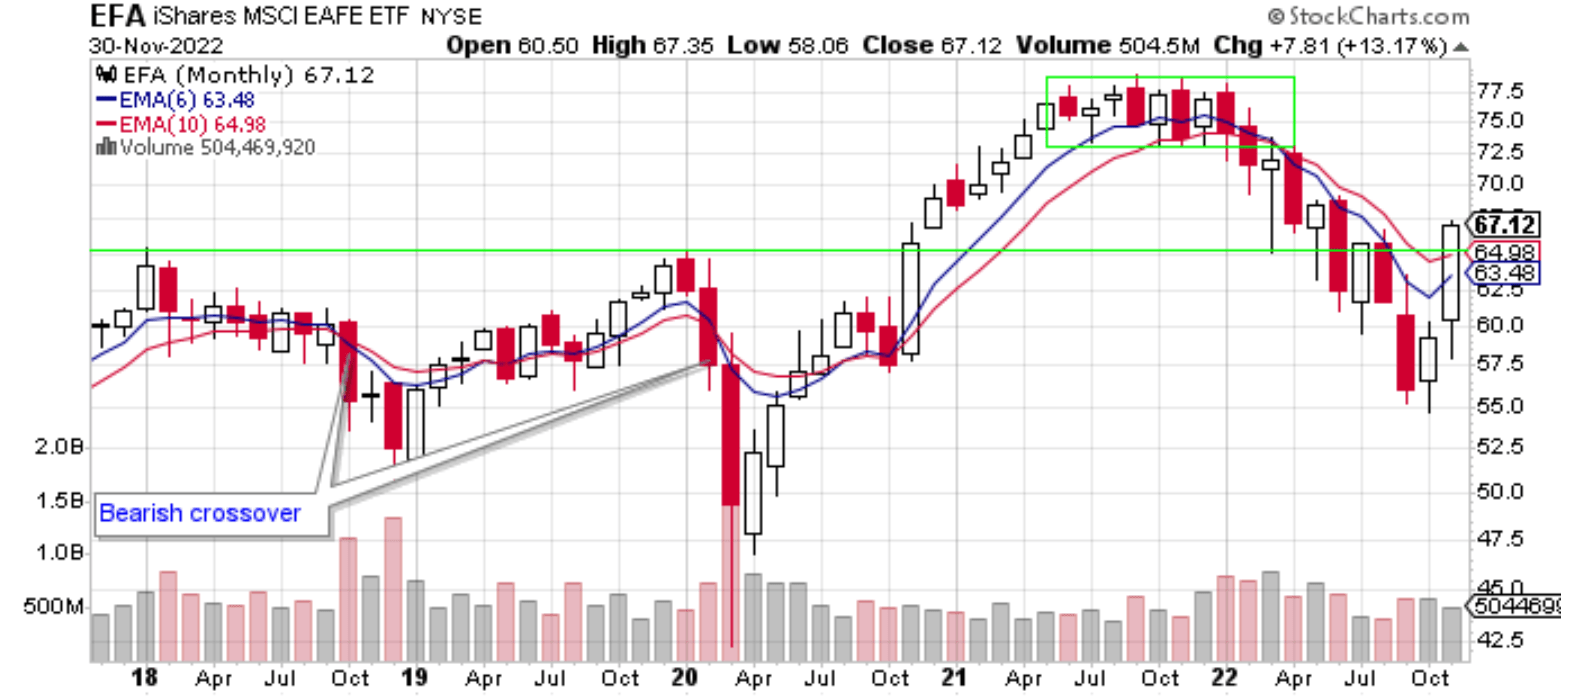
Chart 5 shows that EFA gained 13.17% in November. Congratulations to people holding EFA. Like the other equity ETFs above, EFA traded on lower volume and managed to close above its red 10-month moving average in November. Another bullish development for EFA is that it closed back above the green horizontal trendline. I am interested to see how EFA performs in December.
Chart 6 – Monthly EFA:SPY Relative Strength
www.stockcharts.com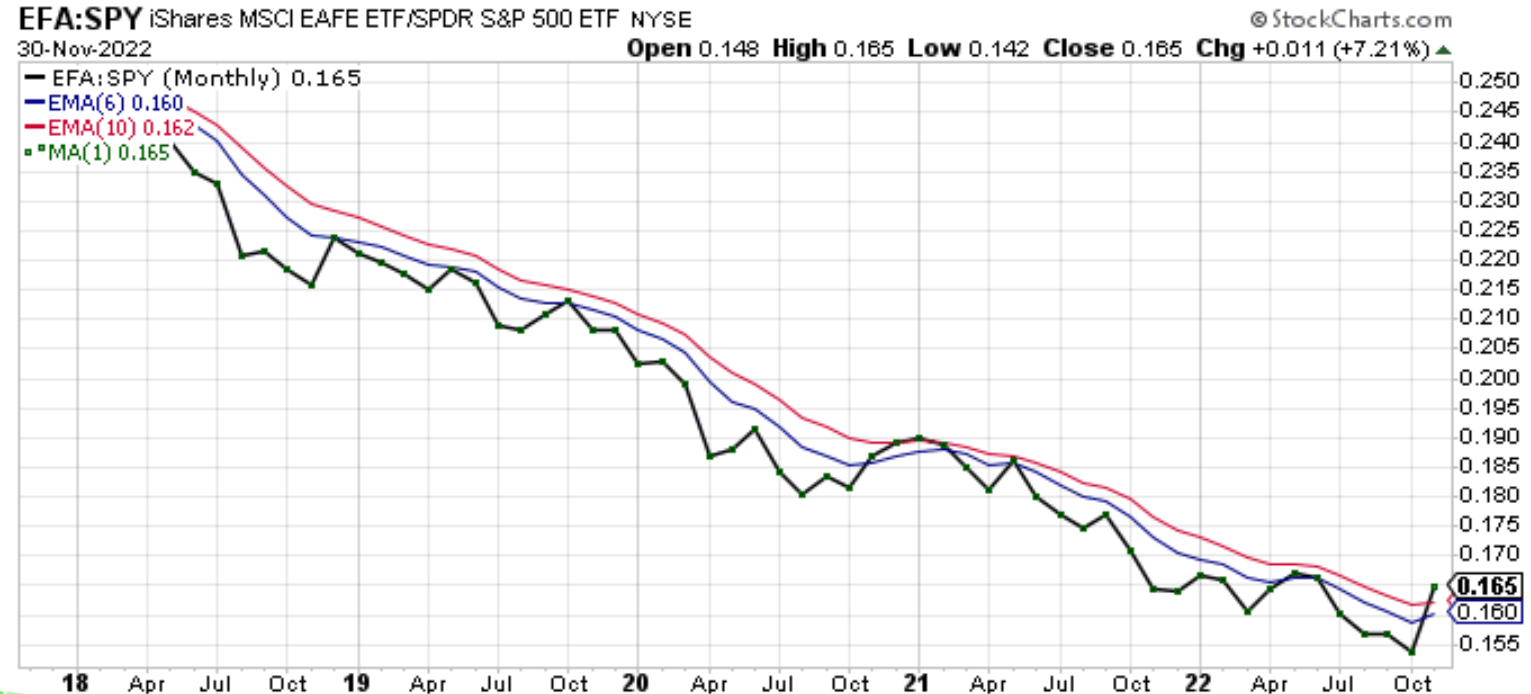
Chart 6 shows that the EFA:SPY ratio made a large gain in November. The ratio reclaimed its blue 6-month and red 10-month moving averages all in one month. Impressive. I am interested to see if this outperformance lasts.
Chart 7 – Monthly EFA:IWM Relative Strength
www.stockcharts.com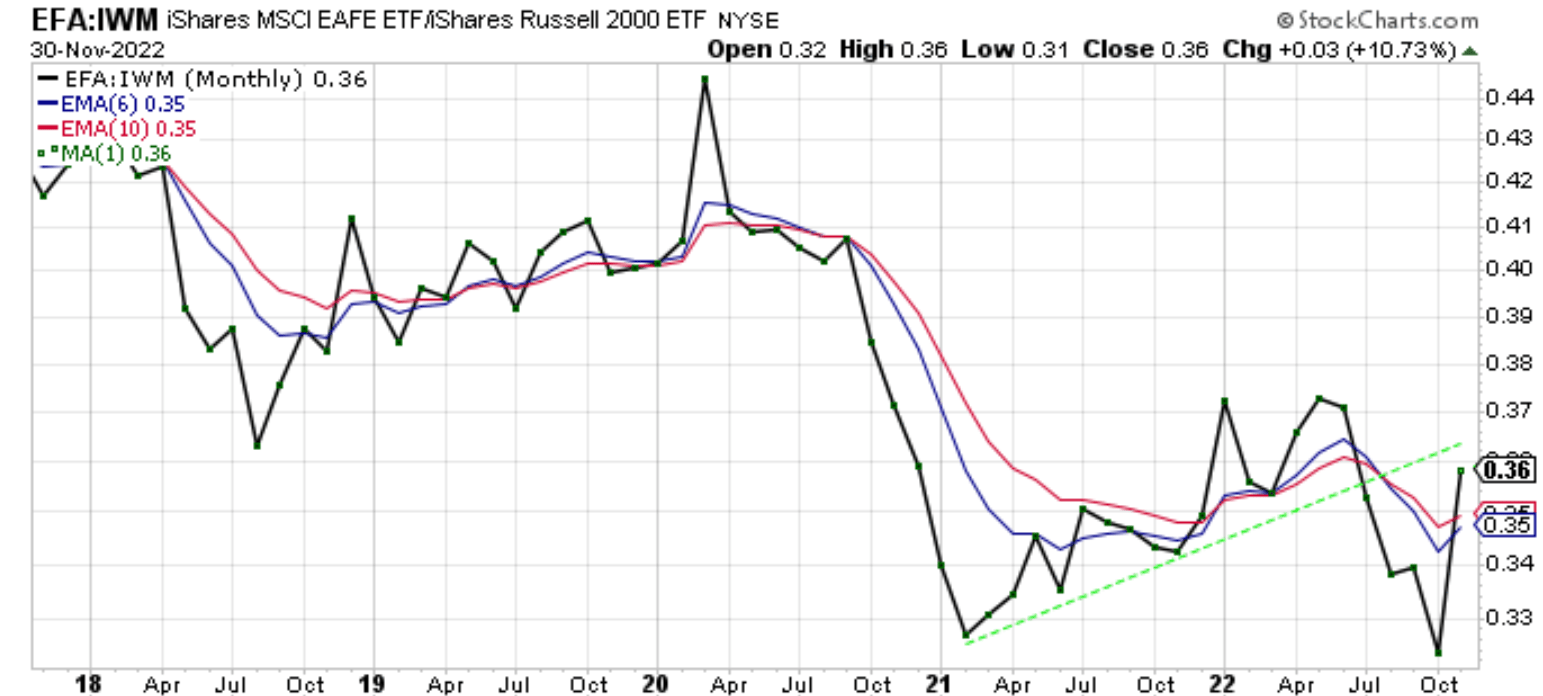
Chart 7 shows that EFA outperformed IWM in November by 10.73%. The ratio has flipped from being in bearish alignment to now being above both moving averages. Note that the ratio is still below the dotted green trendline. I will continue to watch this chart to see how events unfold.
Chart 8 – Monthly AGG with 6/10 Moving Averages
www.stockcharts.com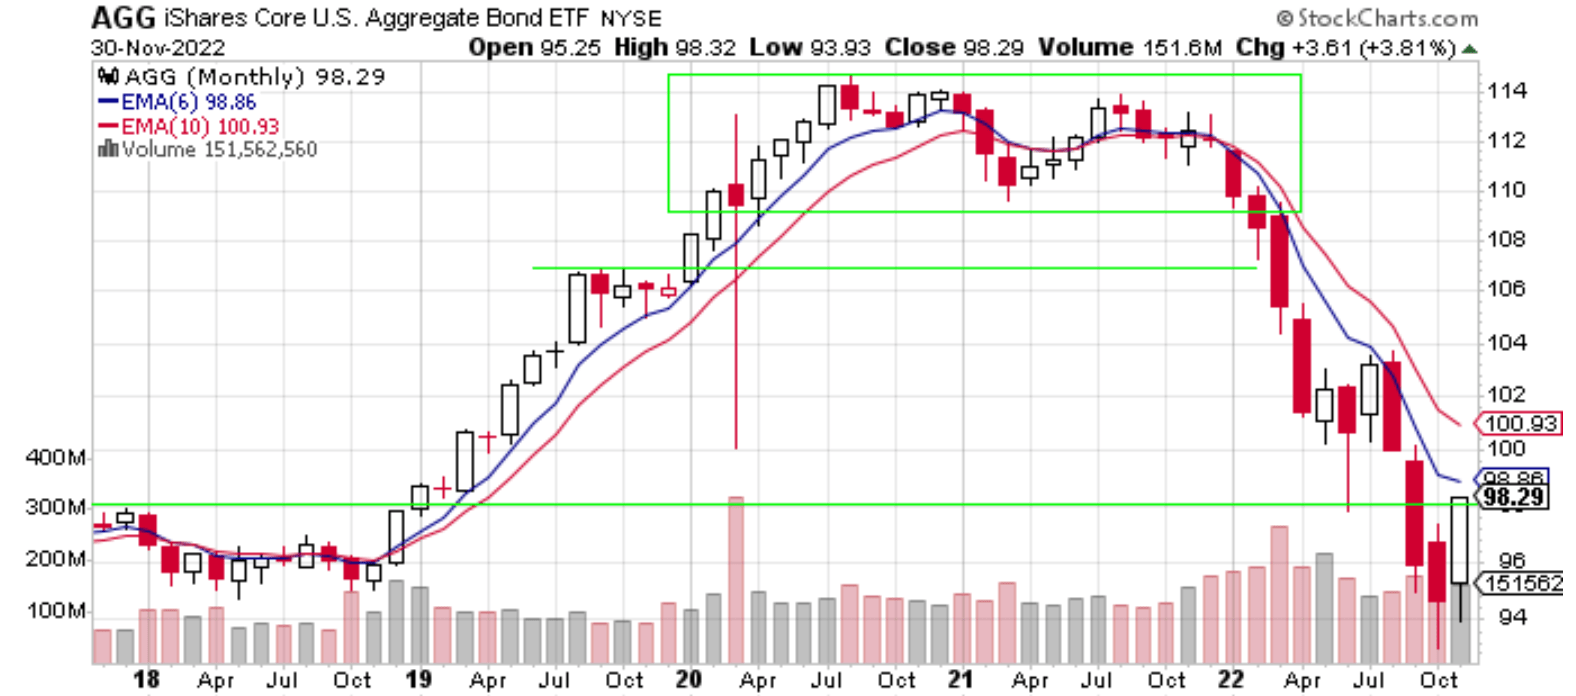
Chart 8 shows that AGG gained 3.81% in November. AGG was the only ETF in this article that did not close above its red 10-month moving average. AGG remains in bearish alignment. On a bullish note, AGG did bounce off the new lows set in November and reclaimed the green horizontal trendline that acted as resistance in 2018.
Chart 9 – Monthly AGG:SPY Relative Strength
www.stockcharts.com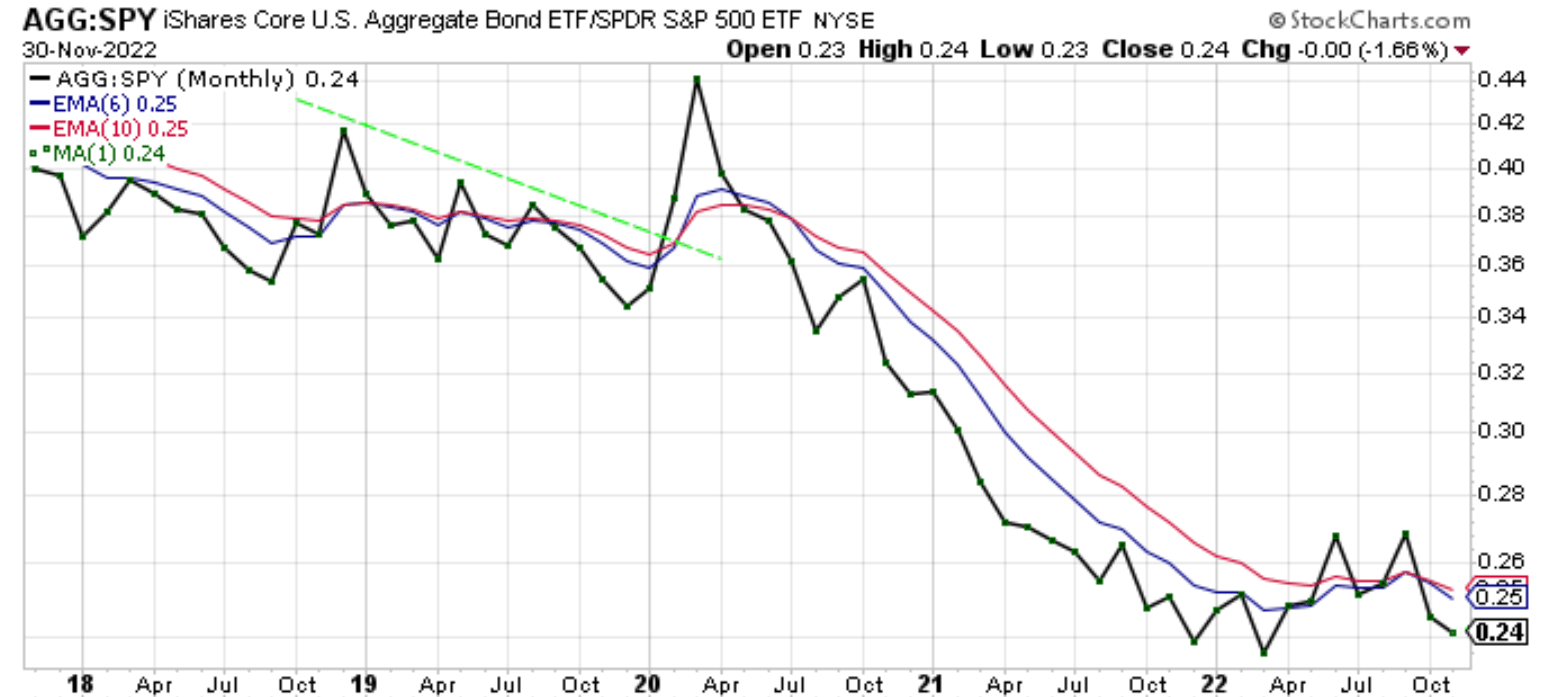
The AGG:SPY ratio in Chart 9 lost 1.66% as AGG underperformed SPY in November. The ratio was on the cusp of being in bullish alignment and is now heading lower.
In summary, all the ETFs made nice gains in November. Despite the rallies, all the price charts are still in bearish alignment. Every equity ETF is now above its red 10-month moving average. I must respect that bullish development so I will increase my allocation in SPY to 60% of my retirement account in December. The other 40% will remain in cash. I will be more aggressive when I see the ETFs get into bullish alignment where price is above both moving averages and the blue 6-month moving average is above the red 10-month moving average. That development could happen next month as we are in the seasonally bullish period for the stock market.
Be the first to comment