

da-kuk
The market bottomed on June 17th (for now)
Here is the headline from July 14th: Bank of America slashes S&P 500 target to “lowest on the Street” after recession forecast
Here is another headline from July 11th: BlackRock cuts developed market stocks to underweight as economic outlook worsens
These S&P 500 (NYSEARCA:SPY) downgrades by major US financial institutions happened during the week when the headline CPI inflation reached 9.1% – Consumer price index surges 9.1% in June, hottest rate in over 40 years.
And yet, the S&P 500 is up over the last month by nearly 2%, with all SPY sectors higher expect energy (XLE), industrial (XLI) and materials (XLB).
SelectSectorSPDR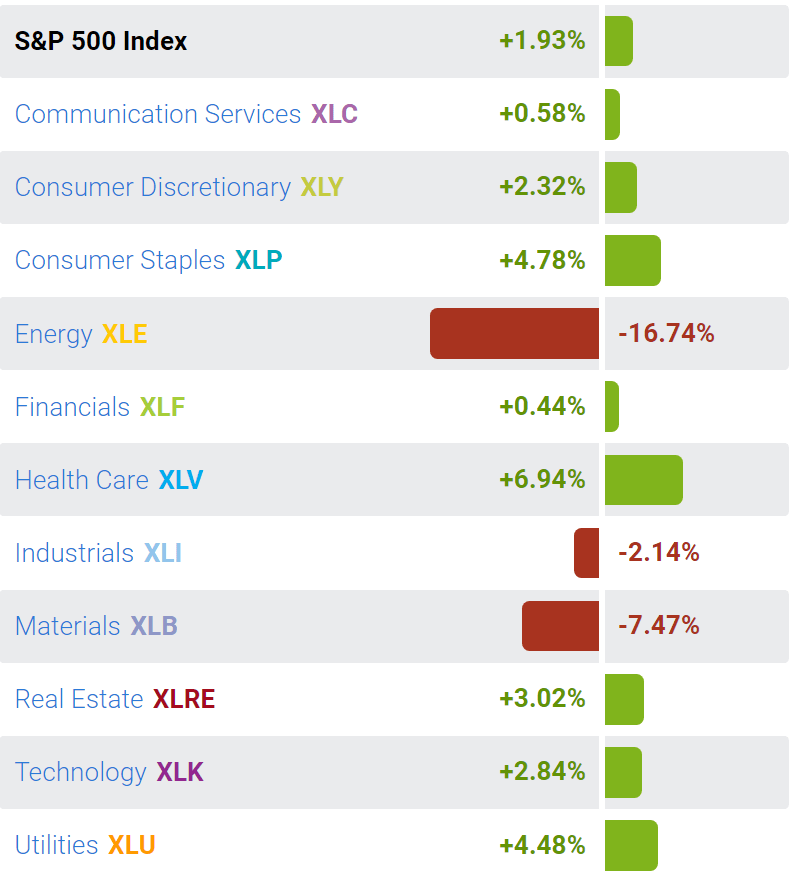
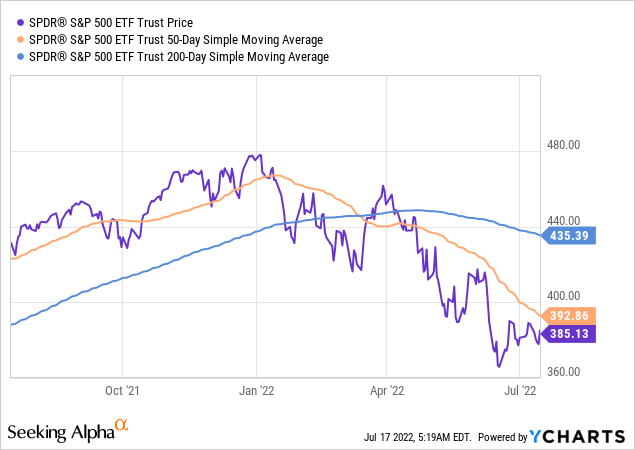
In fact, SPY bottomed on June 17th near the 360 level, or the 3650 level of S&P 500 futures (SPX), and it’s up by nearly 7% since then, and out of the bear market territory with the total drawdown of 18% YTD.
So, face it, with all the negativity last week, the stock market is not going down anymore.
The liquidity selloff risk is receding
In fact, I issued the buy rating on SPY on June 27th with the clear bullish case:
The carnage in commodities last week makes it very likely that the peak Fed hawkishness in behind us. The headline CPI inflation data over the next few months will have to reflect the falling commodity prices and thus, allow the Fed to make the dovish turn. As a result, the SPY rally last week will likely be sustained over the summer, into the fall. The liquidity risk will continue to ease as the monetary policy tightening expectations ease.
At the time crude oil fell from around $120/barrel to around $110/barrel. But now, crude oil is around $95/barrel. So, the case of falling inflation is getting even stronger. Yes, the June CPI was very high, but that’s because it was measured when oil was at $120/barrel in mid June – so, now that’s outdated information.
The price of crude oil is important because it directly affects the expected monetary policy tightening, which directly causes the liquidity shock risk. In fact, my bullish call was conditional to the ability that S&P 500 holds the 3840 level – which is the border between the correction and the bear market.
The key risk to the summer rally is the resurfaced liquidity shock for any random reason. As long as the S&P 500 is above the 20% drawdown level (the 1940 level of the S&P500), the liquidity risk will remain low. The drop below this threshold to bear market territory will cause more selling – so this is the stop-loss level for leveraged traders.
I want to make it clear, this is not a timing strategy – timing stock market over the short term is a foolish game. That was the strategy to avoid a very large potential drawdown should the liquidity selloff re-emerges.
However, it appears that the liquidity risk is easing. Even as the S&P 500 dropped below the 3400 level, with the very negative fundamental information, and significant downgrades from major US financial institutions, the S&P 500 remained resilient and grinded higher.
Why is S&P 500 grinding higher?
The liquidity risk receded because we are past the peak Fed hawkishness – the monetary policy tightening worst-case scenario is behind us. In fact, the Federal Funds futures are starting to price the end of the Fed’s hiking cycle in Feb 2023 and the first cut in Aug 2023.
Global Academic View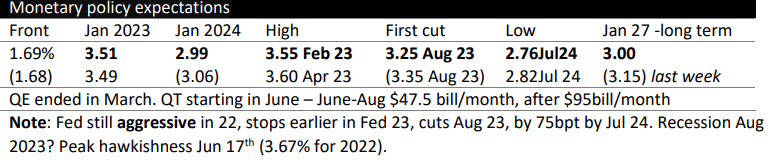
The market understands that the Breakeven inflation expectations are falling quickly and that the CPI inflation will prove to be transitory after all – possibly remain at an elevated level for some time, but way below the current levels. I would not be surprised that the market starts pricing disinflationary forces as the supply chains ease (eventually).
Thus, the S&P 500 (SP500) is looking past the CPI report and focusing on an anticipated dovish turn by the Fed, as early as September. It is very likely that the Fed will get the 2 positive CPI reports by September (July and Aug), which will justify the signaled dovish turn.
What about the recession scenario?
The economy could enter a technical recession, and we could be in one already. Yet, with the 24% peak-to-though correction, the S&P 500 already priced in a mild recession.
In fact, a slowing economy would support the Fed’s dovish turn, and actually boost the stock market.
The next leg down in S&P 500 could happen if the recession is deep, with significant increase in unemployment and significant downgrade in corporate earnings – that would cause the Phase 2 bearish selloff. At this point, it difficult to see a significant increase in unemployment over the near term given the shortage of labor.
But more importantly, the next leg down in S&P 500 would have to be driven by the spike in credit spreads (Phase 3 selloff), caused by the significant correction in housing prices. This scenario is possible if the unemployment rate sharply rises, which is not my forecast over the near term. The credit spread BBB-10Y is still low at 2.31%.
Implications
Investors should closely monitor the yields on 10Y Treasury Bonds (currently at 2.92%), and the yields on 3-month Bills (currently at 2.29%). The worst case scenario is if the 10Y yields keep falling towards the 2.5% (signaling a slowdown), while the Fed keeps hiking regardless with the 3mo yields reaching 3%. In this case, the 10-3mo spread would invert to -0.50%, which would signal a deeper recession – and the next leg down on SPY.
However, I expect the Fed will not invert the 10y-3mo significantly, and it will make the dovish turn if the 10Y yields keep falling, which would in-fact case the widening of the yield curve and boost the stock prices – this is the bullish scenario.
Thus, I am in the bullish camp – and still recommend a tactical buy on SPY.
Be the first to comment