

MCCAIG/iStock via Getty Images
S&P 500: Officially in a Bear Market
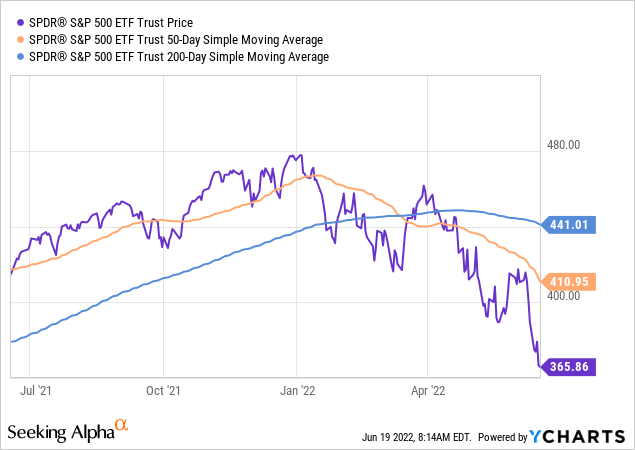
The S&P 500 (NYSEARCA:SPY) is now officially in a bear market with the YTD drawdown of 23.39%. Here is the SPY chart:
Bear market is a buying opportunity
For long term investors, bear markets present a rare opportunity to buy or to commit new long capital to stocks by either deploying the idle cash or by dollar-cost averaging.
However, the key unknown now is how deep the current bear market will be. If we get the deep 50%+ selloffs like in the 2008 or 2000 bear markets, we are only about half-away from the bottom. Thus, it’s still too early to start buying. Alternatively, if get the modest selloff like during the 1991 recession, we might be right at the bottom – and it’s time to buy aggressively.
What’s causing the current selloff?
As I previously explained, the full bear market has three phases:
- Phase 1 – The Liquidity Shock stage. The stock market sells off in anticipation of the expected monetary policy tightening. During the Phase 1 selloff, the overvalued, and speculative stocks/assets drop the most, the bubbles burst, and the PE ratios contract.
- Phase 2 – The Imminent Recession selloff. The monetary policy tightening usually causes a recession. In fact since 1945, the 13 monetary policy tightening cycles produced a recession 10 times (with 3 exceptions). The recessions cause the recessionary bear markets as corporate earnings decrease.
- Phase 3 – The Credit Crunch selloff. The recessions sometimes produce the credit crunch selloffs if the personal and corporate bankruptcies systematically increase, and threaten the financial system – for example the great financial crisis of 2008 and the Lehman Brothers bankruptcy.
So, what’s causing the current selloff? The bear market in 2022 from January 4th to June 17th has been primarily the Phase 1 Liquidity Shock selloff.
Specifically, on January 4th, the Fed was expected to hike the Federal Funds rate from 0.125% to 0.80% by the end of 2022 – the expectations were simple for a gradual monetary policy normalization. On May 3rd, when I expected that the Phase 1 sell off was completed, the expectations rose to 2.80% Federal Funds rate by the end of 2022. Now, as of June 17th, the expectations are the Fed will hike to 3.67% by the end of 2022 – which is the new peak in Fed hawkishness. Here are the current monetary policy expectations:
Global Academic View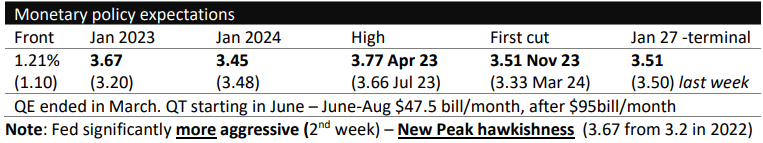
The sharply rising expectations of the monetary policy tightening produced the low liquidity in short term bonds (SHY) and federal funds futures, which caused the low liquidity in S&P 500 futures (SPX) – and that was clearly evident last week as the S&P 500 (SP500) correction turned into the bear market. Here is chart of Jan 23 Federal Funds futures – notice the drop last week.
Barchart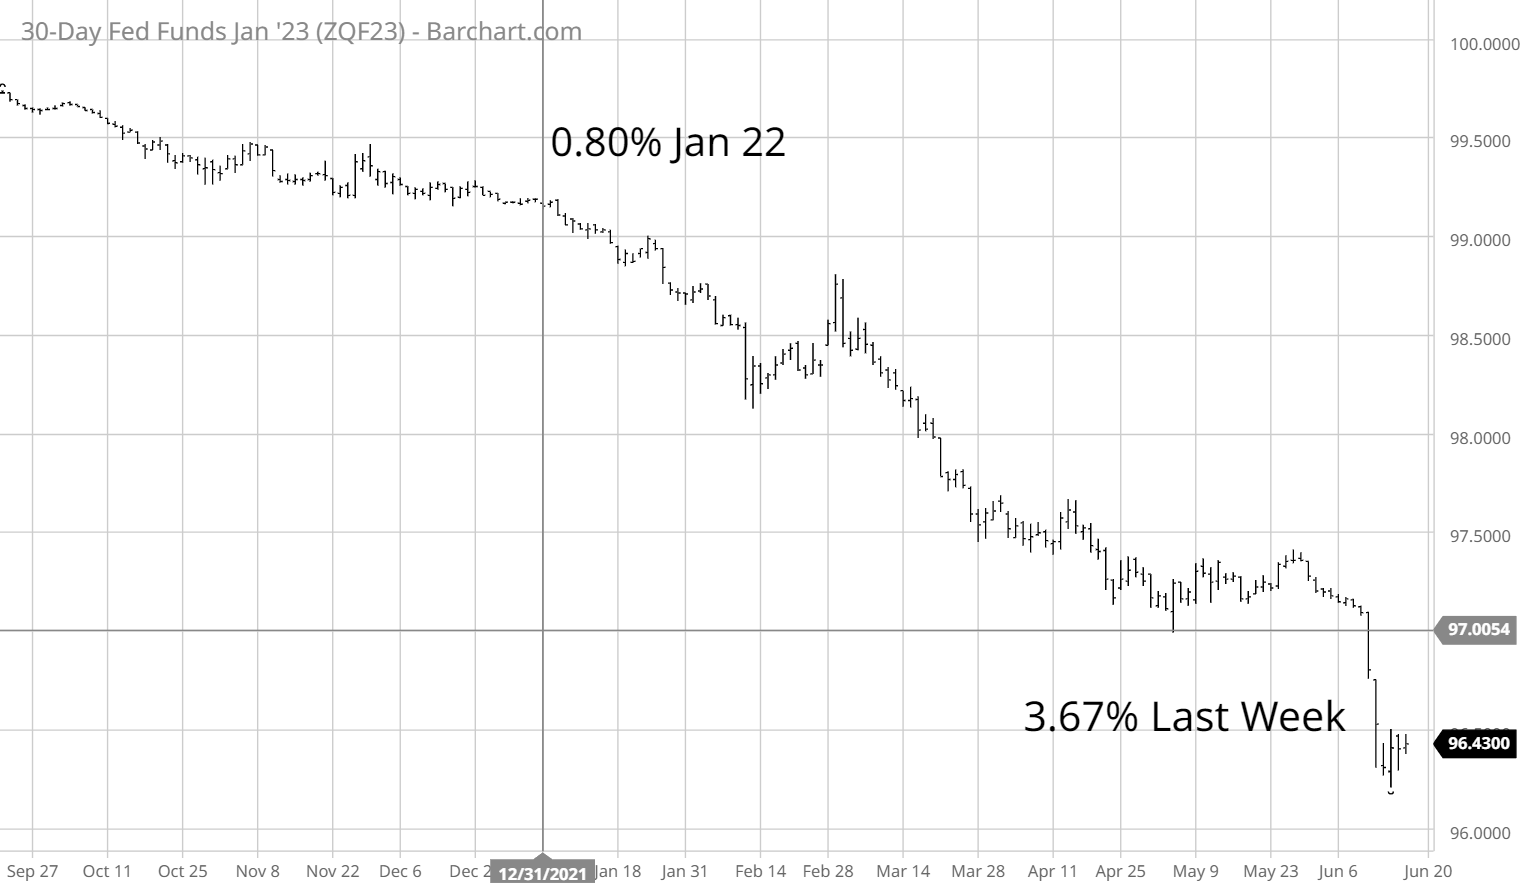
The second trigger of the selloff in 2022, and especially last week, is the significant increase in real interest rates since January 2022 from -1% to 0.66% last week. The increase in real interest rates can be attributed to, first, the end of the QE in March, and second, the start the QT last week – not a coincidence. Here is the chart of 10Y real interest rates, notice the spike last week:
FRED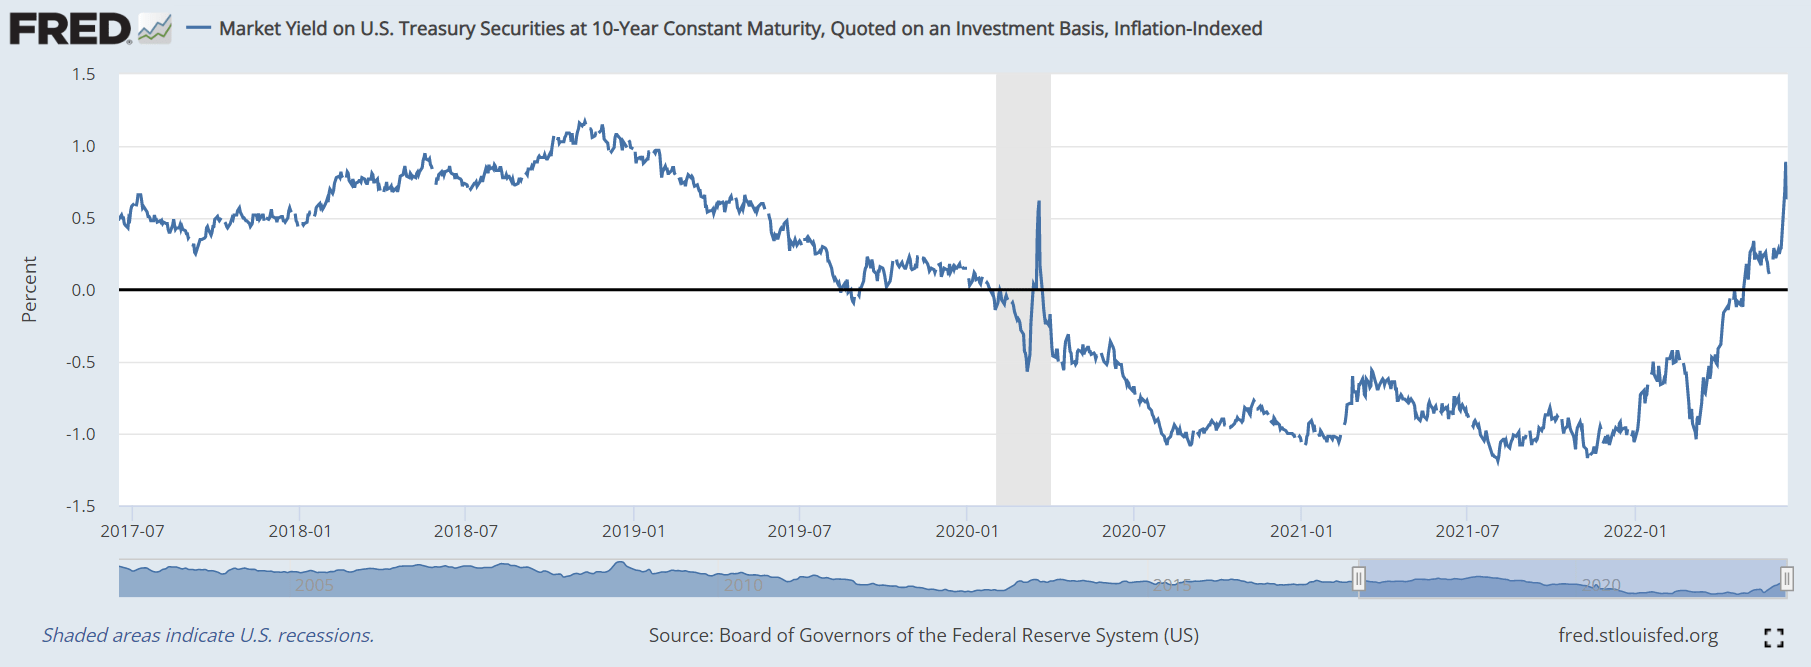
The liquidity shock selloff caused the S&P 500 PE ratio to decrease from 36 in January 22 to 18 as of last week – for a 50% decrease in valuation multiple (as earnings increased). Thus, the post-pandemic stock market bubble burst in 2022 – directly triggered by the sharply rising monetary policy tighten expectations.
Specifically, related to the (SPY) ETF sectors, the most speculative and overvalued sectors have corrected the most. Specifically, the consumer discretionary sector (XLY) is down by 34%, communication services (XLC) is down by 31%, and technology (XLK) is down by 29%.
SelectSectorSPY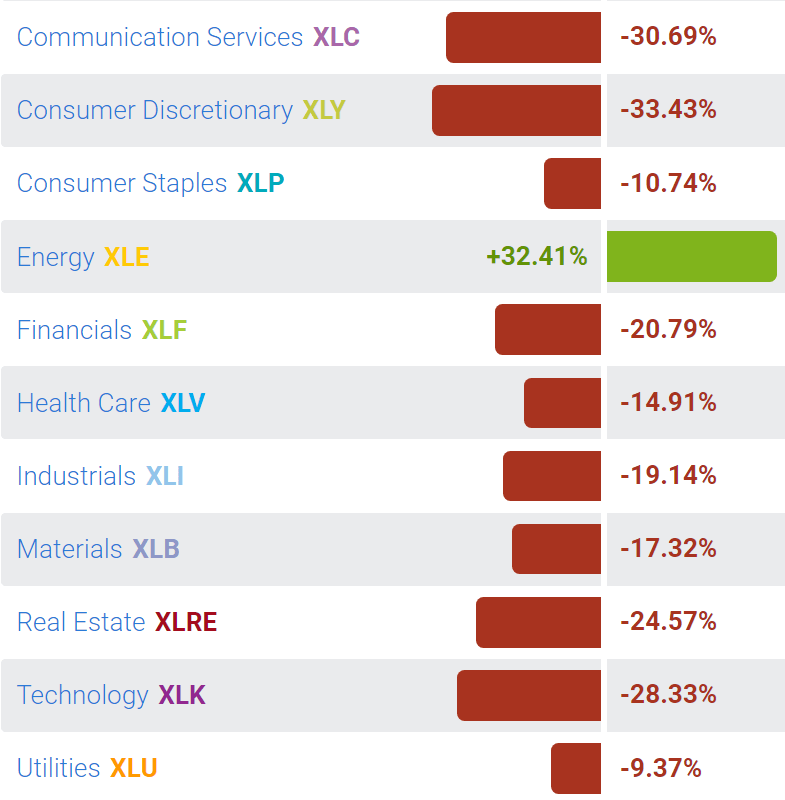
Where is the bottom?
So, it now the time to start buying – after the 24% total drawdown? The first question is whether the current Phase 1 liquidity shock selloff is finished.
I expected that the Phase 1 liquidity shock was completed in May. In fact, the BE long term inflation expectations still peaked in April, and the stock market bottomed at the 20% threshold and started rising.
However, the apparent overreaction to the lagging indicator, the headline CPI number, triggered the Round 2 of the Liquidity Shock selloff – despite the falling longer term inflation expectations.
The Round 2 of the Liquidity Shock is more irrational, more driven by fear, and thus causing deeper selloffs and more volatility across all assets – the cryptocurrencies (BTC-USD) are crashing, the US Dollar (UUP) is strengthening, even some commodities are selling off sharply.
Thus, the major risk now is the irrational liquidity driven selloff like in 1987, especially given the fact that the Fed is unable to provide any support. Such a deep selloff can be quick – even a 1-day event.
As a result, I don’t recommend looking for a bottom in this environment. However, this is not to say that longer term investors should stop dollar-cost averaging.
What are the positives?
The probability of an imminent recession is still low – strictly based on the wide spread between the 2Y and 3mo yields, currently at 1.62%. The probability of an imminent recession will be high when the 2-year yields start decreasing in anticipation of the Fed cutting interest rates, while the Federal Funds rate meets or exceeds the 2-year yields.
We are not there yet – thus the likelihood of the Phase 2 selloff is low. In-fact, the mild recession could already be priced-in, courtesy of the liquidity shock selloff.
Similarly, the credit risk is still low/moderate, with the spread between the BBB rated bonds and the 10Y yields at 2.13%. Historically, we need to see this spread above 3% to be considered as a high credit risk. Thus the likelihood of the Phase 3 Credit Crunch selloff is still very low.
Implications
It is very tempting to start buying now, after the 24% drop in the S&P 500. In fact, I recommended last week to start small tactical buying – with the strict stop-loss order if the 3840 level breaks. Well, the 3840 level is broken and the correction turned into the bear market – those tactical long positions are stopped-out.
At this point, I recommend a hold on the S&P 500 for tactical and long term positioning. The liquidity shock risk is very high and it will likely last until we get some positive data on inflation, which will provide the Fed with support to pause in September. In other words, we need to get the solid evidence that the Fed is able to implement the dovish turn.
Be the first to comment