

primeimages
Thesis
Nuveen S&P 500 Dynamic Overwrite Fund (NYSE:SPXX) is a closed end fund falling in the equity buy-write strategy bucket. As per the fund’s literature:
The Fund is designed to offer regular distributions through a strategy that seeks attractive total return with less volatility than the S&P 500 Index by investing in an equity portfolio that seeks to substantially replicate the price movements of the S&P 500 Index, as well as selling call options on 35%-75% of the notional value of the Fund’s equity portfolio (with a 55% long-term target) in an effort to enhance the Fund’s risk-adjusted returns. The strategy will consider the Fund’s tax position and employ techniques to improve after-tax shareholder outcomes.
Source: Q1 Portfolio Review
The fund holds a portfolio of equities set to replicate to a large extent the S&P 500 index but with tweaks. SPXX’s top sectoral allocation is 25.9% Technology vs 24.16% in the Index, Health Care is 14.9% vs 15.17% in the Index. We can see a slight basis in the top holdings as well versus the S&P 500.
The fund writes options on the index rather than on its own portfolio, so there is a slight basis – i.e. an investor is running under the assumption that the slight tweaks the portfolio managers are doing in the fund’s assets vs the index are going to be winning bets. As of the writing of this article only 52% of the portfolio had call options written against the notional. The fund’s mandate allows, as per the above quote, notional covered by calls of up to 75%.
What is interesting about SPXX, and differentiates it against other buy-write CEFs, is its ability and active implementation of volatility trading. As of March 31st, 2022 for example the fund disclosed:
Q1 2022 Trade Summary (Fund Fact Sheet)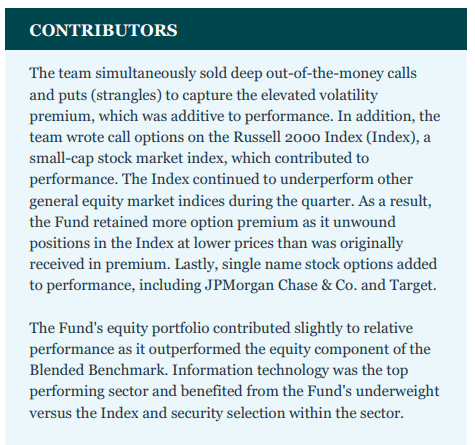
The fund sold strangles during Q1 2022 to monetize a high level of volatility. This is different than your average buy-write CEF that writes only calls on the portfolio with a fairly static maturity period and out of the money percentage for the options. It basically translates into SPXX being a vehicle where the portfolio managers have more liberty to trade volatility versus other CEFs in the sector. This setup however has not translated into a glaring outperformance for SPXX: in 2022 the fund’s performance is in line with ETV and XYLD while on a 5-year basis SPXX is in the middle of the cohort.
For 2022 SPXX’s performance comes down to one simple factor – percentage of the portfolio covered by calls. In a decreasing market the more you cover the better of you are from a profit & loss standpoint. However, a sophisticated reader is to note that the fund writes a significant amount of “in-the-money” calls, meaning a higher delta for the options and a higher premium in a decreasing market. Those factors and figures are outlined in the “Option Overlay Information” section below, with the average call strike vs spot standing at 98% (i.e. meaning the calls are in the money when written).
The fund is currently trading at a very small premium to NAV of 1.19%, unlike the other CEF’s in the buy-write asset class which are experiencing record premiums as of the writing of this article. We presume the flat premium is due to the portfolio coverage and the volatility trading overlay which is a bit of a black-box in terms of doing a pro-forma risk analysis since it can change substantially. We feel this is where the fund’s appeal currently resides as well. SPXX is a robust vehicle that does more than meets the eye and takes more basis risk than other buy-write CEFs. Long term the fund has proved its mettle and worth. We feel there is another leg down in this market which is going to negatively affect SPXX, but for a retail investor eager to enter the buy-write CEF space SPXX stands above its peers currently due to its inexistent premium to NAV.
Option Overlay Information
Currently the fund covers 52% of the equity notional:
Option Overlay Summary (Fund Website)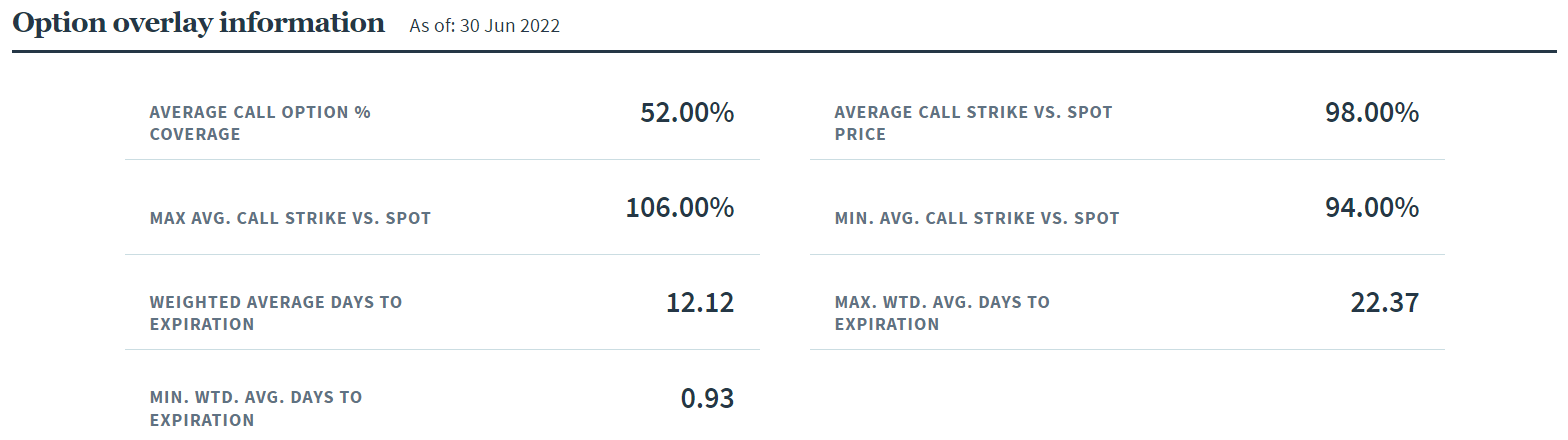
Below we have pulled from the fund’s literature the definitions for each term present above:
Average Call Option % Coverage is the percentage of the Fund’s underlying equities overwritten by call options; equals sum of notional values of call options divided by the market value of equities in the portfolio.
Average Call Strike vs. Spot Price is the average ratio of call option strike prices vs. spot prices, weighted by the notional value of the calls. A figure > 100% indicates that option strike prices, on average, are above their current spot prices and the calls are “out of the money”. A figure < 100% indicates that option strike prices, on average, are below spot prices and the calls are “in the money.”
Maximum Average Call Strike vs. Spot Price is the maximum average ratio (as defined above) of call option strike prices vs. spot prices during the month.
Minimum Average Call Strike vs. Spot Price is the minimum average ratio (as defined above) of call option strike prices vs. spot prices during the month.
Weighted Average Days to Expiration is the average days to expiration for all call options in the Fund’s portfolio, weighted by notional values.
Maximum Weighted Average Days to Expiration: Is the maximum average number of days to expiration during the month for all call options in the Fund’s portfolio, weighted by notional values.
Minimum Weighted Average Days to Expiration: Is the minimum average number of days to expiration during the month for all call options in the Fund’s portfolio, weighted by notional values.
Basically the takeaway here is that on average the fund writes in-the-money call options currently which have higher deltas and protect better a portfolio during a downturn due to their higher realized premiums.
Performance
The fund’s year to date performance is in line with other buy-write CEFs as well as the covered call ETF (XYLD):
YTD Performance (Seeking Alpha)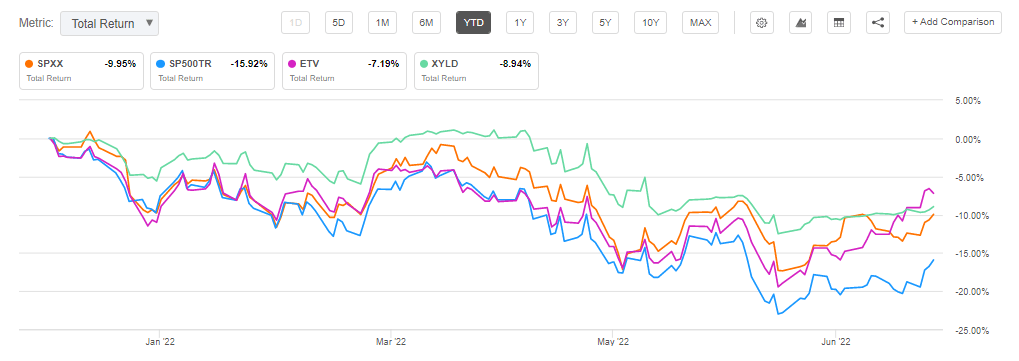
On a 5-year basis the CEF exhibits a middle of the cohort performance:
5Y Total Return (Seeking Alpha)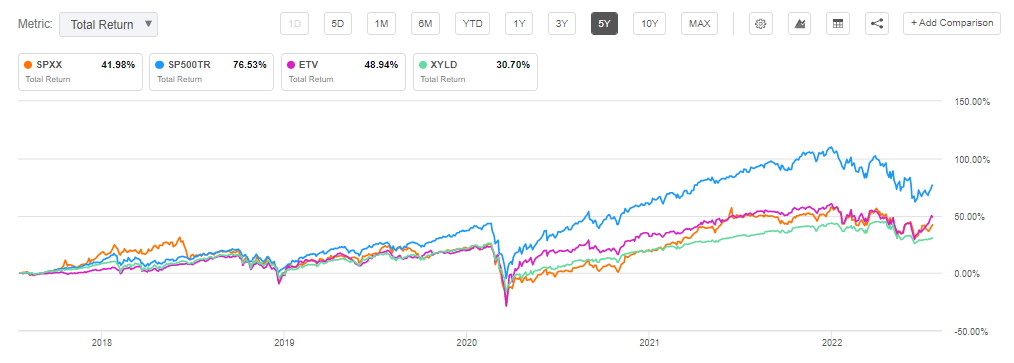
A 10-year chart finds SPXX underperforming the golden standard in the sector, namely ETV, but beating the covered call ETF XYLD:
10-Year Total Return (Seeking Alpha)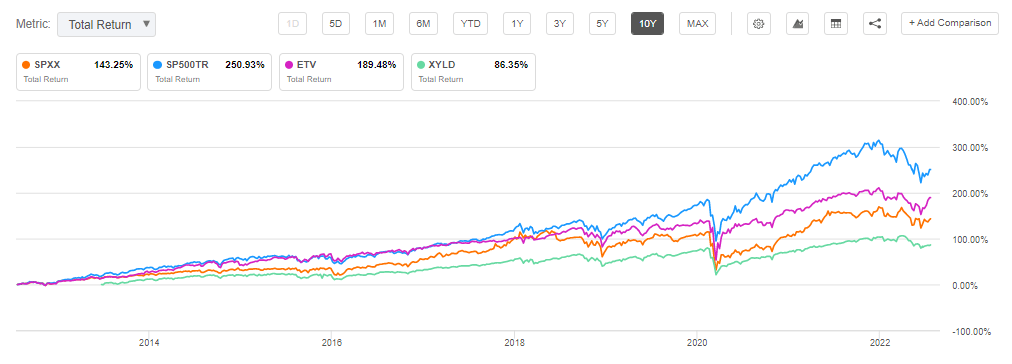
The fund has an annualized total return above 7.5% both on a 5- and 10-year basis:
Annualized Returns (Morningstar)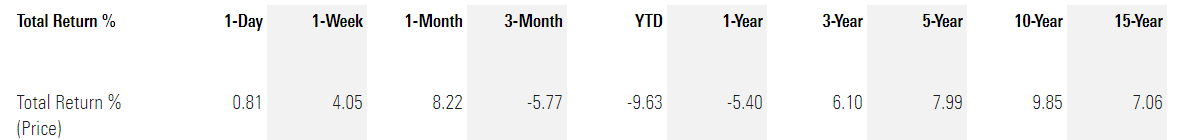
Holdings
The fund tries to replicate to a large extent the S&P 500 index:
Top Sectors (Fund Website) Top issuers (fund website)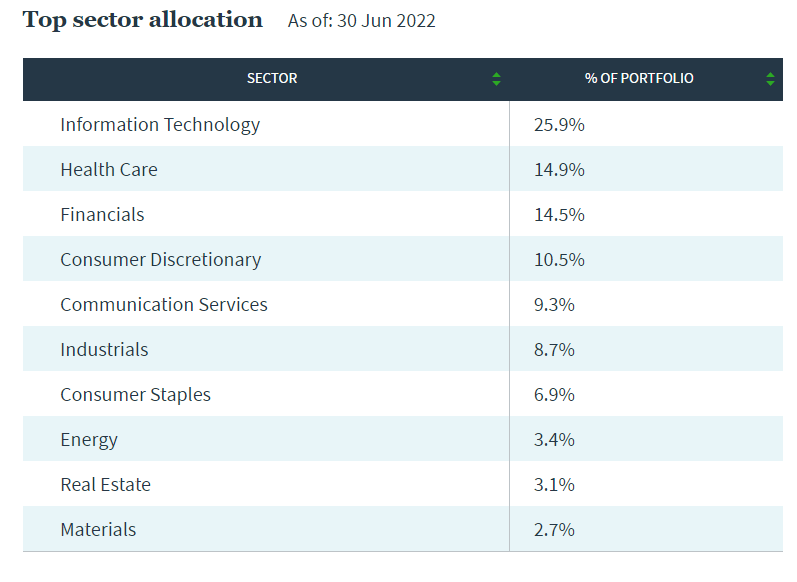
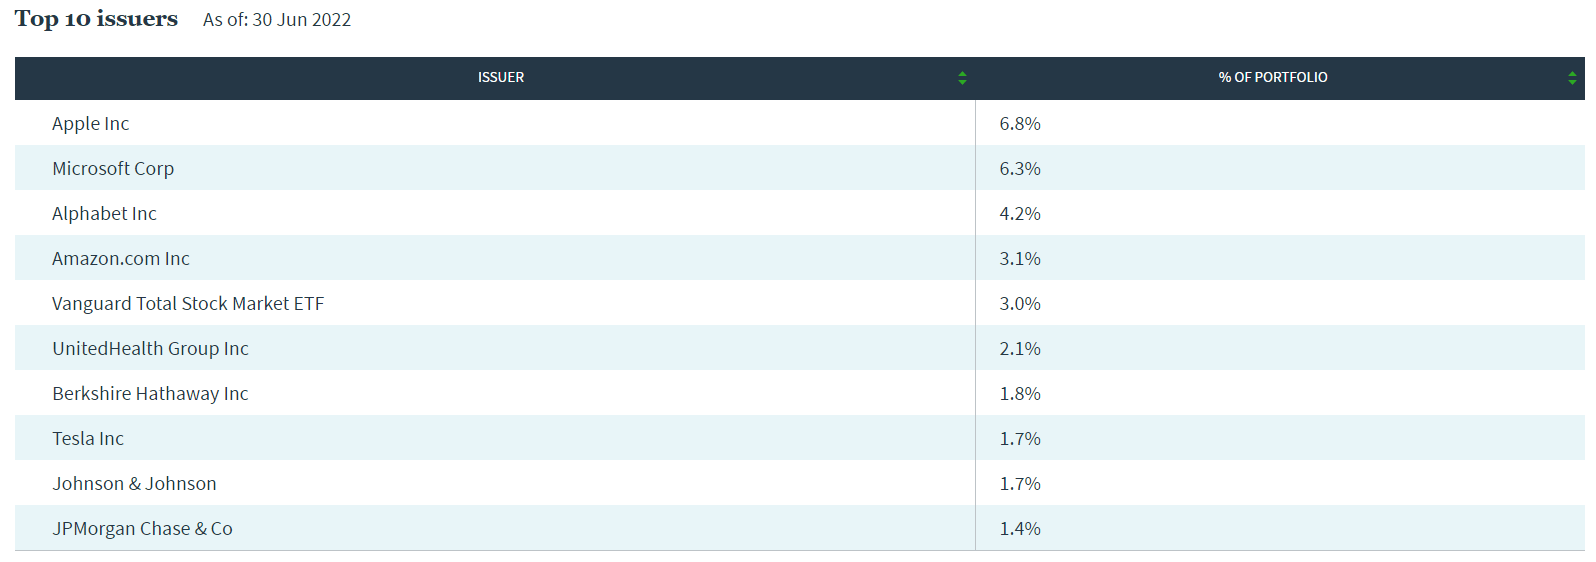
However do note, as mentioned in the Thesis section that there is a sectoral and name weighting basis to the index (i.e. not all weightings are like for like).
Premium / Discount to NAV
The fund is currently trading almost flat to NAV:
Premium/Discount to NAV (Morningstar)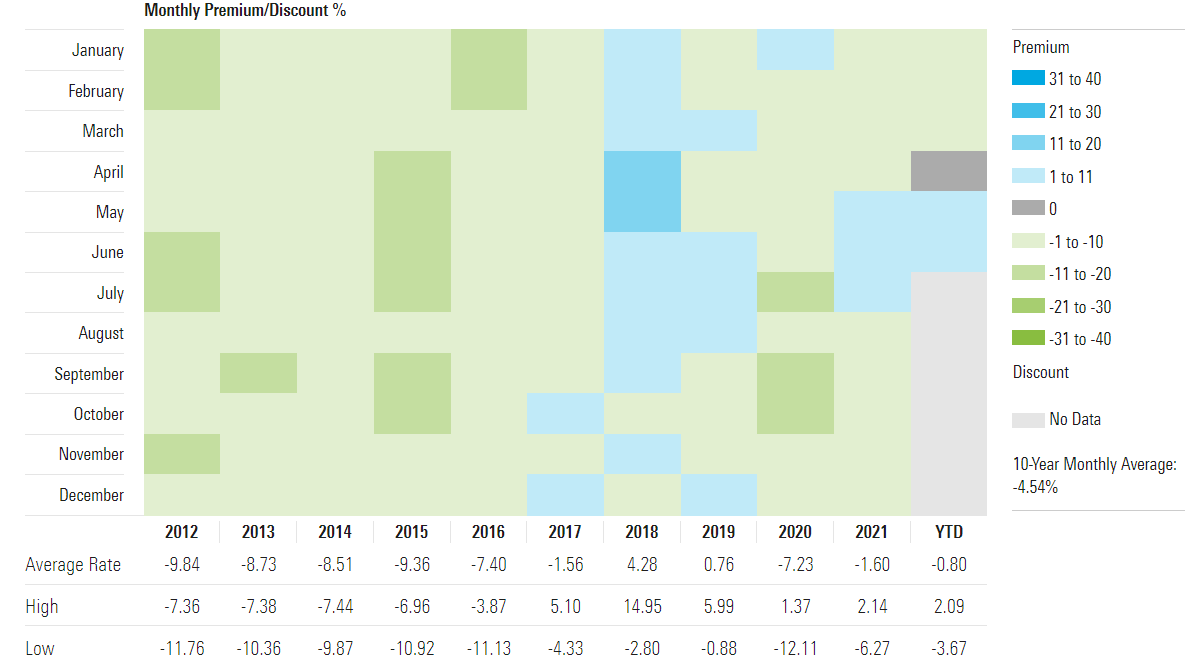
We can see that historically up to 2017 the CEF was trading at substantial discounts to net asset value. The vehicle tends to alternate between discounts and premiums to NAV.
Conclusion
SPXX is a “buy-write” equity CEF that has a composition similar to the S&P 500. The fund currently writes calls on 52% of the portfolio, with the average call being in the money by 2%. The fund also takes some basis risk with the portfolio allocation largely matching the S&P 500, but not entirely like for like. What is interesting about SPXX is the latitude the portfolio managers have to trade equity vol, with the fund selling strangles during Q1 2022. SPXX currently has only a minute premium to NAV (a little over 1%) while its peers in the equity CEF buy-write category are seeing historic high premiums to net asset value as investors flock to take advantage of the high VIX levels in the market. SPXX has a robust long-term performance and represents a solid choice for a retail investor eager to enter the space despite the potential for another leg down in the S&P 500.
Be the first to comment