

B4LLS/iStock via Getty Images
A Quick Take On SPS Commerce
SPS Commerce (NASDAQ:SPSC) reported its Q3 2022 financial results on October 27, 2022, beating expected revenue and EPS estimates.
The company provides supply chain management software and related services worldwide.
For the near term, I’m increasingly cautious about supply chain management software and services companies, as the effects of a global slowdown may exert a drag on these stocks.
My outlook on SPSC is a Hold at this time.
SPS Commerce Overview
Minneapolis, Minnesota-based SPS was founded in 1987 and provides cloud-based supply chain management solutions globally. From their platform, the company offers solutions to retailers, suppliers, grocers, distributors, and logistics firms to manage their omnichannel orders, optimize their sell-through performance, and automate new trading relationships.
SPS also provides fulfillment, analytics, and complimentary solutions such as assortment and community products. These solutions allow customers to enhance their visibility across their supply chains with greater analytics capabilities, better order management, and rapid fulfillment.
The firm is headed by Chief Executive Officer, Archie Black, who has been with the firm since June 1998.
SPS Commerce acquires new customers through its partnerships with retailers, grocers, distributors, and logistics firms.
Additionally, the company relies on marketing and promotional campaigns to advertise its solutions, as well as direct sales activities to acquire new customers.
SPS Commerce’s Market & Competition
According to a 2021 market research report by Allied Market Research, the market for supply chain management software and services was an estimated $18.7 billion in 2020 and is forecast to reach $52.6 billion by 2030.
This represents a forecast CAGR of 10.7% from 2021 to 2030.
The main drivers for this expected growth are demand for increased supply chain visibility, especially after the disruptions caused by the COVID-19 pandemic.
Also, the chart below shows the supply chain management market changes between 2020 and 2030, by solution type:
Supply Chain Market (Allied Market Research)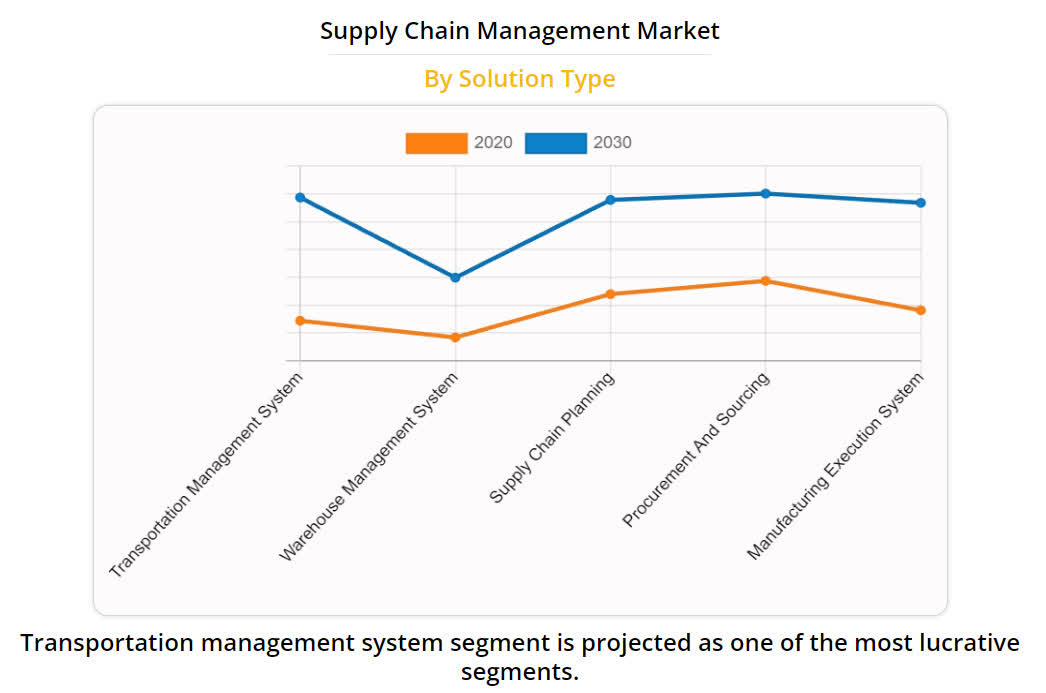
Major competitive or other industry participants include:
-
Epicor Software
-
Manhattan Associates
-
HighJump
-
Info
-
IBM
-
JDA Software Group
-
Kinaxis
-
e2open
-
Oracle
-
SAP
-
Descartes Systems Group
-
Others
SPS Commerce’s Recent Financial Performance
-
Total revenue by quarter has risen steadily, as the chart shows below:
9 Quarter Total Revenue (Seeking Alpha)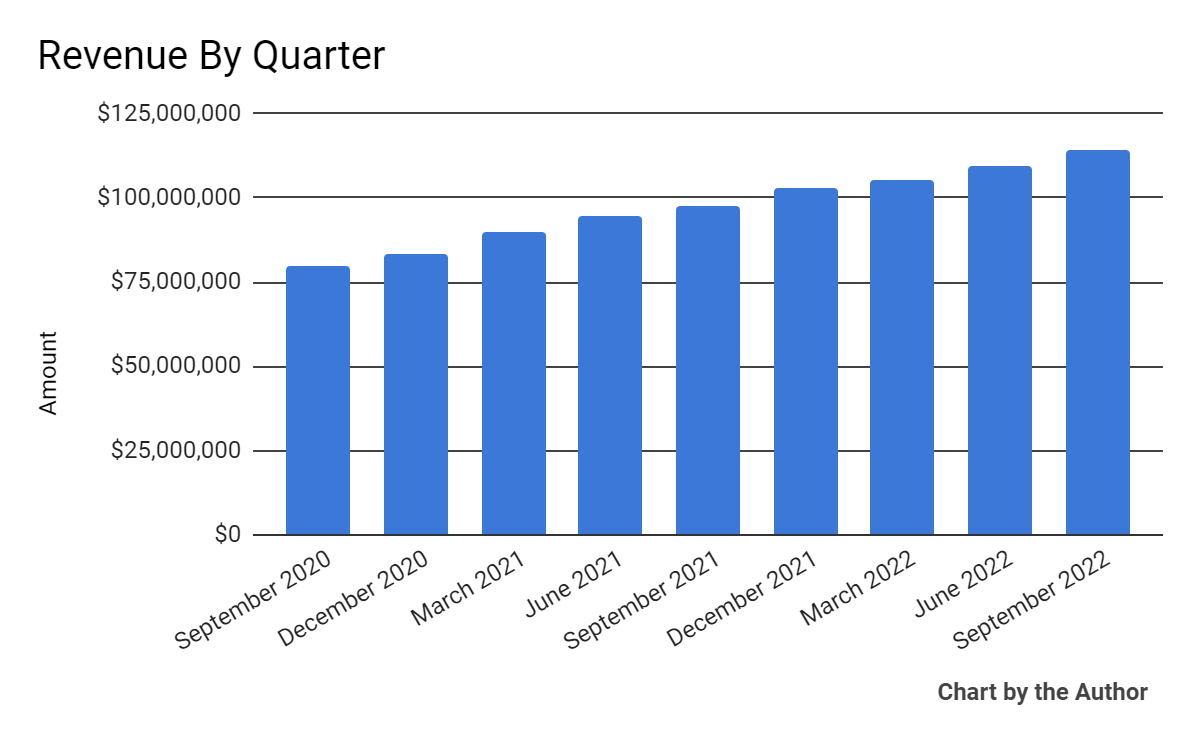
-
Gross profit margin by quarter has trended lower in recent quarters:
9 Quarter Gross Profit (Seeking Alpha)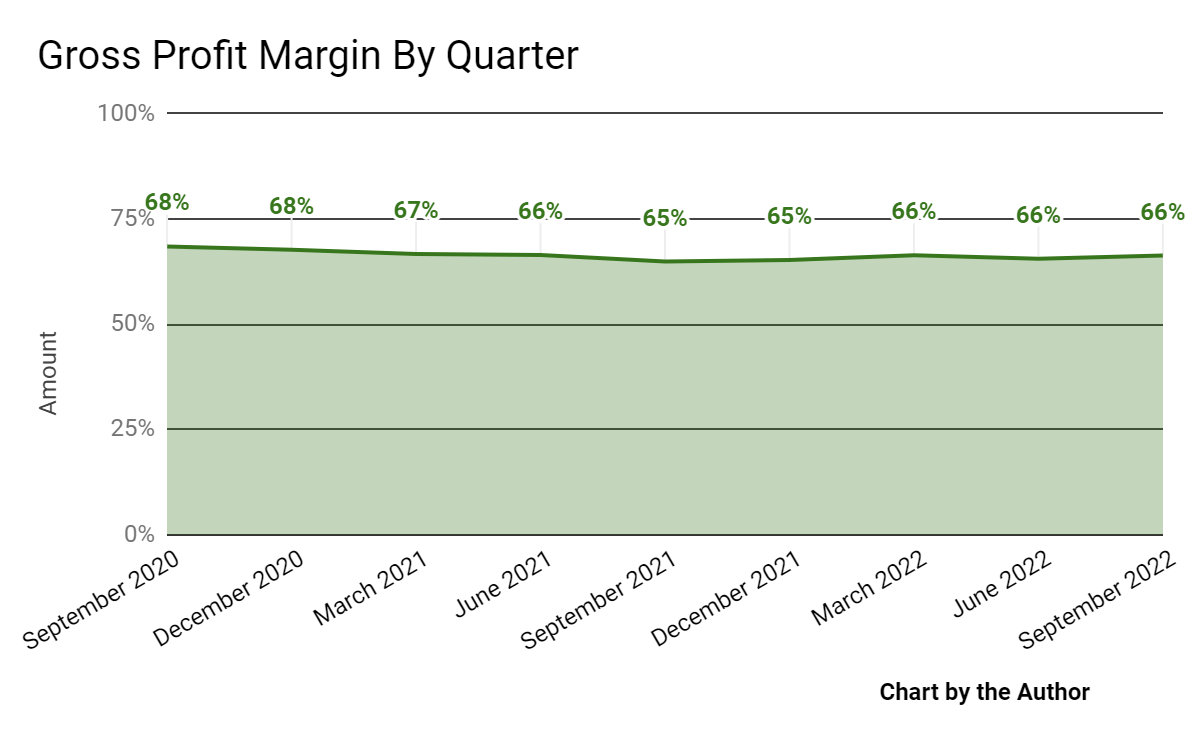
-
Selling, G&A expenses as a percentage of total revenue by quarter have also trended lower recently:
9 Quarter Selling, G&A % Of Revenue (Seeking Alpha)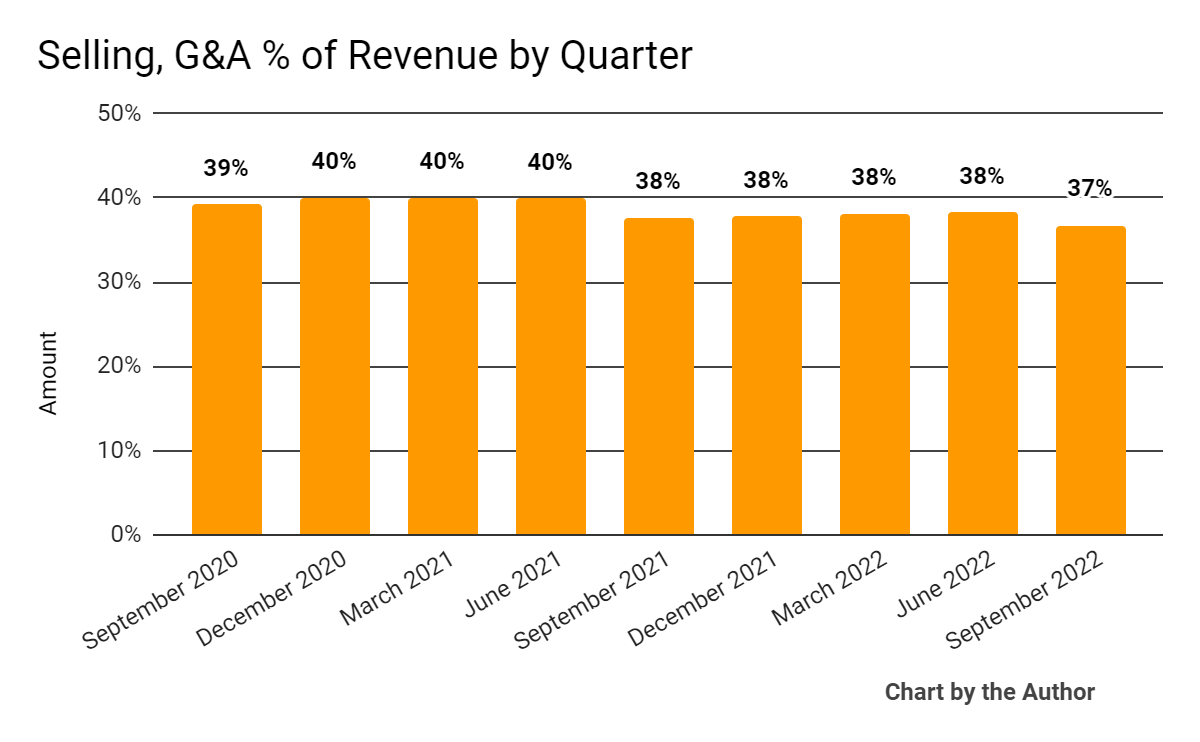
-
Operating income by quarter has grown in recent quarters:
9 Quarter Operating Income (Seeking Alpha)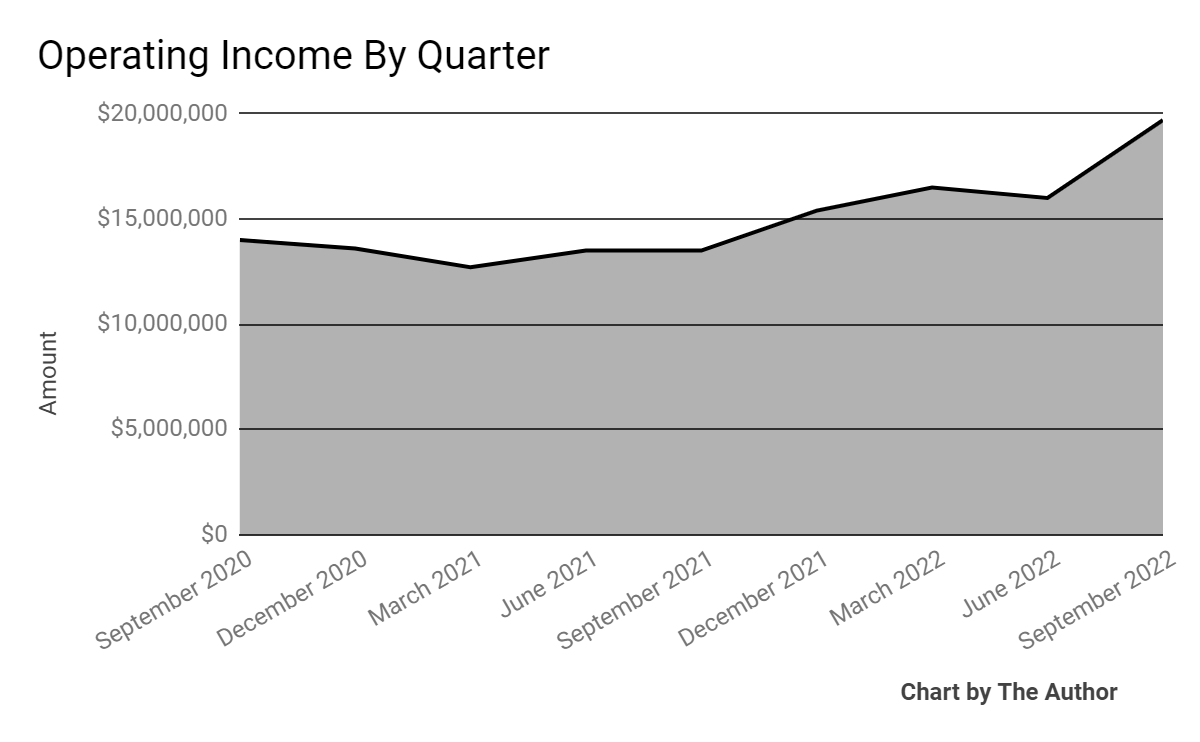
-
Earnings per share (Diluted) have improved markedly in Q3 2022:
9 Quarter Earnings Per Share (Seeking Alpha)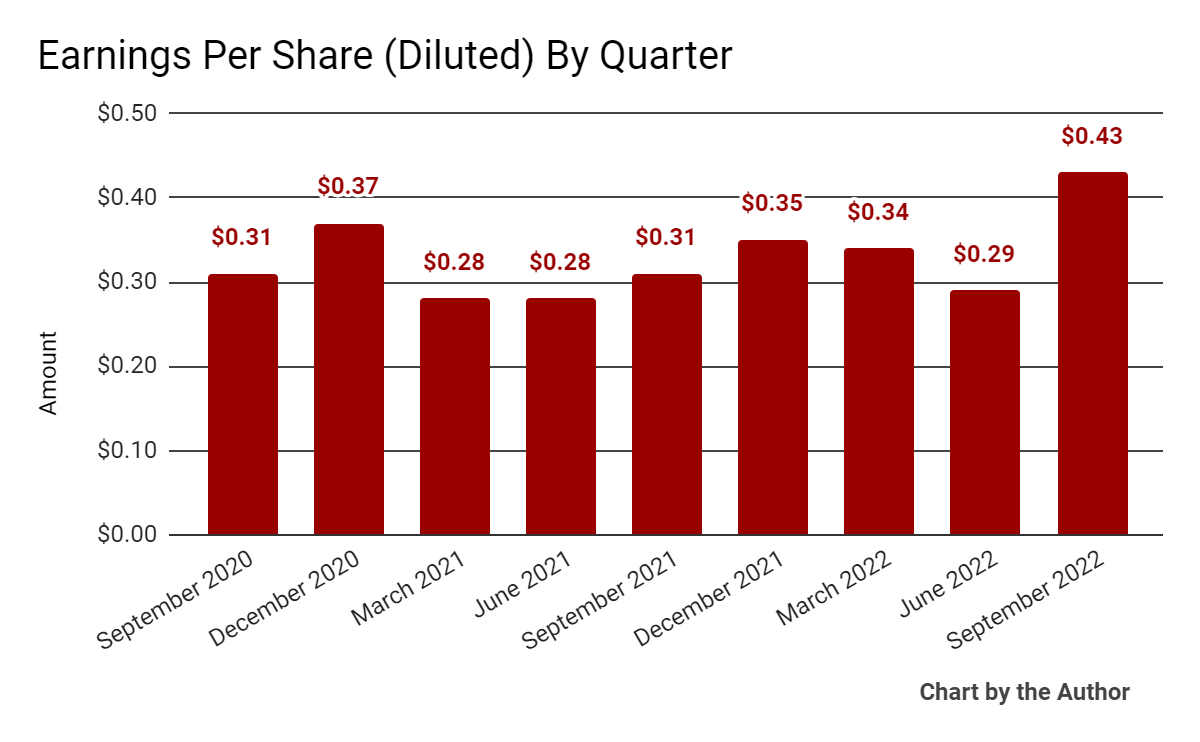
(All data in the above charts is GAAP)
In the past 12 months, SPSC’s stock price has fallen 4.1% vs. the U.S. S&P 500 Index’s drop of around 14.3%, as the chart below indicates:
52 Week Stock Price (Seeking Alpha)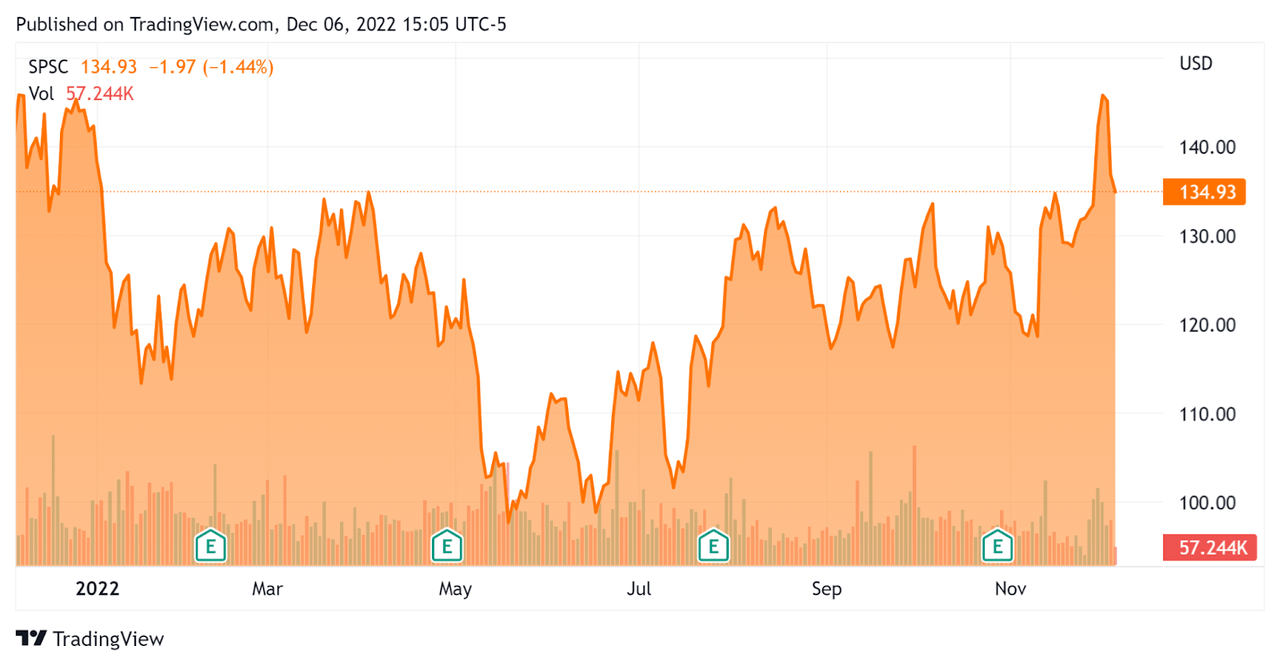
Valuation And Other Metrics For SPS Commerce
Below is a table of relevant capitalization and valuation figures for the company:
|
Measure (TTM) |
Amount |
|
Enterprise Value/Sales |
10.9 |
|
Enterprise Value/EBITDA |
50.4 |
|
Revenue Growth Rate |
18.0% |
|
Net Income Margin |
12.0% |
|
GAAP EBITDA % |
21.7% |
|
Market Capitalization |
$4,930,000,000 |
|
Enterprise Value |
$4,720,000,000 |
|
Operating Cash Flow |
$107,810,000 |
|
Earnings Per Share (Fully Diluted) |
$1.41 |
(Source – Seeking Alpha)
A potential relevant public comparable firm to SPSC would be Manhattan Associates (MANH); below is a comparison of their major metrics:
|
Metric (TTM) |
Manhattan Associates |
SPS Commerce |
Variance |
|
Enterprise Value/Sales |
10.0 |
10.9 |
9.2% |
|
Enterprise Value/EBITDA |
52.1 |
50.4 |
-3.4% |
|
Revenue Growth Rate |
15.8% |
18.0% |
13.5% |
|
Net Income Margin |
15.1% |
12.0% |
-20.2% |
|
Operating Cash Flow |
$164,500,000 |
$107,810,000 |
-34.5% |
(Source – Seeking Alpha)
To view a detailed comparison of SPSC with MANH, click here.
The Rule of 40 is a software industry rule of thumb that says that as long as the combined revenue growth rate and EBITDA percentage rate equal or exceed 40%, the firm is on an acceptable growth/EBITDA trajectory.
SPSC’s most recent GAAP Rule of 40 calculation was 39.7% as of Q3 2022, so the firm has performed well in this regard, per the table below:
|
Rule of 40 – GAAP |
Calculation |
|
Recent Rev. Growth % |
18.0% |
|
GAAP EBITDA % |
21.7% |
|
Total |
39.7% |
(Source – Seeking Alpha)
Commentary On SPS Commerce
In its last earnings call (Source – Seeking Alpha), covering Q3 2022’s results, management highlighted how SPS continues to expand its network across industries to strengthen its competitive capabilities.
The company recently acquired InterTrade, a provider of technical solutions for product information and transaction data exchange between retailers and suppliers across North America.
For suppliers and retailers, automation is an important factor in improving efficiency. SPSC facilitates increased automation and enables integration with a range of e-commerce platforms.
Management believes that increasing complexity in omnichannel retail will continue to fuel the need for automation between trading partners and throughout the supply chain.
As to its financial results, total revenue rose steadily by 17% year-over-year, while gross profit margin remained relatively flat at 66%.
Notably, management did not disclose any retention rate metrics.
SPSC’s Rule of 40 results have been impressive, achieving a 39.7% result for the trailing twelve-month period.
SG&A expenses as a percentage of revenue dropped, while operating income rose markedly during the quarter, as did earnings per share.
For the balance sheet, the firm ended the quarter with $237.2 million in cash, equivalents and short-term investments and no debt.
Over the trailing twelve months, free cash flow was $89.9, of which capital expenditures accounted for $17.9 million.
Looking ahead, management guided full-year revenue growth of 17% and adjusted EBITDA (ex stock-based compensation and one-time items) of 22% growth rate over 2021.
Regarding valuation, the market is valuing SPSC at an EV/Sales multiple of around 10.9x.
The SaaS Capital Index of publicly held SaaS software companies showed an average forward EV/Revenue multiple of around 6.8x at October 31, 2022, as the chart shows here:
SaaS Capital Index (SaaS Capital)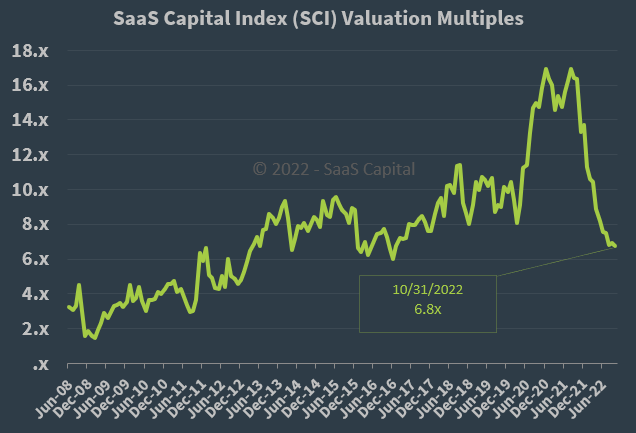
So, by comparison, SPSC is currently valued by the market at a significant premium to the broader SaaS Capital Index, at least as of October 31, 2022.
The primary risk to the company’s outlook is an increasingly likely macroeconomic slowdown or recession, which may produce slower sales cycles and reduce its revenue growth trajectory.
For the near term, I’m increasingly cautious on supply chain management software and services companies, as the effects of a global slowdown may exert a drag on these stocks.
My outlook on SPSC is a Hold at this time.
Be the first to comment