

filadendron
Investment Thesis
Earlier this year, Sportsman’s Warehouse (NASDAQ:SPWH) was an acquisition target at USD 18 by Great Outdoors Group, owner of Bass Pro Shops chain. But the deal fell through because the competition authority had concerns. With the stock trading at USD 9.17 right now, seemingly at lower multiples than its peers, the company showing impressive growth potential, new store openings, and initiation of a buyback program open the discussion of whether SPWH is highly undervalued. We aim to address this through our analysis.
We consider SPWH to be a good investment if you believe in the sustainability of its expected growth. Since SPWH does not appear to have a moat, we, as value investors, are not willing to pay for the growth. We believe that with the stated growth rates, it is fairly valued at current market prices while we look for a margin of safety before taking a long position on the stock.
Comparison with Industry Leader, DICK’S Sporting Goods, Inc. (DKS)
Moat Investing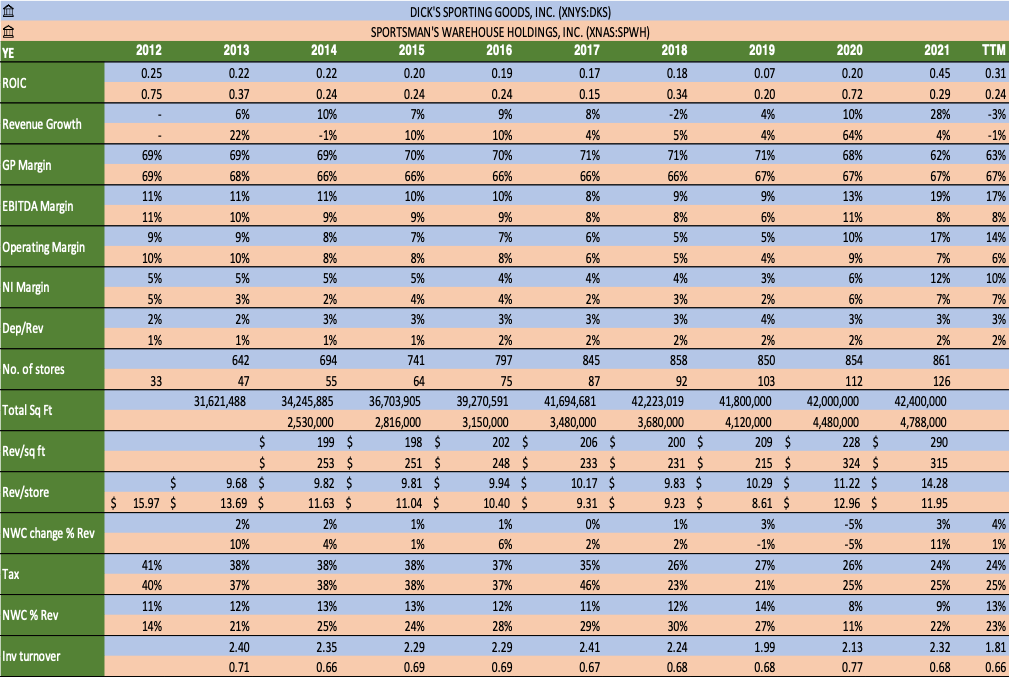
The above Table shows the comparison of both companies on different metrics and forms the basis of our comparison below.
With a market cap of USD 8.83 billion, and 861 stores DKS is the leading company in this sector. DKS trades at P/E of 9.67 while SPWH trades at P/E of 4.04. We try to understand whether this discount on SPWH is justified.
Gross profit Margins of both are relatively stable and similar; SG&A is where both differentiate themselves. SPWH has not been able to cope with inflationary pressures, and its operating margins squeezed from 9% to 7% in 21ye. During the same period, DKS increased its margins from 10% to 17% due to superior buying, bargaining, and pricing power.
DKS posted a net income margin of 12% in 2021; even with lower financial leverage, SPWH’s net income margin was 7% in the same period.
Although SPWH beats DKS in revenue per square foot having a $25 difference per sq. ft., DKS reports a better revenue per store by a margin of 2.33k per store as per 21ye. This highlights a more extensive average square feet area of DKS stores.
Based on the 10-year average, DKS has a net working capital requirement of 11% of sales relative to SPWH, having an average nwc requirement of 23% of sales. SPWH has a 10-year average inventory turnover ratio of 0.69, significantly lower than DKS which stands at 2.2, explaining the lower nwc requirements of DKS and highlighting the greater operational efficiency of DKS. Because of this reason, SPWH has typically invested more in inventory, having an average closing inventory difference of 8% of revenue.
On an average basis, SPWH has a better ROIC than DKS, so we expect SPWH to recover its investment in opening new stores rather quickly. Both have a higher ROIC than their respective WACC, which suggests that value is being created when capital is deployed. Still, as value investors, we must check whether this positive spread between ROIC and WACC is protected by an Economic Moat, and by looking at the two companies DKS seems to have a higher chance of having a Moat than SPWH.
DKS also has better geographic diversification than SPWH. In the picture below, we can see that stores of SPWH are very concentrated. Opening new stores in an already concentrated area may cause cannibalization from its stores.
Also, DKS is not as reliant on one of its products as SPWH is and has a very good dividend program making it much less risky than SPWH.
All these factors lead us to believe that on a comparable basis, the discount of SPWH relative to DKS is justified. But we will still dig further deeper and develop a DCF model to have a better understanding and further confirm our Investment Thesis.
Investor Relations – SPWH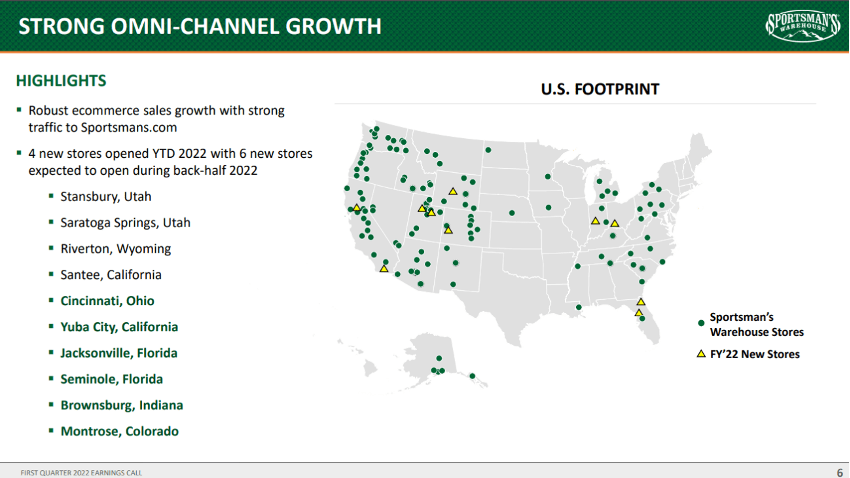
Financial Analysis & Valuation Angle
With a total sq foot of 4.94 million among 126 stores, management is looking to increase its square footage at a rate of 5% to 10% per year. SPWH growth has been through organic means, so their acquisition activity has not been very significant in recent years which can be confirmed by a small goodwill amount on the balance sheet. Since 2019 out of their four main acquisitions, three have been bargain purchases.
SPWH had a growth of 68% in revenues over a period of 8 years till 2019. In 2020 there was a lot of speculation about firearms getting banned in the US, so everyone rushed to buy them giving a one-off boost in sales of firearms for the whole industry. Covid also positively impacted this industry as the lockdowns turned people’s attention to these activities. These two factors gave a boost of 64% in revenues to SPWH in just one year.
After this, the company passed a billion-dollars in revenue, and they wanted to stay there, so they opened 23 new stores in just two years. The future growth dramatically depends on the performance of these new stores. SPWH has a good ROIC of 20-24%, so we expect the investments to be recovered rather quickly. So being on the conservative side and since we don’t want to pay for growth because SPWH has no competitive advantage, we are assuming a growth of 5% over the next five years.
Doing a $52 million share buyback in the first half of 2022 left SPWH with a cash position of just $6.018 million, down from an opening balance of $57.018 million. This concerns us since SPWH still has $23 million left of the initially approved limit of $75 million in buybacks. They might not be able to complete that. To meet their operational needs in an already squeezing margins environment, they might go for a long-term loan or increase their already $90 million revolving credit facility.
Operating Margins are squeezed because of inflationary pressures. Because of lower pricing power, SPWH has been unable to maintain its margins during these times, unlike its competitors, who managed to increase their margins in the same time period. Considering the historical margin data and the outlook, we are assuming an EBITDA margin of 8% for our model.
Depreciation and amortization have been relatively stable for SPWH over the years because they don’t own very complex assets and can depreciate them using a straight-line method giving a relatively stable D&A expense. On average, for the past ten years, D&A has been 2% of the sales. For our analysis, we are using the same rate.
Since SPWH has started a buyback program this year, we assume they will not be opening new stores as they have been doing for the past three years, in which they opened 34 new stores. So, we assume a CAPEX requirement of 2.5% of the revenue.
As SPWH was opening new stores, net working capital requirements have been increasing historically. 21ye saw an abnormal rise in nwc requirements which jumped up by $163 million due to deteriorating economic conditions and opening of new stores but going forward, we estimate these nwc requirements to normalize, so we are using a 1.5% of revenue as a nwc requirement rate each year.
We are using a tax rate of 25%. Although historically WACC of SPWH has been quite low, ranging from 5% to 6% but being on the conservative side and to incorporate future and present risks, we are using a WACC of 9%. We are also relying on a terminal growth rate of 1%.
DCF Analysis
Moat Investing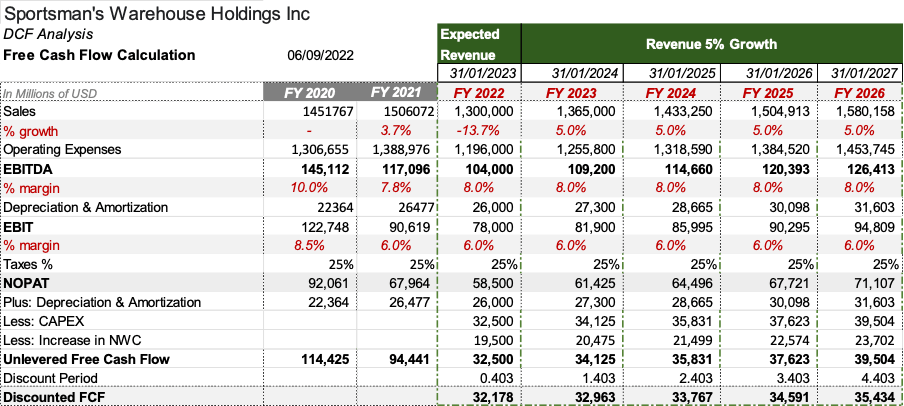
Sensitivity analysis
We have performed a sensitivity analysis on the primary value drivers affecting the potential upside. It is worth noting that around 75% of the equity value is based on the terminal value. Thus, our valuation is extremely sensitive to changes in WACC and Terminal Growth. Also, since we are in an increasing interest rates environment, and SPWH might have to acquire more debt, it is helpful to see the valuation under different WACC and terminal growth scenarios. In the following table, we have a sensitivity analysis of potential upside and downside with respect to our intrinsic equity value.
Moat Investing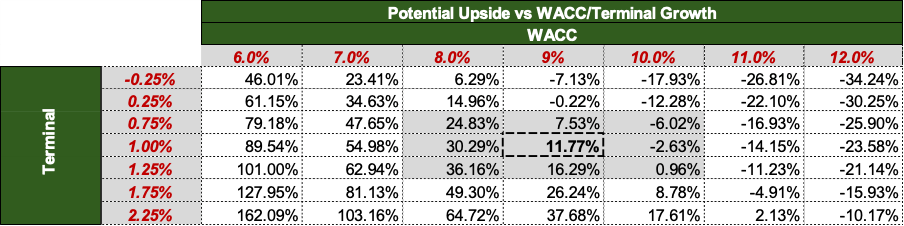
Considering our Operating Margins discussion and the inability of SPWH, unlike its competitors, to even maintain their margins in the high inflationary periods, the table below shows the sensitivity analysis, which is quite helpful in understanding this impact.
Moat Investing
It’s very interesting to see how the sportsman’s warehouse performs on different revenue growth rates since the growth exploded because of a one-off event in 2020,
Conclusion
Our Intrinsic valuation based on the above valuation model and assumptions tells us that the stock is fairly valued at around USD 10.25 per share. We are not extending a buy rating because of SPWH’s inability to deal with inflationary pressures, overreliance on firearm sales compared to peers, and considerable investments in growth.
We are looking for a margin of safety and eventually target an entry price of around USD 7.5 per share, which is close to the book value per share of USD 6.7 per share and an exit price of around USD 11 per share.
it is very crucial to understand the impact revenue growth may have on the stock valuation. Looking at average revenue growth rates of 6.6% for the past five years before 2020, the sensitivity analysis below dramatically helps in understanding this impact.
Be the first to comment