

akinbostanci
Investment Thesis
Income-oriented investors may want to consider the Invesco S&P 500 High Dividend Low Volatility ETF (NYSEARCA:SPHD), a monthly payer expected to yield an annualized 4.25%. Additional features include a 0.86 five-year beta and an attractive 16.57x forward earnings valuation, which all suggest SPHD is an excellent choice for income-oriented investors looking for some potential capital appreciation. However, I’m maintaining my hold rating because its other features aren’t impressive. Compared to the Schwab U.S. Dividend Equity ETF (SCHD), SPHD lags in all growth areas, has a higher dividend payout ratio, is much less profitable, and is coming off only a mediocre earnings season. In short, SPHD is most suitable for income-oriented investors wanting slightly better downside protection and monthly dividends. However, for all other investor types, I don’t recommend buying it.
ETF Overview
Strategy Discussion
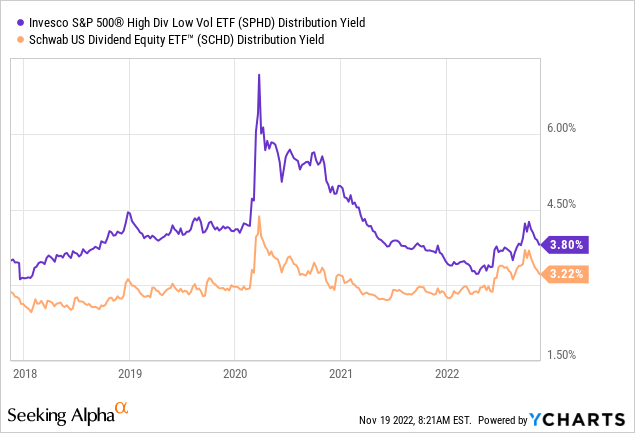
SPHD tracks the S&P 500 Low Volatility High Dividend Index. The selection process begins by identifying the top 75 securities in the S&P 500 Index by trailing dividend yield and removing the 25 most volatile ones according to price volatility over the last year. The order of operations is key. Achieving a high yield is the primary objective, while low volatility is the secondary objective. With fundamental data on 850+ U.S. equity ETFs, including 90 in the dividend or low-volatility category, I can confirm this to be true. SPHD currently has a gross 4.68% dividend yield and a 0.86 five-year beta. Meanwhile, the average gross dividend yield for dividend ETFs is 3.43%, and the average five-year beta for low-volatility ETFs is 0.82.
The Index is yield-weighted and has security weights ranging between 0.5% and 3.0%, with no more than ten securities per sector. In addition, sector exposure is limited to 25%, and the Index reconstitutes semi-annually at the end of January and July.
I’ve reviewed SPHD many times on Seeking Alpha. Initially, I questioned if one-year price volatility was sufficient, but my independent research confirmed it likely is. Most times, it didn’t matter if one-, two-, or three-year price volatility was used; the fund’s composition at the sector level was similar. However, we’ll need to focus on the individual securities. After all, it’s a focused 50-stock fund, and most holdings considerably impact the portfolio.
Sector Exposures and Top Holdings
Relative to SPY, SPHD overweights Real Estate (18.40%), Utilities (17.62%), and Consumer Staples (14.48%), which is what most investors would expect. As I discussed in my previous review, SPHD’s high exposure to Real Estate is a unique feature since most dividend ETFs avoid REITs to provide 100% qualified income to shareholders. The downside is a higher tax bill if held in a cash account, but it saves you the trouble of managing multiple ETFs and likely boosts your income accordingly.
Morningstar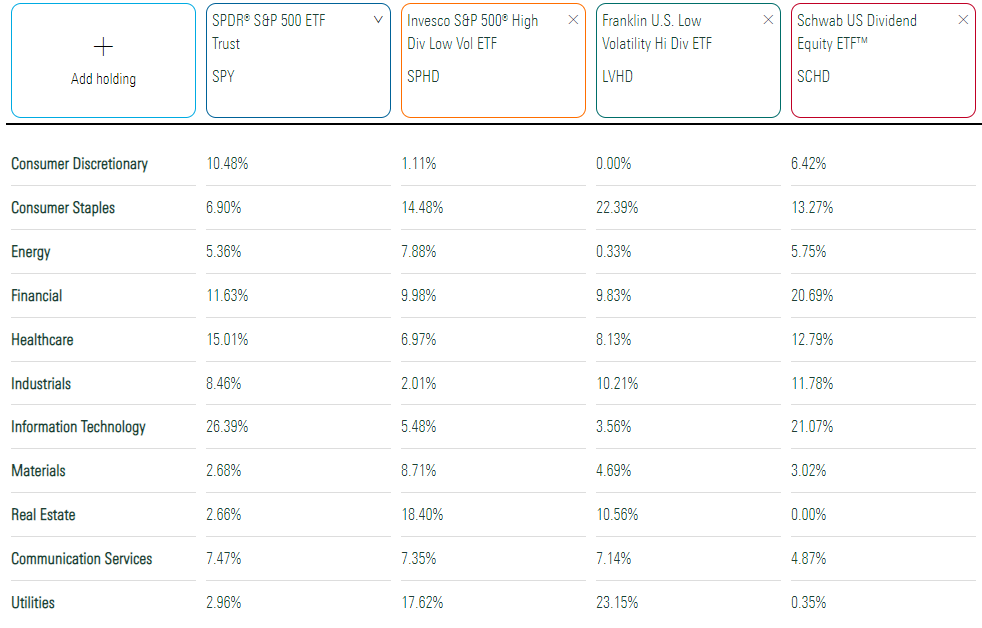
This table also includes allocations for the SCHD, the SPDR S&P 500 ETF (SPY), and the Franklin U.S. Low Volatility High Dividend ETF (LVHD). As the latter’s name suggests, it follows a similar strategy as SPHD. However, SPHD looks better diversified by sector. LVHD is nearly 50% Consumer Staples and Utilities, which is too concentrated.
SPY and SCHD, as indicated by higher exposure to Technology stocks, are obviously for more growth-oriented investors. However, while SPY’s five-year beta is close to 1.00, SCHD’s is 0.91, similar to SPHD’s 0.86. Beta measures a security’s volatility relative to the overall market, so SPHD might not offer as much downside protection as you’d like. After all, it’s still an equity ETF.
SPHD’s top ten holdings are below, led by AT&T (T), Kinder Morgan (KMI), and Altria Group (MO). These top ten total 27.17%, and the top 25 total 59.48%, which is well-below SCHD’s 75.62% despite having half the holdings. However, SPHD only touches 28 unique GICS industries, so despite the security and sector cap rules described earlier, it still has some diversification issues. I recommend using it as a complementary ETF to a broad-market fund rather than a substitute.
Invesco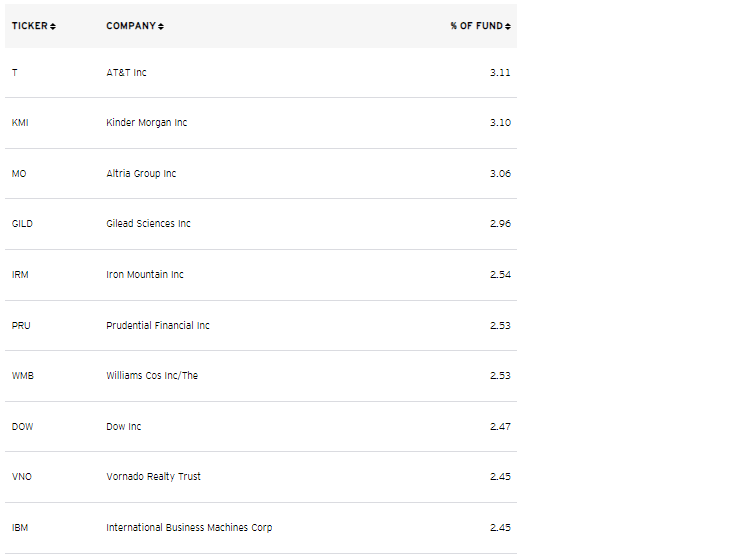
Performance Analysis
Capital Gains, No Reinvested Dividends
The following table highlights only the capital gains for SPHD and SCHD since November 2012. Furthermore, I’ve set the simulation not to reinvest dividends to benefit the income investor requiring cash payments.
Portfolio Visualizer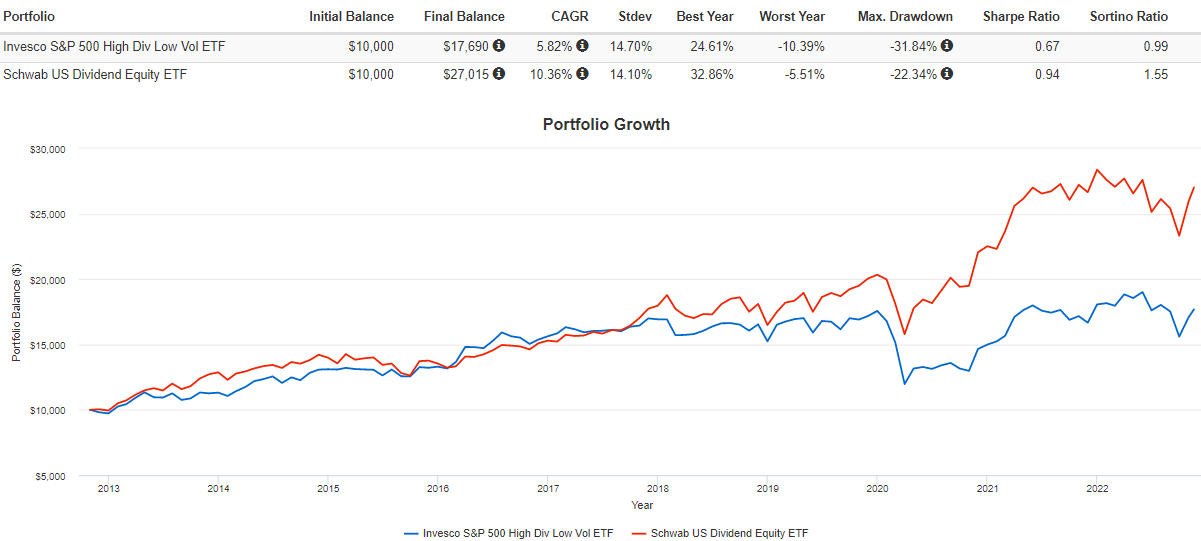
SPHD shareholders would gain an annualized 5.82% over the last ten years vs. 10.36% for SCHD. SPHD’s 14.70% annualized standard deviation and 31.84% drawdown in Q1 2020 were both worse, indicating that low volatility is the secondary objective.
The second piece is the income generated, detailed below, based on an initial $10,000 investment. SPHD’s 2022 income is $586 based on ten monthly dividend payments or an estimated $703 for the entire year. SCHD’s is $653 for three quarterly dividend payments or an estimated $871 for the year.
Portfolio Visualizer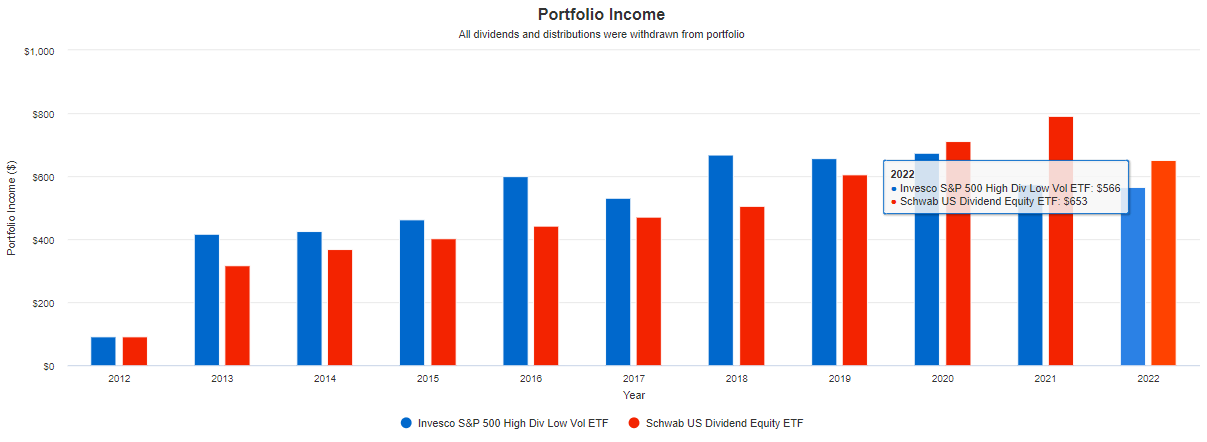
These results may be surprising to some, given how SPHD typically has a much higher yield. However, it speaks to the superior quality of SCHD. Despite the higher yield, if SPHD’s underlying assets aren’t growing very much, neither will your distributions. That’s why it’s essential to assess the quality of the underlying first and not buy based on dividends alone.
Total Returns With Reinvested Dividends
The following chart will benefit dividend growth investors who want to build up an income stream for future use, perhaps in retirement. I’ve set the simulation to show the total returns with reinvested dividends, as is standard when discussing performance.
Portfolio Visualizer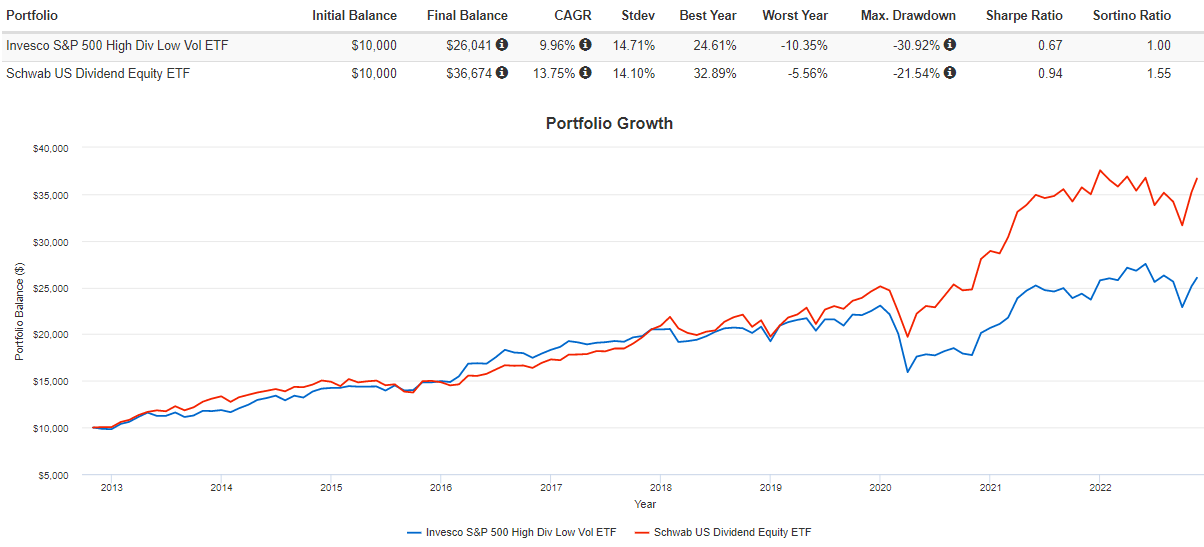
SPHD’s annualized returns were 9.96% compared to 13.75% for SCHD, a significant gap. Drawdowns and dividend growth were better for both ETFs. SPHD’s YTD portfolio income on a $10,000 initial investment was $818 ($982 annually) vs. SCHD’s $871 ($1,161 annually).
Portfolio Visualizer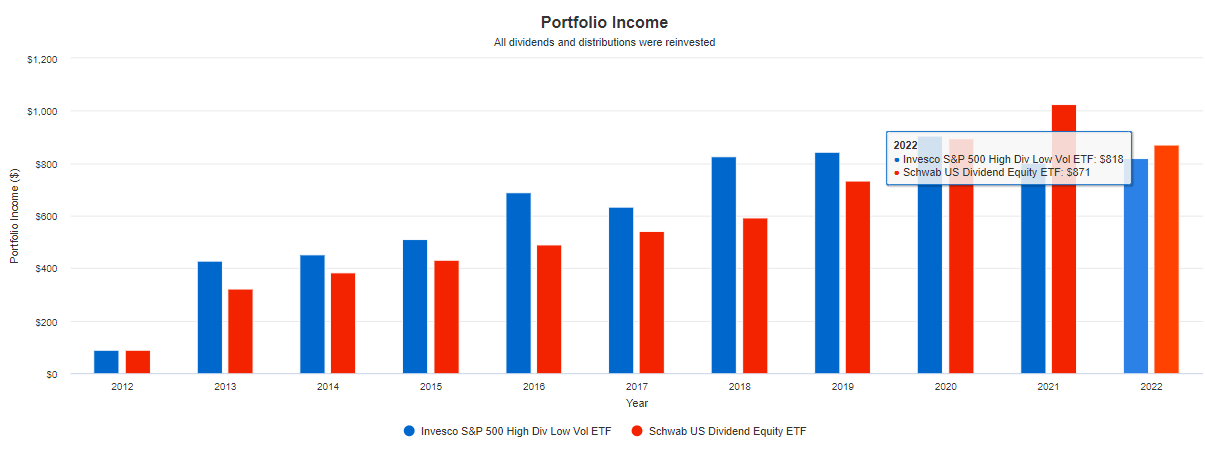
Finally, note how in 2018, SPHD’s portfolio income was much larger ($827 vs. $594) due to the two ETFs having very similar share price performance from 2012-2018. Things went off the rails for SPHD beginning in 2019, and there’s an argument that the last few years are unlikely to repeat. If that’s true, SPHD may become a much better income investment. To determine that, let’s look at the fundamentals of each fund next.
Fundamental Analysis
Company Snapshot
The following table highlights selected fundamental metrics for SPHD’s top 25 holdings, with summaries for SPHD and SCHD in the bottom rows. This table gives a quick overview of the fund, which I’ll then use to dig deeper into some areas that concern me.
The Sunday Investor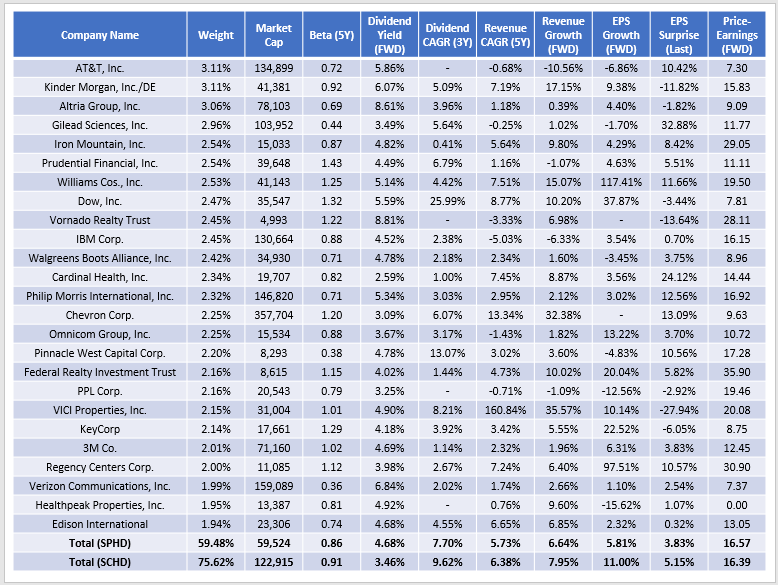
First, SPHD’s weighted-average market capitalization of $59.5 billion is $63.4 billion lower than SCHD’s. However, SPHD’s gross dividend yield of 4.68% is 1.24% higher. This relationship makes sense because price moves inversely with dividend yield. I just want to remind readers that high-yield securities generally have low market capitalizations and sometimes questionable quality.
Second, SPHD’s constituents have grown dividends by 7.70% per year over the last three years compared to 9.62% for SCHD. However, most top holdings are slow growers like Altria Group (MO) and Iron Mountain (IRM). A few outliers, which I’ve tried to control for in my calculation, are identified below.
Seeking Alpha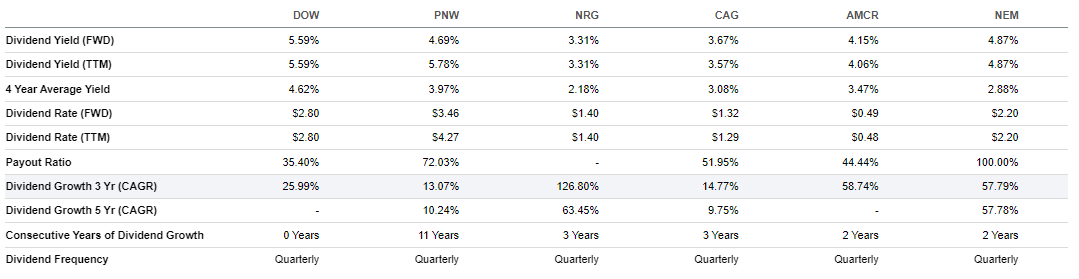
Third, SPHD’s estimated earnings growth of 5.81% is much lower than SCHD’s 11.00%, although estimated sales growth is similar (5.73% vs. 6.38%). In these cases, understanding the sector exposure differences is the key. Recall SCHD has nearly 21% exposure to Financials stocks compared to 10% for SPHD. Many of SCHD’s Financials stocks are smaller regional banks expected to grow earnings by way of higher interest rates, and it’s questionable how much of this growth will materialize. Still, SPHD is undoubtedly the “less-growthy” fund, which could be problematic from the perspective of dividend growth and capital returns.
Fourth, both funds trade at around 16.50x forward earnings. In early September, SPHD sold at a premium (17.75x vs. 15.20x), so you may view it as a bargain today. Additional valuation ratios for SPHD vs. SCHD include:
- Trailing P/E: 23.04 vs. 20.88
- Trailing P/B: 5.06 vs. 12.06
- Trailing P/CF: 10.81 vs. 14.79
- Trailing P/S: 2.93 vs. 3.48
In addition, SPHD has a better Seeking Alpha Value Score (6.15 vs. 4.40), which I’ve calculated based on individual stock grades and normalized on a ten-point scale. Therefore, SPHD is likely the better value ETF, which may prove beneficial if markets trend downward.
Finally, SPHD looks to have had a worse Q3 earnings season than SPHD, with a weighted-average earnings surprise of just 3.83% vs. 5.15% for SCHD. Neither figure is particularly impressive, as a 5-7% earnings surprise figure is the long-term average, according to my calculations based on data from Yardeni Research.
Concern #1: Future Dividend Growth Is Questionable
As discussed, SPHD is a slow-growth fund. It was that way historically, and the fundamentals suggest it will continue. One reason for limited future dividend growth is that the earnings growth isn’t there to support it. Furthermore, dividend payout ratios already look stretched, as summarized below.
The Sunday Investor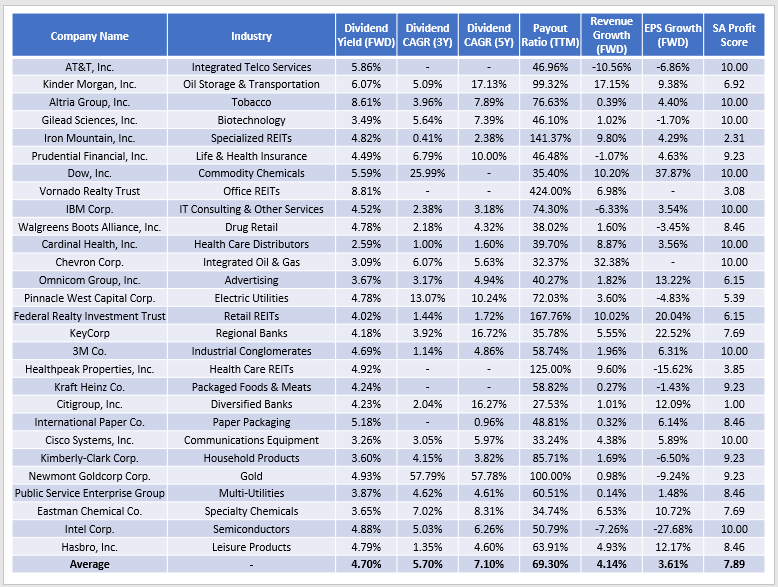
This stock sample has an average 5.70% and 7.10% three- and five-year dividend growth rate but only 4.14% revenue growth and 3.61% earnings growth. Payout ratios exceed 60% for several companies, a standard threshold for assessing dividend safety. While there are a few outliers, particularly among Real Estate securities where the ratio has less relevance, about a third exceed this threshold. These companies are listed below alongside their Seeking Alpha Dividend Safety Grades.
- Kinder Morgan (KMI): B-
- Altria Group (MO): C
- IBM (IBM): B-
- Pinnacle West Capital (PNW): B+
- Kimberly-Clark (KMB): B+
- Newmont (NEM): B-
- Hasbro (HAS): D
The weighted-average Dividend Safety Score on a ten-point scale for SPHD is 6.10 compared to 7.00. Furthermore, SPHD has a 7.91 Profitability Score (7.89 in the sample above) compared to 9.31 for SCHD. Therefore, SPHD is not in a favorable position to increase its dividends. The primary benefit is a high guaranteed dividend today, which may be enough for income investors with short time horizons.
Concern #2: Lackluster Earnings Momentum
The 3.83% weighted-average earnings surprise figure cited earlier is the second area of concern for me, given how SCHD achieved 5.15%. However, it’s still better than what the S&P 500 Index reached in aggregate (3.40%). Also, revenue surprises were better (6.05% vs. 2.20%), and several good news headlines should help keep SPHD’s share price solid in the near term.
The Sunday Investor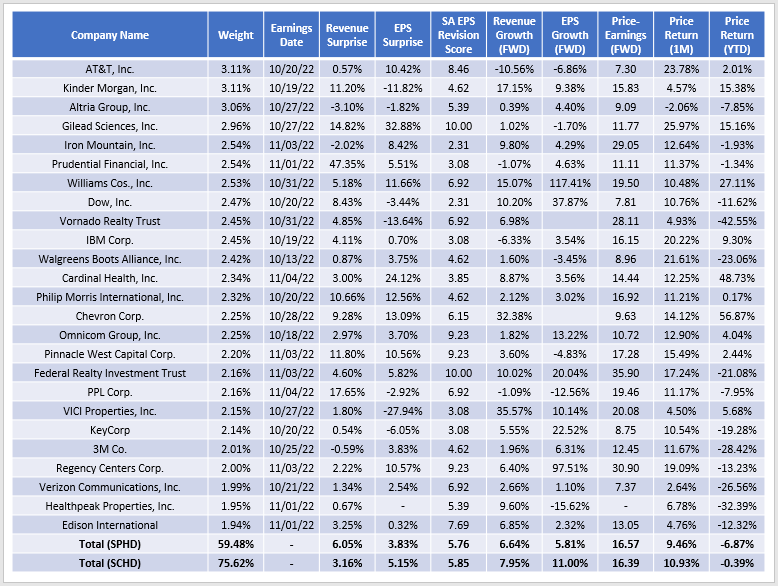
The correlation between a company’s price returns over the last month and its earnings results is clear. Those which reported strong results, like AT&T (T) and Gilead Sciences (GILD), managed to erase their YTD losses over the last month. Others, like Kinder Morgan (KMI) and Altria Group (MO), faltered due to negative revenue or earnings surprises. Accordingly, analysts end up downgrading future earnings estimates, creating a pile-on effect that’s sometimes unappreciated by investors.
Fortunately, SPHD’s 5.76 weighted-average EPS Revision Score is only slightly behind SCHD’s 5.85 and better than SPY’s 5.39. In addition, the described pile-on effect primarily impacts high P/E stocks, which most value and dividend funds exclude. Therefore, I expect SPHD to be mostly protected going forward, and I’m not as concerned anymore about slow earnings momentum.
Investment Recommendation
I rated SPHD a hold because it trades at just 16.57x forward earnings and should provide modest downside protection, as suggested by its 0.86 five-year beta. Also, the estimated 4.25% dividend yield looks achievable due to its constituents’ gross 4.68% dividend yield and the fund’s 0.30% expense ratio. Today represents a nice opportunity to lock in this above-average yield while maintaining the long-term safety S&P 500 Index stocks typically offer.
However, SPHD has faults. Its relatively poor historical track record highlights how low share price growth can affect portfolio income. Moreover, its current portfolio’s fundamentals suggest that it will likely continue. When compared to SCHD, SPHD has lower sales, earnings, and dividend growth, weaker overall profitability, and in some cases, concerning dividend payout ratios. These metrics negatively impact SPHD’s ability to meet an investor’s income needs in the long run, and therefore, I would not recommend dividend growth investors buy it. Thank you for reading, and I look forward to the discussion in the comments section below.
Be the first to comment